Wet End Inline NIR Spectrometer Calibration Procedures
Inline wet end NIR accuracy relies on rigorous grab sampling, robust multivariate scatter correction, and continuous laboratory oven-dry offset tracking.
Wire
Stock flowing out of the headbox carries ninety-nine parts water to one part cellulose fibre. Inline near-infrared instrumentation mounted over the forming fabric tracks this dilution to stabilize drainage across vacuum boxes and control sheet consolidation ahead of the press nips. Measuring water mass at this position establishes the mass balance foundation for the entire paper machine.
When consistency fluctuates here, basis weight drifts at the reel. Liquid water flattens fine cellulose peaks. Water absorbs near-infrared radiation aggressively.
Photons penetrating the wet web encounter intense fundamental vibrational combinations at 1940 nanometres and first overtones at 1450 nanometres. These liquid-phase absorption bands dwarf the subtle C-H and O-H stretching overtones of cellulose located between 2100 and 2300 nanometres.
Forming Section Water Mass Ratios
Papermakers balance drainage tables to strip liquid before the first vacuum slot. A sensor mounted over the early fourdrinier table encounters a slurry containing between 0.5 percent and 1.5 percent solids. At the couch roll, vacuum suction elevates web consistency to twenty percent solids.
This twenty-fold increase in solids alters the physical state of the stock from a turbulent liquid suspension to an interlocking fibrous mat. Reflectance measurements at the headbox rely almost entirely on light backscattered from suspended fibres through an optical path dominated by bulk water. Free water at ninety-nine percent dilution causes complete optical saturation at the 1940 nanometre absorption band when the optical pathlength exceeds two millimetres.
Free water at ninety percent sheet consistency obscures cellulose overtone reflectance through broad infrared absorption.
Detectors operating over the forming fabric utilize weaker overtone bands between 950 nanometres and 1100 nanometres to maintain linear response ranges. Secondary absorption bands permit light penetration into the slurry without complete photon extinction. High dilution limits the backscattered signal returning to the collection optics.
Photons travel deep into the white water tray beneath the wire unless high-efficiency reflectors or angled illumination geometries redirect light back to the photodiode array. The couch roll presents severe turbulence. Consistency shifts displace the optical baseline.
Operators adjust chest agitation speeds. Changes in mechanical refining introduce fine cellulose particles that alter slurry turbidity independently of total consistency.
Spectral Saturation at Low Consistency
Liquid layers exceeding two millimetres extinguish direct infrared reflections across every primary diagnostic band. Calibrating an inline spectrometer over high-moisture slurry requires optical pathlength restriction or the selection of higher-order overtone bands where the molar absorptivity of water drops by orders of magnitude. The absorption coefficient of liquid water reaches approximately 115 inverse centimetres at 1940 nanometres under standard laboratory conditions at 23 degrees Celsius.
At 970 nanometres, this coefficient drops to approximately 0.45 inverse centimetres. This physical variance dictates detector selection across the forming table.
Spectrometers positioned immediately after the slice lip monitor stock consistency using the 970 nanometre and 1200 nanometre windows. Spectrometers installed after the dry suction boxes utilize the 1450 nanometre band as solids levels rise above fifteen percent. Attempting to deploy a single chemometric regression model across both zones creates severe mathematical errors.
The physical nature of the scattering centres transitions from isolated, freely rotating fibres in water to a consolidated porous network containing trapped capillary water and surface water films. Misaligned wet end calibrations cause operators to over-dry the web in the main cylinder bank, driving up boiler fuel expenditure while reducing net finished metric tonnage at the reel.

Beam
Tungsten-halogen emitters project broad-spectrum illumination through quartz light pipes directly toward the travelling web. Maintaining optical throughput in the humid environment of the paper machine requires specialized transceiver head construction. Ambient air around the wet end contains suspended water droplets, volatile organic additives, and temperatures routinely exceeding 45 degrees Celsius.
Optical heads employ vortex cooling tubes and heated sapphire windows to prevent condensation on external lenses. Clean steam purges keep sapphire transparent. A dirty optical window attenuates beam intensity, creating apparent moisture shifts that misguide control loops.

Which Optical Geometries Isolate Diffuse Backscatter?
Reflectance heads positioned at a seventy-five-degree angle collect photons redirected by cellulose filaments while rejecting mirror reflections from wet surface water. Specular reflection from surface moisture films contains no information about internal sheet consistency. Specular light carries the unattenuated spectrum of the halogen emitter, blinding the detector and artificially lowering the calculated absorbance values.
True diffuse reflectance originates from photons that penetrate beneath the surface film, undergo multiple scattering events off fibre boundaries, and exit back through the wet web.
A cleaner optical window yields a steadier chemometric baseline across temperature swings.
Dual-beam optical systems split the emitted light into a measurement beam focused on the wet web and an internal reference beam directed to an unexposed photodiode. Comparing the measurement signal against the internal reference compensates for emitter filament aging and thermal output decay. The physical orientation of the sensor head must accommodate wire sag, sheet flutter, and changes in machine speed.
When web-to-sensor distance shifts by more than two millimetres, diffuse signal collection drops dramatically, altering the calculated ratio between water and cellulose absorption peaks.
The following optical failure modes degrade inline spectrometer signals along the wet end of the machine:
- Window condensation fouling develops when purge air temperature falls below web sheet temperature, causing moisture droplets to coalesce across the sapphire lens.
- Specular glare saturation blinds the detector array when the sensor head aligns perpendicular to the water film on the wire.
- Thermal emitter decay shifts halogen lamp color temperature over extended production cycles, depressing short-wavelength signal ratios.
- Fibre splash accumulation coats the outer optical bezel with wet stock during sheet breaks, blocking diffuse light reception.

Environmental Interference along the Table
Airborne mists, steam plumes, and chemical foaming displace optical signals between the lens and the furnish. Ambient steam contains gaseous water molecules exhibiting narrow rotational-vibrational absorption lines within the identical spectral bands occupied by liquid water in the sheet. Uncompensated steam pockets between the sensor head and the wire create false moisture spikes.
High-velocity air knives operating at 150 kilopascals strip the boundary air layer, maintaining a clear optical path across the measurement gap. Optical windows collect condensation rapidly. Instrument housings incorporate continuous positive pressure air purge systems drawing instrument-grade dry air conditioned to minus 40 degrees Celsius dew point.
| Measurement Band | Wavelength Range | Dominant Molecular Bond | Wet End Water Sensitivity | Matrix Interference |
|---|---|---|---|---|
| Third Water Overtone | 960 to 990 nm | O-H symmetric stretch | Low absorption; high penetration | Titanium dioxide filler scatter |
| Second Water Overtone | 1180 to 1220 nm | O-H combination | Moderate absorption; 10 mm depth | Lignin aromatic C-H stretching |
| First Cellulose Overtone | 1420 to 1460 nm | C-H and O-H stretch | Strong overlap with water | Liquid water band saturation |
| Primary Water Combination | 1920 to 1960 nm | O-H stretch and bending | Extremely high; surface only | Cellulose hydroxyl extinction |
| Cellulose Combination Band | 2260 to 2320 nm | C-H stretch and C-C stretch | Low water interference | Alkyl ketene dimer size absorption |
Instrument vendors routinely claim their sealed optical heads resist all condensation and dust accumulation without manual intervention, attributing persistent reading errors to sudden furnish conductivity changes rather than dirty optics.

Grab
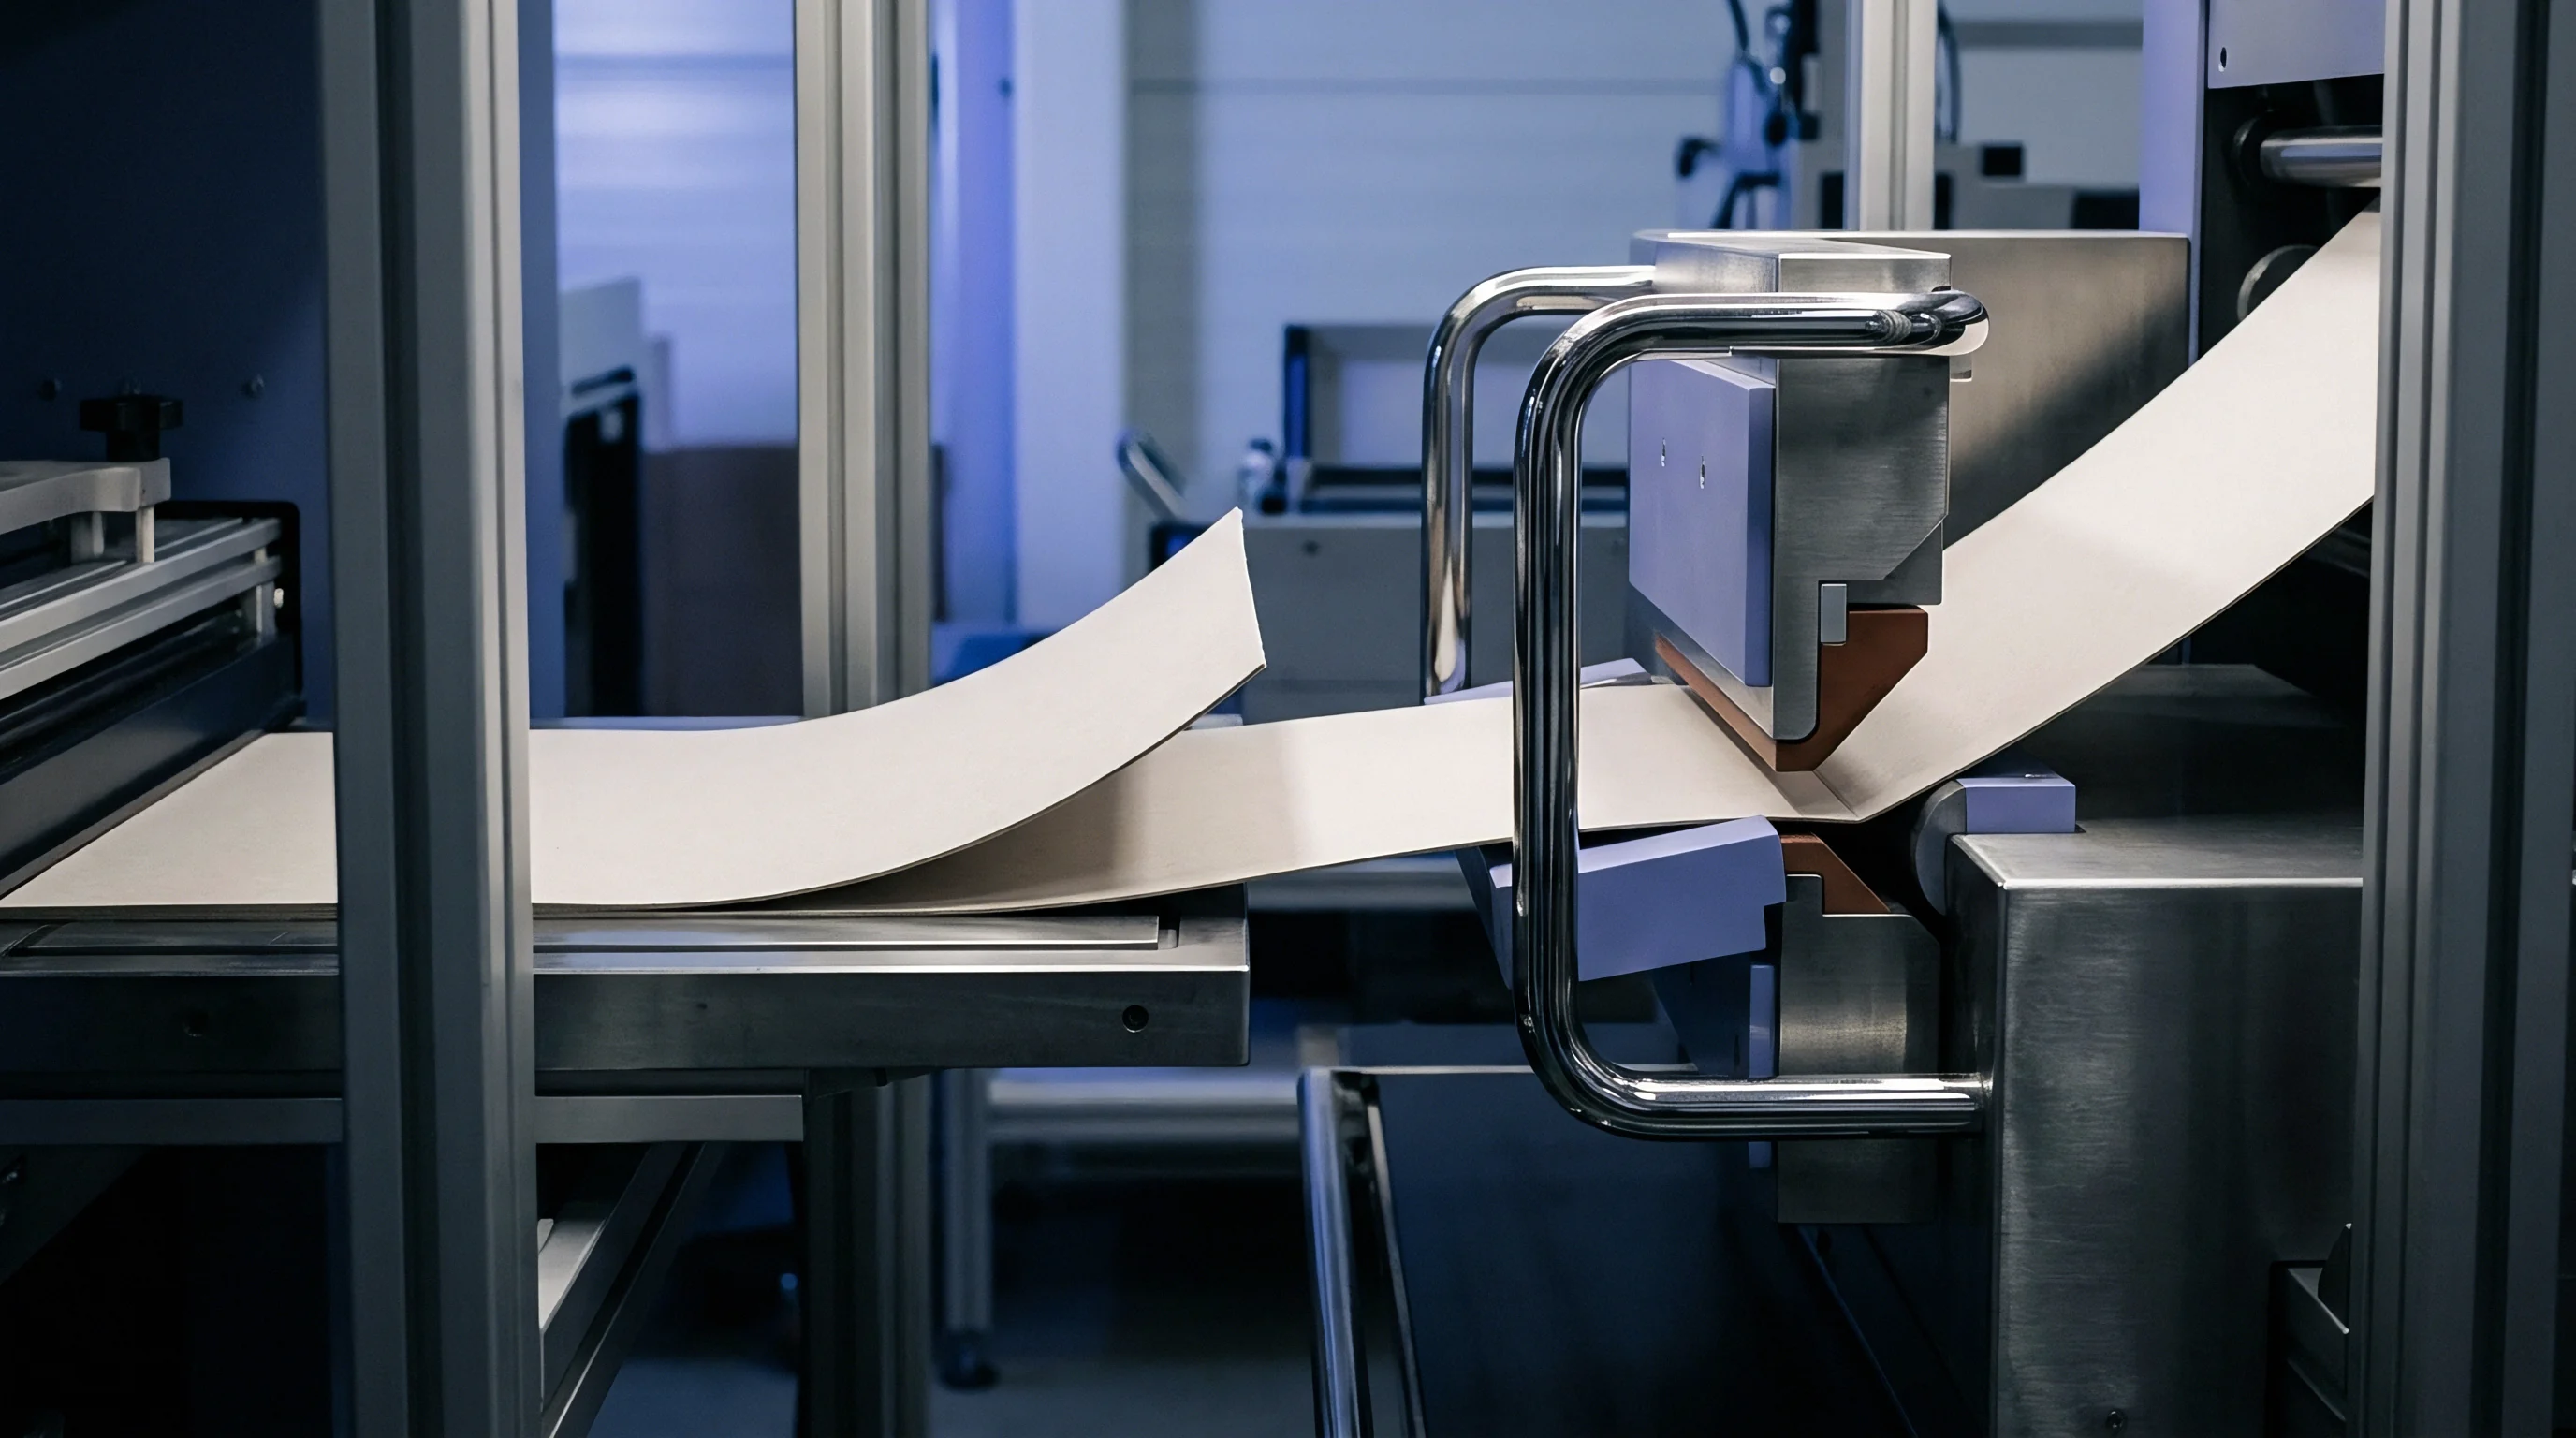
Technicians drop mechanical cutters directly behind the suction couch roll to isolate wet pulp wedges. Dynamic grab sampling links inline sensor voltage outputs to absolute moisture values determined by gravimetric analysis. Taking a reference sample from a web travelling at eight hundred metres per minute demands rigid procedural control.
Operators take samples across the cross direction to correspond with the fixed scanning head position. Any timing mismatch between the sensor timestamp and sample excision introduces calibration error. Oven drying takes four hours.
Standardized Oven Drying Benchmarks
Laboratory scales recording to four decimal places weigh wet samples sealed inside moisture-tight glass weighing bottles. Evaporative loss during transport from the machine wire to the analytical balance skews wet end calibrations. A five-gram sample of twenty-percent-consistency stock loses up to three percent of its total moisture within forty-five seconds when exposed to dry machine room air.
Technicians deposit excised samples into pre-weighed, airtight containers within three seconds of machine removal.
Testing according to ISO 287 with unsealed transport containers voids moisture dispute claims on delivered tonnage.
Drying procedures follow ISO 287 and TAPPI T 412 protocols, maintaining laboratory ovens at 105 degrees Celsius plus or minus two degrees until consecutive weighings spaced one hour apart show mass variation under 0.05 percent of sample weight. Accelerated microwave moisture analyzers reduce testing time from hours to minutes, yet uncalibrated microwave units burn cellulose fibres, generating false moisture readings through carbohydrate pyrolysis. Standard laboratory balances resolve four decimals.
The desk cannot fully defend the field practice of using unheated gravimetric plates for rapid wet-end checks. Ambient humidity re-enters dry test pads within seconds of oven exit, biasing calculated consistency downward. Buyers operating under strict quality assurance regimes reject mill calibrations built on open-air balance transfers.
The following sequence governs physical sample extraction and laboratory verification across dynamic wet end lines:
- Signal stabilization confirmation holds sensor head tracking over a dedicated cross-machine position for sixty seconds before sampling.
- Cross-web mechanical excision collects wet web strips across a five-hundred-millimetre width using non-shearing rotary blades.
- Airtight canister encapsulation drops extracted pulp into vapour-sealed aluminium containers within three seconds of wire departure.
- Analytical bench weighing records initial wet mass on balances calibrated to 0.0001 grams under controlled room conditioning.
- Desiccator jar cooling shields oven-dried sheets from ambient moisture absorption during post-bake thermal equilibration.

Dynamic Sample Collection Sequence
Operators coordinate extraction timing with scanner traverse heads using automated trigger relays. Dynamic sampling during a planned grade transition provides the broad moisture spread necessary to build a valid chemometric calibration curve. Capturing stock across a moisture range of seventy percent to eighty-five percent water requires deliberate, incremental adjustments to couch roll vacuum levels or forming wire foil angles.
Running a machine outside normal operating windows introduces product that fails final tensile specifications.
| Parameter | Rapid Field Canister Method | Standard Lab Oven Drying | Microwave Moisture Analyzer | |
|---|---|---|---|---|
| Target Standard | Internal Mill Execution | ISO 287 / TAPPI T 412 | SCAN-P 4:61 Modified | |
| Sample Mass Target | 20 to 50 g wet pulp | 50 to 100 g wet web | 5 to 10 g shredded pulp | |
| Extraction Container | Vapour-tight O-ring canister | Ground-glass weighing flask | Sealed disposable aluminium pan | |
| Drying Temperature | 105 ± 2 °C | 105 ± 2 °C | Variable microwave power curves | |
| Duration to Mass Stability | 180 to 240 minutes | 240 to 360 minutes | 6 to 12 minutes | |
| Measurement Repeatability | ± 0.25% moisture | ± 0.08% moisture | ± 0.40% moisture | |
| Laboratory reference values demand moisture loss calculations derived solely from tared containers sealed before oven removal. | ||||
Commercial grade purchase contracts adhering to ISO 287 Section 6.2 establish that moisture measurements taken without vapour-sealed tared containers forfeit all legal validity during supplier discrepancy arbitrations.

Matrix
Multivariate chemometrics transforms overlapping infrared absorption bands into discrete chemical predictions. The wet end presents a complex optical matrix where cellulose fibres, hemicellulose, lignin, native starches, synthetic sizing agents, and mineral fillers simultaneously absorb and scatter transmitted light. Partial least squares regression algorithms extract orthogonal latent variables that isolate water mass changes from background matrix variations.
Standard linear univariate calibrations fail completely on wet end web streams because physical light scattering coefficients shift with web compaction, beating degree, and filler retention.

Why Do Chemometric Latent Variables Collapse during Grade Shifts?
Changes in hardwood kraft ratios alter mean fibre length and physical scattering coefficients across the entire spectrum. Softwood fibres display higher mean aspect ratios and coarser wall thicknesses than birch or eucalyptus fibres, generating disparate diffuse reflectance scatter profiles at identical moisture contents. When a mill transitions production from virgin unbleached kraft liner to testliner containing eighty percent recycled corrugated container furnish, the NIR baseline drifts upward due to fine particle accumulation and residual carbon ink particles.
Partial least squares regressions achieve standard errors below 0.35 percent moisture when calibrated across ten latent variables on 120 gsm linerboard.
Recycled furnish introduces variable filler ratios. Calcium carbonate and talc absorb specific infrared wavelengths while altering physical web density. Calcium carbonate exhibits carbonate ion bending vibrations around 2500 nanometres and distinct overtone absorptions that overlap synthetic sizing bands.
An inline spectrometer calibrated solely on virgin pine pulp interprets the increased scattering of ground calcium carbonate as an apparent increase in dry fibre mass. The chemometric model underpredicts moisture content unless the calibration matrix explicitly includes multi-grade variation sets spanning the full range of furnish blends.
Developing a stable chemometric model for wet web scanning requires balancing several multivariate regression parameters:
- Spectral region selection restricts regression inputs to windows between 950 and 1350 nanometres, preventing detector saturation from deep fundamental water bands.
- Latent variable rank optimization limits regression dimensions to seven factors, preventing model overfitting on random machine electrical noise.
- Temperature factor expansion incorporates wet web thermal inputs directly into the training matrix to offset thermal hydrogen-bond shifts.
- Furnish orthogonalization projects mineral filler absorption spectra into separate latent dimensions, shielding moisture predictions from ash variations.

Mathematical Preprocessing and Baseline Correction
Standard normal variate transformations scale individual spectral traces against their standard deviation to eliminate pathlength variance. Wet end web flutter causes the absolute distance between the optical transceiver and the sheet to cycle continuously. Standard normal variate processing removes multiplicative scatter interference caused by distance changes.
First and second derivative transformations, calculated using the Savitzky-Golay algorithm with a nine-point smoothing window, resolve overlapping absorption shoulders and eliminate linear baseline offsets caused by machine room dust accumulation.
Similar mathematical challenges occur in pharmaceutical fluid bed drying where granules undergo rapid moisture transitions amidst turbulent particle circulation. Diffuse reflectance spectra taken through fluid bed sight glasses exhibit baseline jumps identical to those recorded above paper machine fourdrinier wires. In both industrial environments, second derivative math isolates the chemical absorption peak from the physical scatter baseline shift.
Calibration robustness rests on the standard error of prediction. A typical calibration dataset constructed for a fourdrinier machine running 150 gsm linerboard relies on sixty validated grab samples collected during stable operations. This dataset achieves a standard error of prediction of 0.28 percent moisture across a range of 72 percent to 82 percent water.
Introducing fifteen percent deinked recycled furnish immediately widens this standard error to 0.65 percent moisture. The calibration model breaks because short recycled fibres increase specific surface area, shifting the ratio of free capillary water to bound intracellular water. Bound water molecules exhibit shifted O-H vibrational frequencies relative to bulk water, destabilizing the fixed spectral loading vectors.
Whether nonlinear neural network regressions can maintain long-term stability across recycled furnishes without demanding continuous calibration sample additions remains an open technical dispute among process engineers.

Bias
Long-term sensor stability depends on tracking systematic divergence between inline predictions and daily laboratory gravimetric tests. Inline near-infrared spectrometers operate in extreme conditions that induce mechanical and thermal drift over time. Optical source degradation, dirt deposition on mirrors, mechanical vibration, and electronic component aging create steady calibration offsets.
Detecting these offsets requires structured control charting rather than ad-hoc model tampering.
Slope Intercept Recalibration Mechanics
Maintenance crews adjust software offset values using running five-day moving averages of laboratory verification splits. Modifying the underlying multivariate chemometric model on a running paper machine creates operational chaos. When daily verification reveals a persistent difference between the spectrometer readout and the laboratory oven results, technicians apply simple slope and intercept corrections.
Adjusting the intercept shifts the calibration curve up or down to correct for baseline contamination. Adjusting the slope rotates the calibration line around its centroid, correcting for furnish scattering changes.
Every grammage transition moves the curve. Operators verify that at least ten paired samples substantiate an observed bias before altering intercept values in the distributed control system. Adjusting an inline calibration based on a single grab sample incorporates random sampling error directly into the automatic moisture control loop.
High moisture softens sheet structure. Over-drying wastes expensive boiler steam.
Tonnage Economics of Moisture Drift
Operating a corrugated linerboard machine below targeted water content burns excess boiler gas while throwing away saleable mass. Paper and packaging boards sell on total metric tonnage. Moisture delivered within contract specifications represents saleable weight generated without fibre cost.
Take a machine producing 120,000 metric tonnes per annum of 140 gsm testliner at a targeted reel moisture of 7.5 percent. Assume the inline wet end NIR sensor develops an uncorrected positive calibration bias of 0.8 percent moisture. The sensor reports the web at 7.5 percent moisture when true moisture sits at 6.7 percent.
The automated drying controls react by holding steam pressure high throughout the dryer banks. The mill runs continuously under-moistured by 0.8 percent.
To produce the contracted 120,000 tonnes of finished board at 6.7 percent moisture rather than 7.5 percent moisture, the mill consumes additional cellulose furnish to replace missing water mass. Delivering 0.8 percent additional dry fibre across 120,000 tonnes requires 960 metric tonnes of extra furnish annually. At a market cost of 210 euros per metric tonne for unbleached secondary fibre, this uncalibrated sensor bias generates an annual fibre giveaway cost of 201,600 euros.
| Target Moisture Band | Calibrated NIR Deviation | Fibre Give-Away per Annum | Steam Overconsumption Cost | Net Annual Fiscal Impact |
|---|---|---|---|---|
| 7.5% Target (Standard) | 0.00% Zero Drift | 0 tonnes | 0 EUR | 0 EUR |
| 7.3% Minor Over-Dry | +0.20% Positive Bias | 240 tonnes | 12,768 EUR | 63,168 EUR |
| 7.0% Moderate Over-Dry | +0.50% Positive Bias | 600 tonnes | 31,920 EUR | 157,920 EUR |
| 6.7% Severe Over-Dry | +0.80% Positive Bias | 960 tonnes | 51,072 EUR | 252,672 EUR |
| 6.5% Extreme Over-Dry | +1.00% Positive Bias | 1,200 tonnes | 63,840 EUR | 315,840 EUR |
Drying energy costs compound this loss. Removing that 0.8 percent of water in the dryer section consumes 1.4 tonnes of low-pressure steam per tonne of evaporated water. Evaporating 960 tonnes of water requires 1,344 tonnes of process steam.
At 38 euros per tonne of generated steam, energy waste reaches 51,072 euros. Dryer steam consumption escalates immediately. Total direct annual loss from this single 0.8 percent sensor bias totals 252,672 euros.
Trust laboratory balances over inline readouts whenever wet furnish recipes change abruptly between shifts.