Standardized Tone Value Increase Calibration Protocols across Variable Substrate Grades
Standardized TVI calibration requires substrate-relative spectral curves, M1 spectrophotometry, and dynamic CTP curve adjustments matched to sheet porosity.

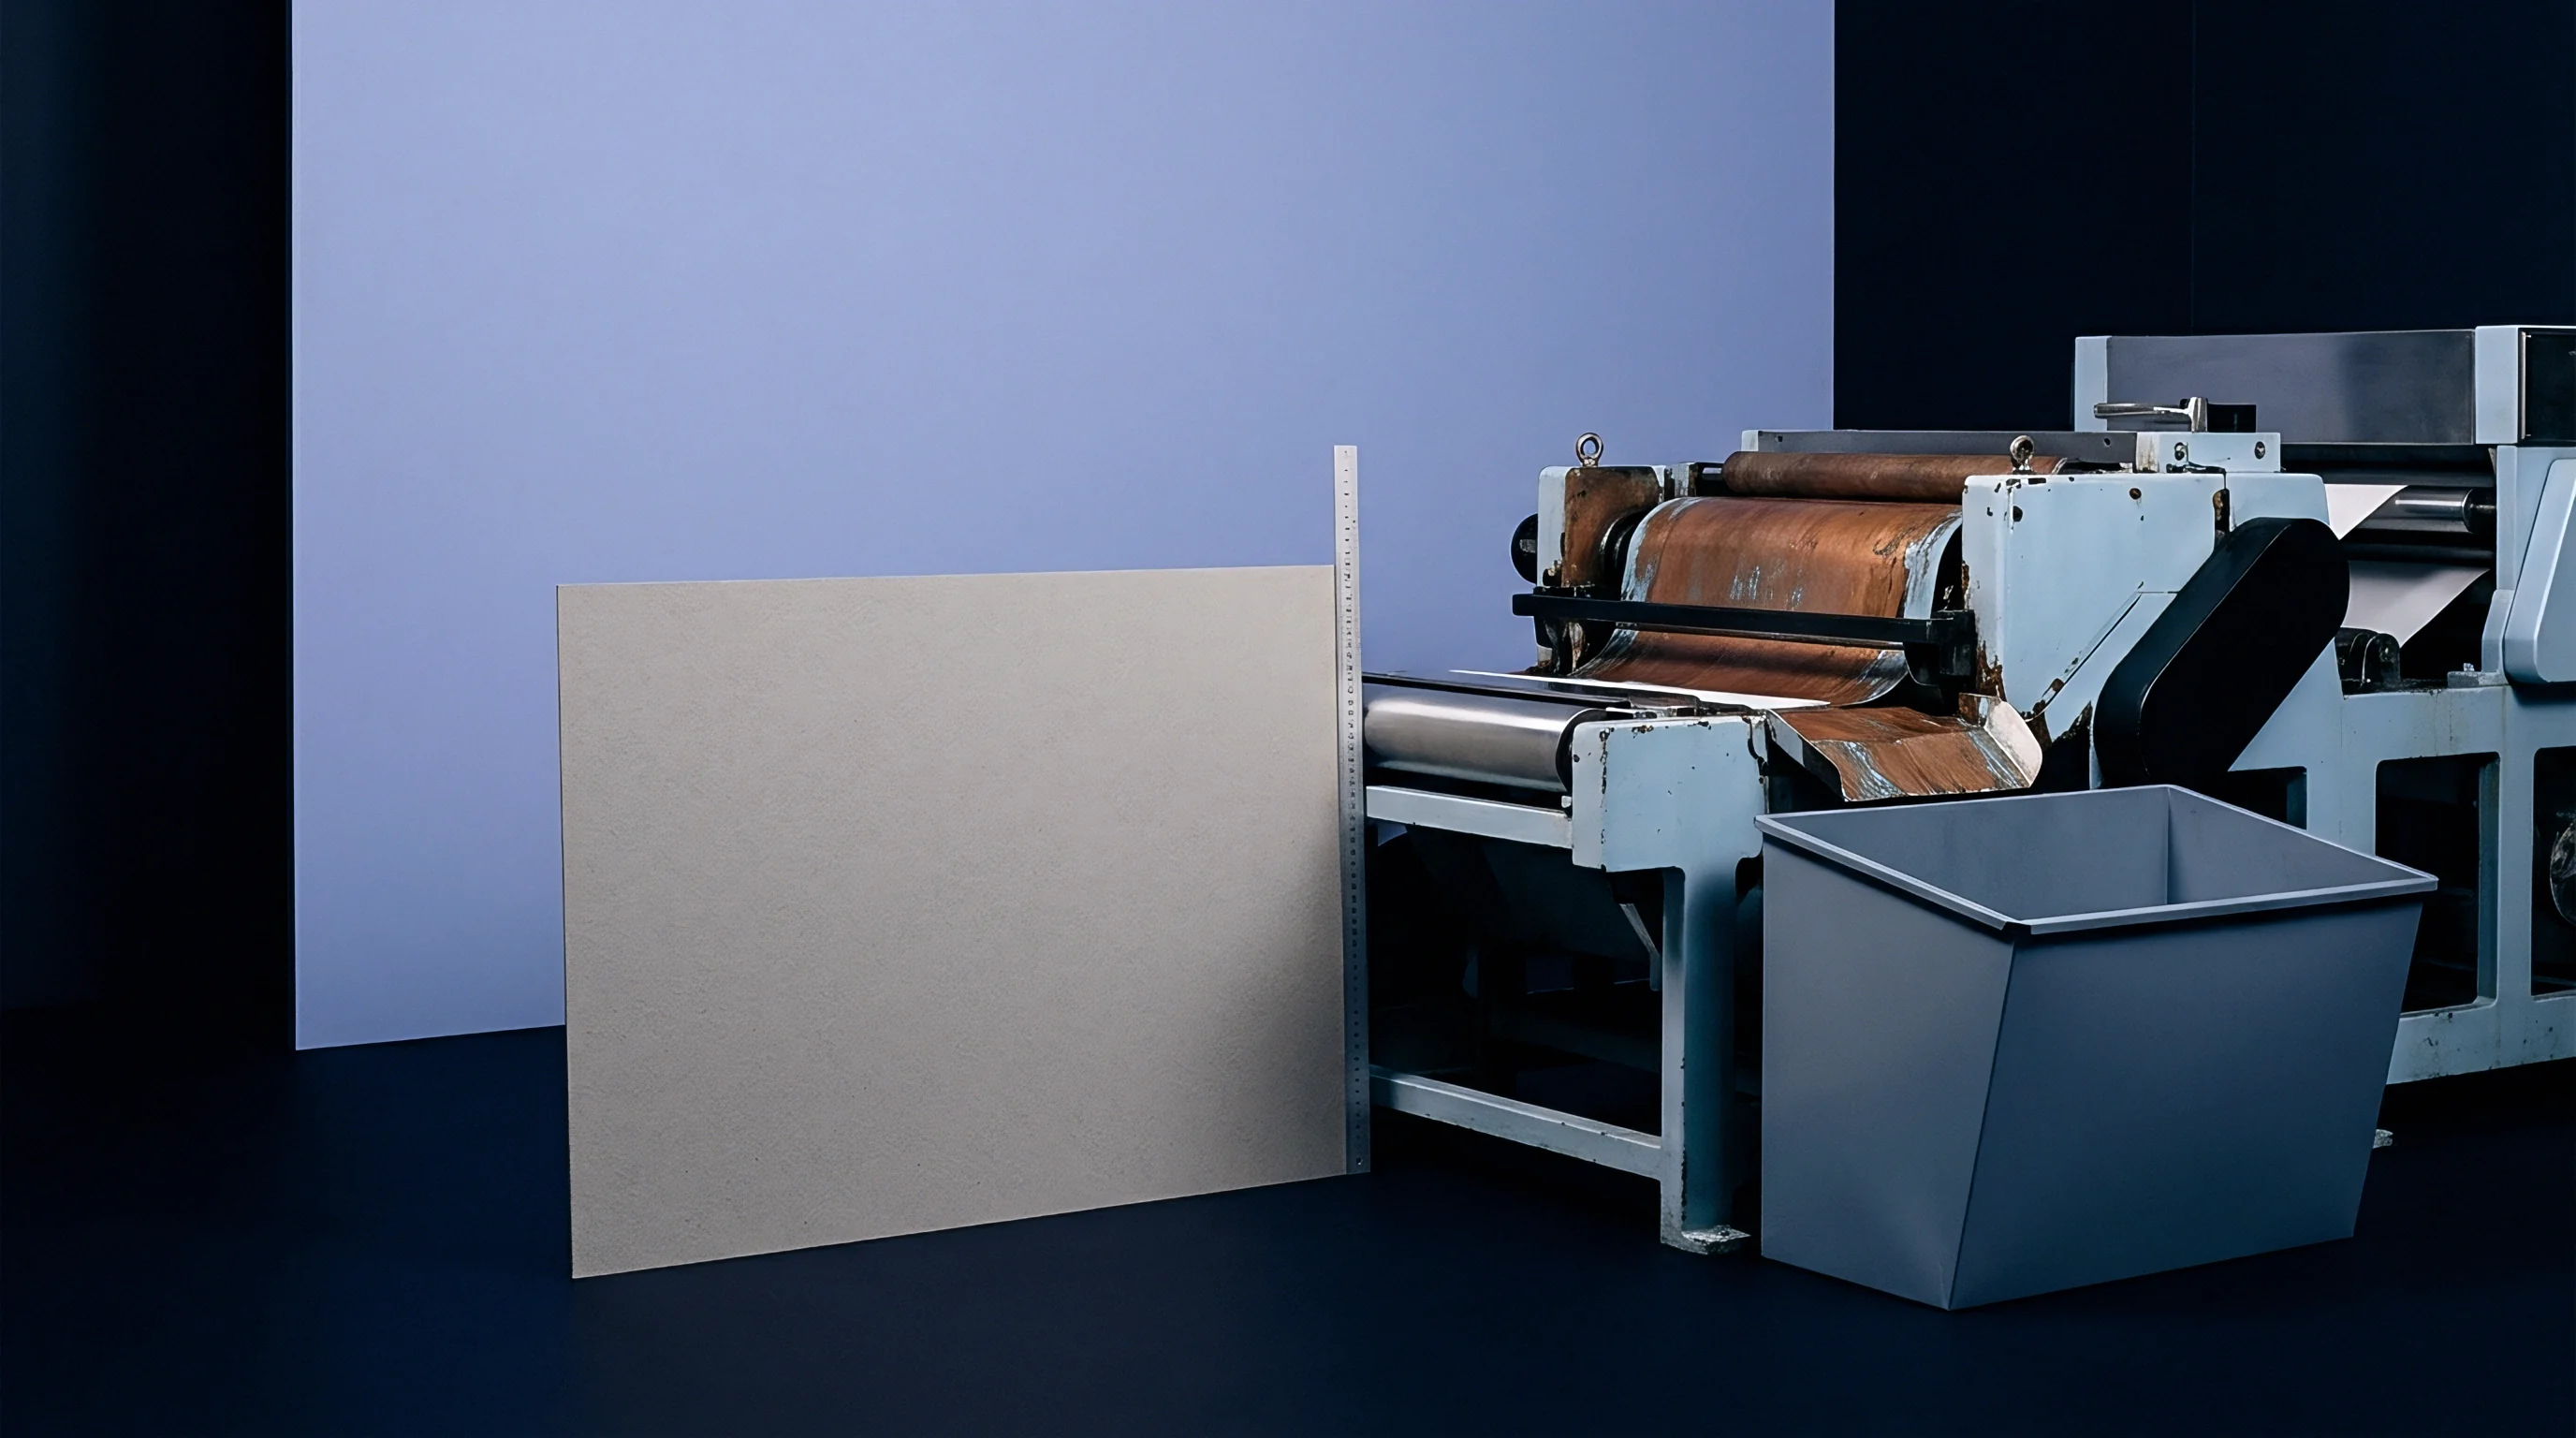
Pore

Substrate Microstructure and Fluid Penetration Kinetics
Applying liquid ink to paper triggers immediate physical and optical changes across the surface matrix. When offset ink hits the sheet, capillary forces within the void network pull the fluid vehicle away from pigment particles. Surface pores absorb the liquid binder while trapping pigment agglomerates at the surface.
On heavily coated stocks with mean pore diameters below 0.1 micrometers, binder drainage proceeds at a controlled rate, restricting lateral fluid spread and keeping halftone dot perimeters crisp. High-density calcium carbonate and kaolin clay coatings establish a uniform capillary lattice that stabilizes pigment deposit geometry.
Uncoated mechanical and recycled sheets present a completely different structural environment. Mean pore diameters in uncoated newsprint and recycled corrugated liners frequently exceed 3.5 micrometers, forming irregular absorption pathways along winding inter-fiber voids. Sideways wicking along coarse softwood fibers swells the physical area of printed dots before the ink sets.
Ink viscosity drops under pressnip shear stress, accelerating fluid lateral migration into macro-capillaries before tack recovery halts fluid movement. Consequently, mechanical dot gain expands halftones far more on uncoated papers than on triple-coated fine papers.
Optical dot gain compounds physical ink spread through light scattering inside the fiber substrate. Light penetrating translucent cellulose fibers beneath a printed halftone dot travels laterally before exiting through non-printed spaces between dots. Spectrophotometers register this trapped and scattered light as extra tone value, creating the optical phenomenon known as the Yule-Nielsen effect.
Uncoated furnishes with low refractive index fillers show high internal scattering coefficients, artificially magnifying measured tone values compared to dense, opaque coated sheets where light path lengths inside the substrate stay short.
Fluctuations in relative humidity alter the equilibrium moisture content of cellulose, changing fiber swelling and internal void volume. A sheet conditioned at 35 percent relative humidity exhibits higher initial liquid intake than the same sheet conditioned at 60 percent relative humidity, altering ink film transfer efficiency and dynamic tone reproduction during a press run.

Halftone Geometry Distortion across Substrate Classifications
Surface micro-roughness dictates press nip pressure requirements and blanket contact area. Printing on coarse recycled folding boxboard demands elevated squeeze between blanket and impression cylinders to force ink into deep surface valleys. Higher mechanical impression pressure forces wet ink films out toward dot boundaries, generating pronounced squirt and slur artifacts along trailing edges.
In contrast, ultra-smooth coated sheets achieve complete ink transfer under minimal nip pressure, preserving spherical halftone geometry across midtone and shadow areas.
Surface tension gradients between ink vehicle and substrate sizing govern wetting kinetics. Internal sizing with alkyl ketene dimer or alkenyl succinic anhydride raises the liquid contact angle, retarding ink penetration and promoting lateral dot gain if drying speeds fall behind press throughput. Top-surface starch applications modulate porosity across bleached kraft pulps, balancing ink holdout against ink drying speed.
| Substrate Classification | PPS Roughness 10 MPa (μm) | Cobb 60 Water Absorption (g/m²) | ISO Brightness (%) | Nominal 50% Mechanical Gain (%) | Nominal 50% Total TVI (%) |
|---|---|---|---|---|---|
| ISO Grade 1 Premium Gloss Coated | 0.85 | 18.5 | 98.5 | 4.2 | 14.0 |
| ISO Grade 2 Standard Silk Coated | 1.30 | 22.0 | 92.0 | 5.8 | 16.5 |
| ISO Grade 4 Woodfree Uncoated White | 4.20 | 31.0 | 103.0 | 11.5 | 24.0 |
| Folding Boxboard Virgin Fibre (FBB) | 2.10 | 26.5 | 88.0 | 7.2 | 18.5 |
| Coated Recycled Board (CRB) | 3.40 | 38.0 | 81.0 | 9.8 | 22.0 |
Fibre shortening through repeated recycling loops degrades internal void structure in recycled boards. Shortened secondary fibers pack densely but create irregular, non-uniform capillary networks across the sheet profile. These structural inconsistencies cause localized tone gain variances across web width, complicating press linearisation attempts when using global plate compensation curves.
Smooth coated surfaces preserve halftone integrity across high line counts up to 200 lines per inch without risking dot bridging. Uncoated stocks demand lower screen frequencies, typically between 120 and 133 lines per inch, to prevent shadow tones from plugging into solid density patches.
Tone value increase patterns deviate significantly across substrate boundaries due to these physical mechanisms. The list below identifies specific print defects resulting from uncalibrated press runs across mismatched substrate grades.
- Midtone shadow plugging arises when excessive physical ink spread causes adjacent halftone dots to bridge prematurely at 60 percent film tint area on porous uncoated stock.
- Color cast shifts develop when primary cyan, magenta, and yellow channels exhibit asymmetric tone value curves due to differential vehicle absorption rates into un-bleached mechanical pulp.
- Mottle and graininess occur when non-uniform surface porosity across recycled board furnishes causes localized variance in optical dot gain scale across solid areas.
- Highlight detail clipping results from aggressive plate compensation curves designed for uncoated stock applied to smooth coated grades, collapsing 1 to 5 percent tone values to white.
Controlling dot expansion demands precise characterization of the paper surface prior to establishing raster image processor tone curves. Calibrating press operations without accounting for micro-porosity yields unpredictable gamut volumes and unstable color reproduction across variable paper stocks.


Curve

Mathematical Formulations for Tone Reproduction Analysis
Quantifying tone gain relies on spectral density measurements processed through established mathematical transformations. The traditional Murray-Davies formula calculates apparent dot area by comparing halftone reflectance to solid film and unprinted substrate reflectance values. Equation modeling assumes uniform ink film thickness across printed dots and zero light scattering within the paper base.
While effective for dense coated papers, Murray-Davies overestimates physical dot area on uncoated grades by conflating optical light trapping within paper fibers with actual physical ink spread.
The Yule-Nielsen correction introduces an empirical factor to compensate for internal optical scattering within translucent substrates. By adjusting the exponent in the reflectance ratio calculation, engineers isolate physical ink spreading from substrate optical effects. Setting the empirical value between 1.5 and 2.2 aligns calculated dot areas with microscopic physical measurements on uncoated offset stocks, enabling accurate ink film thickness adjustments during press setup.
Modern pressroom standards lean heavily on Spot Color Tone Value metrics defined in ISO 20654. Traditional density-based equations fail when measuring spot colors or non-CMYK inks whose spectral absorption peaks do not match standard status T or status E colorimetric filters. Spot Color Tone Value calculates tone gain based on spectral reflectance factor transitions across visible wavelengths, producing linear tone response curves across process and spot inks regardless of substrate absorbency states.
Spot Color Tone Value calculations under ISO 20654 produce a linear tone scale target within a tolerance band of Delta E 1.5 at 50 percent input tint when measured under M1 lighting conditions.
Linearisation protocols depend on selecting the correct target response curve for specific substrate classes. International standard ISO 12647-2 establishes standardized tone curves ranging from Target Curve A for gloss coated woodfree sheets to Target Curve F for uncoated newsprint stocks. Matching press target curves to substrate micro-roughness prevents tonal compression in deep shadow detail while maintaining highlight contrast.

Target Curve Derivation across Standardized Substrate Classes
Constructing compensation curves requires mapping raw press response curves against standardized target profiles. A raw press run on an uncalibrated offset press printing on uncoated kraft board yields midtone tone value increase values exceeding 28 percent at the 50 percent control patch. Applying a target curve with a nominal 22 percent target requires the raster image processor to cut output plate values in the midtones, transforming an input 50 percent file tint into a 44 percent plate dot.
Substrate white point optical values influence target curve selection. Highly brightened sheets containing optical brightening agents absorb ultraviolet radiation and re-emit light in the blue spectrum, altering spectral density calculations. Spectrophotometric measurements must isolate blue-spectrum re-emission to prevent false density readings from skewing the calculated tone value increase curve.
| Tonal Patch Value (%) | Curve A Gloss Coated (%) | Curve B Matt Coated (%) | Curve C Uncoated White (%) | Curve D Uncoated Yellowish (%) | Curve E Recycled Board (%) |
|---|---|---|---|---|---|
| 10 | 3.0 | 3.5 | 4.5 | 5.2 | 6.0 |
| 25 | 7.5 | 8.5 | 11.0 | 12.5 | 14.0 |
| 50 | 14.0 | 16.0 | 19.0 | 22.0 | 24.0 |
| 75 | 10.5 | 11.5 | 14.0 | 16.0 | 17.5 |
| 90 | 4.5 | 5.0 | 6.5 | 7.5 | 8.5 |
G7 calibration methodology relies on Near Neutral Print Density Curves rather than individual channel tone value increase targets. G7 aligns neutral gray balance by adjusting cyan, magenta, and yellow tone curves independently to match a master density scale derived from substrate highlight reflectance. Cyan target curves require higher tone values relative to magenta and yellow to achieve visual neutral balance due to natural pigment absorption characteristics.
Transitioning from traditional TVI targets to G7 neutral density curves on high-absorbency kraft substrates reduces color cast variations caused by unequal ink drainage. Liquid vehicle components in cyan ink offset vehicles absorb into raw cellulose fibers differently than magenta vehicles, shifting gray balance across midtones unless independent channel compensation curves are applied at the plate-making stage.
Higher impression force alters mechanical dot gain non-linearly across the tone scale, creating an S-shaped tone increase curve with severe distortion in the 40 to 70 percent halftone zone. Target curve adjustments must account for this non-linear compression to maintain smooth tonal gradients across continuous-tone photographic imagery.
Calibrating spot color channels alongside CMYK process channels demands unified target definitions. Spot inks formatted on specialty packaging papers frequently display extreme non-linear tone gain due to heavy pigment loading and thixotropic rheology profiles. Implementing Spot Color Tone Value linearisation smooths tint transitions, preventing severe tone steps between halftone tints and solid ink coverage areas.
Should calibration protocols enforce absolute visual linearity across high-porosity recycled board or preserve maximum tonal dynamic range by accepting elevated midtone tone gain values?


Ray

Spectrophotometric Measurement Geometry and Substrate Interaction
Optical measurement accuracy hinges on spectrophotometer illumination geometry and spectral filtration standards. Standard ISO 13655 defines four distinct measurement conditions designated M0, M1, M2, and M3 to address optical variability induced by paper substrates and ink films. Legacy M0 measurement protocols utilize un-filtered tungsten illumination matching Standard Illuminance A. M0 readings fail to quantify optical brightening agent excitation, yielding inconsistent spectral readings when evaluating modern bright white substrates under daylight-matched illumination.
Measurement mode M1 specifies illumination matching CIE Standard Illuminant D50, incorporating controlled ultraviolet content to accurately measure fluorescence from optical brightening agents. Using M1 mode ensures that tone value calculations account for blue light re-emission from brightened paper fibers, matching human visual perception under standard viewing booth conditions. Calibration target curves derived from M1 measurements provide consistent visual tone reproduction across variable substrate brightness levels.
Mode M2 eliminates ultraviolet content from the illumination source entirely using UV-cut filters. Isolating pure substrate reflectance without fluorescence interference enables technicians to assess baseline ink pigment absorbency on paper stock. M3 mode combines UV elimination with cross-polarization filters to eliminate surface specular glare, isolating true polarization reflectance from wet ink films on high-gloss coated substrates.
Surface scatter alters spectrophotometer sensor capture angles, causing directional measurement variations if instrument aperture geometry is not strictly aligned to sheet grain direction. Spherical geometry spectrophotometers diffuse light to measure total reflectance across rough paper surfaces, whereas 45/0 directional instruments measure specular reflectance angles critical for assessing offset print solids.
Optical brightening agents active in substrate coatings require M1 measurement modes to prevent blue-spectrum fluorescence from skewing spectrophotometric dot area calculations.

Fluorescence Modulation and Substrate Colorimetry Shifts
Optical brightening agents present in high-brightness packaging grades complicate spectrophotometric calibration by modifying substrate baseline tristimulus values. As UV light strikes fluorescent whitening agents embedded in paper coatings, energy re-emits in the 420 to 470 nanometer wavelength spectrum. This blue re-emission lowers measured yellow density values, causing automated calibration software to overestimate cyan tone gain relative to yellow tone gain across halftone control patches.
Substrate white point target values shift substantially when moving from virgin fiber woodfree coated papers to unbleached recycled board. A baseline white point shift of 8 Delta E units along the b-star axis alters color perception across all printed halftone tints. Calibration algorithms must recalculate tone value increase targets relative to the substrate white point, utilizing substrate-relative colorimetry rather than absolute spectral density values.
Ink vehicle absorption shifts paper surface reflection characteristics during the liquid drying phase. Wet ink films measured immediately at the press delivery register lower specular reflectance than dry ink films measured hours later, creating a dry-back tone shift. Coated boards exhibit minimal dry-back, whereas porous uncoated substrates absorb binder resin deep into paper fibers, dropping dry solid density by up to 0.25 density units and altering measured tone gain curves.
Accounting for substrate fluorescence and colorimetric shift prevents systematic errors during press profile creation, ensuring stable color reproduction across diverse packaging media.
Fluorescence variance across paper batches stems from secondary fiber origin shifts in pulp supply lines rather than failure to meet coating formulation targets.


Plate

Pressroom Linearisation and Computer-to-Plate Curve Execution
Translating theoretical tone compensation targets into physical press performance demands systematic computer-to-plate linearisation. Thermal laser imagers output halftone dots onto aluminum offset plates with nominal dimensional errors below 0.5 percent when properly calibrated. Un-calibrated plate imagers introduce physical dot size drift caused by laser focal degradation, chemical developer fatigue, or ablation thermal variance.
Establishing a un-calibrated base plate profile represents the first operational phase of pressroom calibration.
Laser power linearisation ensures plate dot sizes accurately reflect digital raster image processor file values prior to press trial runs. Exposing a test pattern containing 1 to 99 percent tint patches onto a plate allows technicians to verify laser spot integrity using plate-reading spectrophotometers. Once plate linearisation holds a 50 percent control patch within 0.5 percent of digital file values, press characterization runs can proceed safely.
Press characterization requires running dedicated calibration targets across stable press operating conditions. Standard ink film thickness, dampening solution chemistry, blanket tension, and impression cylinder squeeze must match production specifications. Running test forms containing step wedges, gray balance targets, and solid density patches across candidate paper substrates captures raw physical dot gain behavior across press channels.
Parker Print-Surf liquid penetration testing tracks substrate absorbency across incoming reel batches. Data captured from press trial forms maps the raw press tone curve against target ISO or G7 curves. The raster image processor calculates inverse transfer curves, adjusting digital plate values to counteract observed press tone gain on specific paper grades.
Applying plate compensation curves alters halftone imaging patterns at the raster level. A digital 50 percent midtone value mapped through an inverse compensation curve may output as a 38 percent plate dot. When printed on high-absorbency recycled linerboard, physical ink spread and optical gain expand that 38 percent plate dot into a 50 percent visual tone value on the finished sheet.
Iterative verification validates plate curve performance. Running a secondary test form using compensated plates confirms whether printed tone values hit target ISO 12647-2 or G7 tolerances across all color channels.
Establishing calibrated plate curves for a new substrate grade on a multi-color sheet-fed offset press requires executing the following operational steps.
- Mount freshly imaged linearised plates containing ISO 12647-2 control targets onto all press printing units.
- Condition the press ink train with target process inks and adjust dampening chemistry to target conductivity and pH levels.
- Feed test substrate sheets through the press until solid ink densities match ISO target values within Delta E 1.0.
- Run 500 impression sheets under stable press speed to achieve thermal equilibrium across ink rollers and printing blankets.
- Pull ten consecutive sample sheets from press delivery and measure spectral density values across 10 to 90 percent halftone patches using an M1-calibrated spectrophotometer.
- Average measured tone value increase data across sample sheets and export values to the raster image processor calibration module.
- Generate custom plate compensation curves mapped against target Curve C or Curve E parameters depending on substrate grade.
- Image a new set of plates incorporating the custom compensation curves and re-run press target verification forms to validate compliance.

Multi-Substrate Workflow Integration and Profile Management
Modern pressrooms handle multiple paper grades daily, requiring dynamic calibration profile management within pre-press workflows. Storing distinct plate curve sets for gloss coated, matt coated, uncoated woodfree, and recycled cartonboard options prevents press operator intervention errors during job setup. Assigning substrate-specific plate curves within automated digital job tickets ensures correct RIP curve application upon file rasterization.
Establishing separate RIP calibration channels for every paper grade family prevents the errors inherent in global tone adjustments. Global adjustments fail to address asymmetrical dot gain patterns across disparate substrate coatings, compromising color fidelity on complex packaging runs.
Temperature fluctuations in press room environments alter ink vehicle rheology, shifting dot gain midtone values by 2 to 4 percent over an eight-hour press run unless temperature-controlled ink rollers maintain constant fluid viscosity.
Setting compensation curves without factoring in blanket compressible layer rebound speeds induces register mis-alignment and tail-end slur on heavy packaging boards. Blanket physical elasticity dictates ink transfer efficiency during the micro-second pressnip contact phase.
Plate exposure accuracy dictates press linearisation success; verify plate dot area using optical plate measuring instruments before attributing print tone gain errors to substrate absorbency variance.

Batch

Goods-In Substrate Quality Control and Physical Verification
Delivered paper pallets frequently display significant physical property drift from nominal mill swatch specifications. Reel-to-reel variations in fiber refining, filler loading, and surface sizing alter sheet absorbency profiles across identical paper grades. Receiving inspection protocols must verify substrate physical parameters prior to press loading to prevent tone value increase calibration failures during production runs.
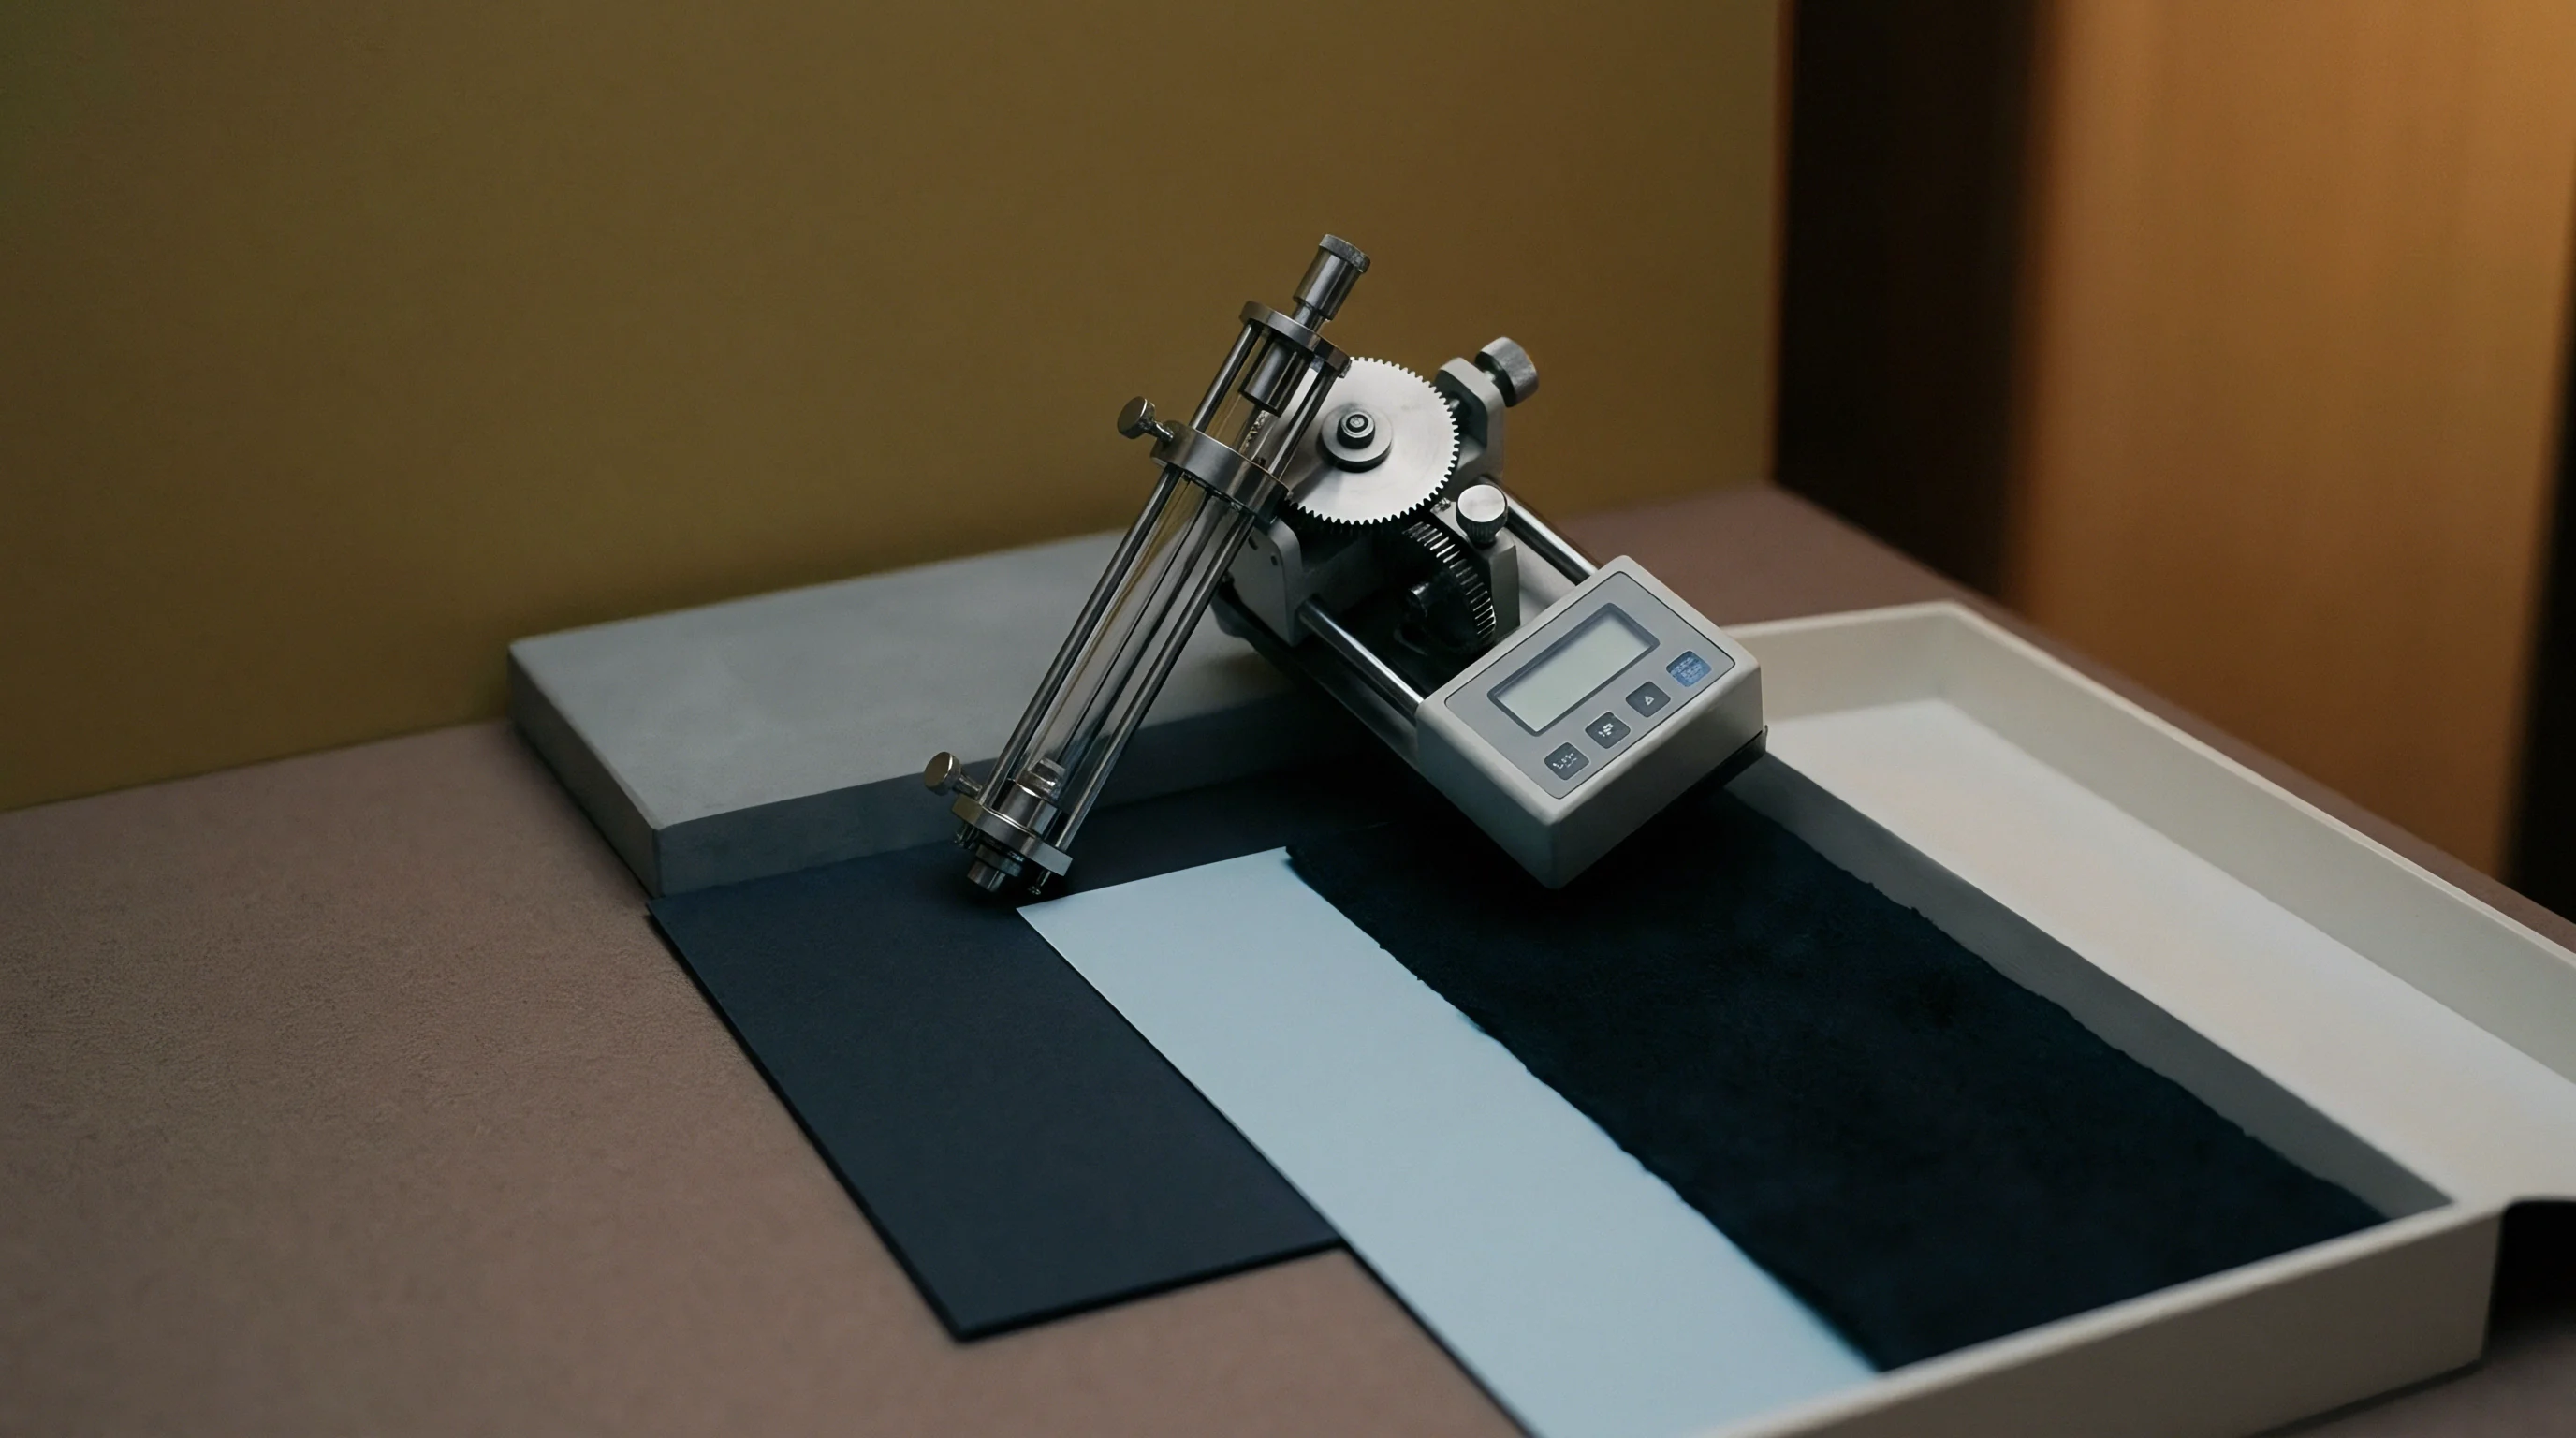
Parker Print-Surf liquid penetration and roughness testing provides rapid assessment of sheet surface state. Measuring surface roughness under 10 megapascal clamping pressure simulates pressnip conditions, quantifying micro-roughness in micrometers. A batch showing a 0.5 micrometer increase in Parker Print-Surf roughness over baseline specifications will exhibit elevated mechanical dot gain, demanding press adjustment or plate curve switching.
Cobb water absorption testing measures sheet surface sizing efficiency and liquid intake rate over defined time intervals. A Cobb 60 value drifting from 22 grams per square meter up to 32 grams per square meter indicates reduced surface sizing, allowing ink vehicle resins to penetrate paper fibers rapidly. Uncontrolled vehicle absorption degrades print gloss and increases optical dot gain across halftone tint areas.
Basis weight and caliper uniformity directly affect impression cylinder squeeze force. Basis weight drift exceeding plus or minus 3 percent across a web reel alters press nip mechanical pressure, causing localized dot gain fluctuations across printed sheets. Technicians must log basis weight, caliper, brightness, and surface roughness parameters upon substrate delivery.
Purchase order contracts must specify substrate Parker Print-Surf roughness tolerances within plus or minus 0.3 micrometers of baseline mill standards to ensure press tone gain stability.

What Happens When Sheet Roughness Drift Exceeds Target?
When incoming substrate roughness drifts beyond established operating windows, press operators face immediate quality trade-offs. If a rough uncoated batch enters production under plate curves calibrated for smooth uncoated stock, midtone tone values expand rapidly, causing color casts and detail loss in shadow halftone areas. Increasing dampening water delivery to control ink spread emulsifies wet ink films, causing ink piling on blankets and compounding dot gain instability.
Compensating for sheet surface variance on press requires reducing ink film thickness or modifying impression cylinder squeeze settings. Dropping solid ink density below target ISO specifications restores midtone tone values but reduces overall color gamut volume, rendering rich, saturated colors unachievable. Alternative operational remedies include switching raster image processor curve sets to a higher-gain target profile, such as moving from ISO Curve C to ISO Curve E.
An unannounced furnish change that shifted midtone dot gain by eight percent on a six-color press line illustrates how higher recycled fiber content increases sheet absorbency, rendering existing plate calibration curves obsolete until press characterization is repeated.
Verifying incoming material properties prevents costly press downtime and waste generation. The checklist below outlines essential substrate parameters that must be evaluated at goods-in inspection before clearing paper stock for calibrated production press runs.
- Parker Print-Surf surface roughness measured under 10 MPa pressure to confirm micro-topography alignment with target plate curve profiles.
- Cobb 60 water absorptiveness evaluated on top and wire sides to verify internal and surface sizing performance under liquid ink contact.
- ISO sheet brightness and colorimetry measured with ultraviolet inclusion to track optical brightening agent concentration variances across mill lots.
- Substrate cross-direction caliper profile checked across web width to prevent localized impression pressure variations on offset press cylinders.
- Equilibrium sheet moisture content verified using capacitive moisture probes to avoid dimensional stability loss and absorbency spikes during printing.
Integrating incoming substrate quality metrics into automated workflow systems allows pre-press software to recommend optimal plate curve selections based on actual batch test data rather than theoretical substrate classifications.
Processing un-inspected recycled board reels that exceed specified absorbency limits by thirty percent causes widespread folding carton inventory rejection.


Yield

Total Area Coverage Mechanics and Ink Consumption Economics
Tone value increase calibration directly impacts total ink consumption, total area coverage limits, and unit substrate yield arithmetic. Over-inking a press run to compensate for poor midtone contrast on high-absorbency stock increases total ink film thickness, driving up raw ink costs while risking print defect generation. Enforcing strict total area coverage caps within raster image processor color separation profiles limits maximum combined CMYK ink coverage to safe limits, typically 300 percent for coated stocks and 260 percent for uncoated packaging boards.
Un-calibrated press runs printing on high-gain recycled substrates frequently exceed total area coverage limits due to uncompensated dot gain expansion in shadow tones. Printed halftone dots expanding beyond digital file parameters push an intended 280 percent total area coverage area up to 320 percent actual wet ink coverage on sheet surfaces. Exceeding physical coverage limits causes ink set-off onto adjacent sheets in the press delivery stack, forcing press operators to run anti-offset spray powder at elevated application rates.
High anti-offset powder application creates surface contamination during downstream converting processes, impairing foil stamping adhesion and lamination film bond strength on packaging cartons.
Ink coverage reduction software utilizes Under Color Removal and Gray Component Replacement algorithms to substitute neutral CMYK combinations with pure black ink. Combining Gray Component Replacement with accurate tone value increase plate curves lowers total wet ink film volume by up to 20 percent without compromising visual dynamic range or color saturation on lower-grade substrates.
| Operating Parameter | Uncalibrated Uncoated Board | TVI Calibrated Uncoated Board | TVI Calibrated + GCR Uncoated Board |
|---|---|---|---|
| Midtone 50% Measured TVI (%) | 28.5 | 19.0 | 19.0 |
| Effective Total Area Coverage (%) | 315 | 260 | 235 |
| Process Ink Volume Consumed (kg) | 42.5 | 35.2 | 29.8 |
| Make-Ready Spoilage Sheets | 2,400 | 800 | 650 |
| Anti-Offset Powder Rate (g/m²) | 1.85 | 0.95 | 0.70 |
| Total Production Cost per 1k Sheets ($) | 148.50 | 132.10 | 124.80 |
Auditing pressroom spectrophotometric data against mill inspection certificates maintains baseline consistency. Implementing calibrated plate curves and ink optimization software generates measurable cost savings across long-run packaging orders. Lower ink volume requirements reduce drying times, accelerating press throughput and enabling faster turnarounds to downstream converting equipment.
Controlling dot growth reduces make-ready spoilage during press setup, cutting the sheet count required to achieve color match on target standards.

Commercial Specifications and Contractual Acceptance Limits
Defining clear tone value increase tolerances within substrate purchase orders and print execution contracts protects buyers and converters from financial disputes. Technical packaging agreements must specify acceptable tone value increase bands across key control steps, enforcing limits derived from ISO 12647-2 or ISO 12647-7 standards. Standard specifications require midtone tone value increase values to hold within plus or minus 4 percent of target curves across all process color channels.
Color variation tolerance specifications must incorporate substrate white point drift parameters using Delta E 2000 metrics. Contracts specifying strict color matching on variable recycled substrates must state whether tolerances apply to absolute colorimetry or substrate-relative colorimetry. Applying substrate-relative tolerances accounts for natural paper color shifts, evaluating press performance purely on ink transfer and tone calibration accuracy.
Standard supply agreements must specify that delivered paper lots exhibiting Parker Print-Surf roughness drift exceeding plus or minus 0.4 micrometers from nominal specification trigger mill credit adjustments or lot rejection rights.
Producer responsibility schemes and end-of-life recycling regulations increasingly influence substrate selection for retail packaging applications. Uncoated unbleached kraft substrates offer superior recyclability profiles compared to plastic-laminated boards, but introduce significant tone value increase calibration challenges during printing. Establishing robust standardized calibration protocols across high-gain unbleached substrates allows brand owners to meet sustainability mandates without sacrificing visual print quality or shelf presentation appeal.
Master technical purchase specifications must mandate that all print runs executed on non-standard substrate grades conform to ISO 20654 Spot Color Tone Value linearisation targets within a maximum midtone variance of plus or minus 3 percent across all production lots.