Chemometric Model Calibration Transfer Protocols across Variable Pulp Refining Nodes
Piece-wise direct standardization transfers chemometric pulp refining calibrations across optical nodes without regenerating full sets of offline laboratory data.


Furnace

Online Spectrometry across Pulp Bleaching Lines
Spectroscopic probes installed in the blow line or refiner blow valve track physical furnish metrics through vibrational bands. Calibration models built on partial least squares regression link near-infrared absorption across 4000 to 12000 cm-1 to Schopper-Riegler freeness, Canadian Standard Freeness, and water retention value. A primary chemometric model developed on a master refiner line loses operational predictive power when moved to a secondary mechanical or chemical pulp line.
Variations in optical pathlength, lamp aging, detector temperature drift, and mechanical plate geometry shift spectral baselines. The mechanical shear across low-consistency refining discs alters fiber length distribution differently than high-consistency refiners running identical specific refining energy inputs. An uncorrected multivariate model misreads this altered surface area as a chemical change in lignin content or external fibrillation state.
The operational cost of maintaining separate empirical models for every refiner position escalates rapidly. Production plants install multiple refining stages running parallel conical or double-disc refiners. Rebuilding calibration matrices from zero on every refiner line demands hundreds of offline wet-chemistry and freeness tests per position.
ISO 5267-1 Schopper-Riegler tests take fifteen minutes per sample under manual bench conditions. Standard Canadian Standard Freeness measurements via ISO 5267-2 demand rigorous temperature and consistency correction factors. Calibration transfer mathematics bypass the need to regenerate whole sets of offline primary samples on secondary nodes.
Optical variations between spectrometer installations create systematic spectral shifts larger than the spectral variance driven by mechanical refining energy.
The initial mathematical transfer links the master instrument space to the slave instrument space. Standardisation transfers spectral responses from secondary online sensors to match the response profile of the primary spectrometer. Two baseline mathematical pathways dominate industrial pulp lines: direct model updating through bias and slope correction, and instrumental standardization through piece-wise direct standardization or orthogonal signal correction.
Both pathways stabilize the root mean square error of prediction across secondary lines without generating extensive primary calibration curves. The buyer evaluates mill test reports based on whether the analytical instrument standard matches the primary calibration bench.
Direct standardization maps full-spectrum responses across instruments using matched transfer standards. Piece-wise direct standardization restricts the transfer calculation to localized moving spectral windows, reducing noise amplification from distant wavelengths. Mill operators run sealed reference standards through optical flow cells to calculate spectral transformation matrices before web furnish enters the refiner housing.
A supplier often claims that software factory baselines eliminate instrument drift without physical standardization sets.


Shearing

Physical Fiber Variations between Refiner Sets
Mechanical stock processing alters the physical morphology of lignocellulosic fibers. Disc refiners operate across variable consistency regimes, ranging from 3 to 5 percent in low-consistency lines up to 30 percent in high-consistency units. High-consistency mechanical refining induces fiber curl, microcompressions, and internal delamination without severe cutting.
Low-consistency refining cuts fibers, creating fines that scatter light intensely in the near-infrared spectrum. Near-infrared radiation reflects off external fiber surfaces according to diffuse reflectance regimes governed by Kubelka-Munk scattering coefficients. An increased fines content raises scattering coefficients across all wavelengths, shifting spectral baselines upward.
The standard specific edge load, measured in Joules per meter, quantifies the mechanical intensity of bar impacts. Refiners operating at identical net specific energy inputs produce divergent freeness levels if bar edge length and rotation speed diverge. Conical refiners impart lower shear intensity than high-diameter flat disc refiners.
A chemometric calibration model mapping absorption peaks at 7000 cm-1 to fiber swelling encounters altered optical baseline offsets when shifted from a conical refiner to a flat disc system. The primary model mistakes physical light scattering caused by fines for moisture-mediated hydrogen bonding.
| Refiner Geometry | Consistency Range (%) | Specific Edge Load (J/m) | Mean Fiber Length (mm) | Fines Fraction (%) | Baseline Offset (ΔA at 9000 cm-1) |
|---|---|---|---|---|---|
| Double Disc LC | 3.5 to 4.5 | 1.2 to 2.8 | 1.45 to 1.85 | 22.5 to 34.0 | 0.142 to 0.285 |
| Conical LC | 4.0 to 5.5 | 0.8 to 1.6 | 1.80 to 2.25 | 14.0 to 21.0 | 0.085 to 0.160 |
| Twin Disc HC | 28.0 to 35.0 | N/A | 2.10 to 2.60 | 8.5 to 13.5 | 0.035 to 0.075 |
| Single Disc Reject | 4.0 to 6.0 | 2.5 to 4.2 | 1.10 to 1.55 | 31.0 to 44.0 | 0.210 to 0.410 |
Fines generation directly drives pulp drainage on the paper machine forming fabric. When calibration transfer fails across refining nodes, refiner control loops miscalculate stock drainage behavior. Mills adjust refining power based on false chemometric readings, producing reels with uneven cross-direction drainage and caliper bands.
Converting facilities running high-speed folding boxboard lines experience blister formation, edge cracking, and reduced box compression test values. Papermakers monitor fiber length distribution via automated optical analyzers adhering to ISO 16065-2 alongside chemometric predictions to track the physical reality of stock shear.
Refining changes the hydroxyl group availability on cellulose microfibrils. Fibrillation exposes secondary cell wall layers, expanding the active surface area for inter-fiber hydrogen bonding. Water molecules bind to these newly exposed hydroxyl groups in non-freezing and freezing bound states.
Near-infrared spectroscopy detects these states through shifts in the second overtone of the O-H stretching band near 6900 cm-1. Transfer models adjust for the discrepancy between physical light scatter changes and true chemical hydration shifts across varied mechanical geometries.
Uncorrected transfer models produce off-spec stock that forces continuous steam adjustments across machine drying cylinders, raising manufacturing costs per reel.


Algorithms

Standardization Mathematics for Process Transfer
Transferring a multivariate regression model requires explicit transformation matrices. Master instrument responses and slave instrument responses relate through systematic mathematical transforms. Assume a set of standardized reference samples measured on both master spectrometer Xm and slave spectrometer Xs. The matrix relationship follows:
Xs = Xm F + E
Here, F represents the transfer matrix and E captures random instrument noise. In Piece-Wise Direct Standardization, the transfer matrix F is banded rather than full-rank. Each wavelength on the slave instrument is reconstructed using a narrow window of neighboring wavelengths from the master spectrometer.
The window width depends on the spectral resolution and slit width variations between the two optical devices. A moving window of 5 to 11 wavelength channels preserves localized absorption profiles without transferring baseline high-frequency noise.
An alternative mathematical pathway avoids optical standardization by modifying the regression vector directly through orthogonal signal correction. Orthogonal signal correction removes spectral variance orthogonal to the reference property matrix Y, which contains measured freeness, water retention value, or tensile index data. When transferring models across refining nodes, orthogonal signal correction filters out baseline shifts caused by fines scattering.
The algorithm strips spectral variations unrelated to actual pulp strength development.
Standardizing five matched optical standards across five wavelengths establishes the baseline transfer matrix for multi-refiner pulp lines.
Transfer protocol execution follows a structured linear sequence across production stations:
- Sample selection across the operational refining freeness range identifies five to ten stable transfer pulp standards.
- Master acquisition records reference spectra on the calibrated primary spectrometer at stable slurry temperatures.
- Slave measurement captures spectra of identical standards on the secondary refiner probe under matched flow rates.
- Matrix calculation derives the piece-wise direct standardization transformation operator via localized linear regressions.
- Validation verification checks the standard error of prediction using offline reference samples from the secondary line.
Shenk’s algorithm provides an empirical slope and bias correction when optical hardware remains identical across nodes. The slave spectrometer calculates predicted property values directly using the master regression vector. Secondary linear regression adjusts predicted values against offline laboratory tests:
Ycorrected = a + b Ypredicted
Slope coefficient b handles optical pathlength discrepancies, while intercept a compensates for uncalibrated baseline offsets. Shenk’s algorithm works adequately when refiner plate alloys and sensor geometries match precisely. Disc plate wear alters flow turbulence and bubble entrapment around the probe sapphire window.
These physical shifts degrade simple slope and bias adjustments over months of production runs.
Failure to update transfer matrices following disc replacement invalidates all automated refining energy adjustments.

Timber

Can Species Blends Disrupt Chemometric Calibration Lines?
Furnish shifts between softwood and hardwood species destabilize chemometric transfer models. Northern bleached softwood kraft contains long tracheid fibers providing high tear strength and tensile potential. Bleached hardwood kraft, derived from eucalyptus or birch, introduces short fibers and high vessel element counts.
Chemical pulp lines process variable furnish blends to control sheet bulk and surface smoothness. Softwood and hardwood fibers display distinct infrared absorption baselines due to divergent hemicellulose compositions. Hardwood xylan contains glucuronoxylan chains, whereas softwood hemicellulose features high galactoglucomannan fractions.
The O-H and C-H stretching overtones shift measurably between these two carbohydrate structures.
When an online chemometric model calibrated on pure softwood lines transfers to a swing refining node handling mixed furnish, calibration error widens. The ratio of fiber length to fiber cell wall thickness governs how fibers collapse under refiner bar impacts. Thin-walled springwood fibers collapse into flat ribbons, increasing contact area and boosting sheet opacity.
Thick-walled summerwood fibers resist collapse, retaining tubular profiles that scatter light without bonding tightly. The chemometric transfer protocol incorporates species-dependent classification steps before executing the freeness prediction regression.
- Hardwood fiber fractions elevate initial drainage rates while lowering sheet tear indices under identical specific energy consumption inputs.
- Vessel element contamination generates local optical void spaces on spectrometer windows, disrupting near-infrared beam reflectance integrity.
- Lignin residue levels alter baseline absorption in unbleached kraft pulp grades, shifting baseline offsets across 4500 to 5200 cm-1 regions.
- Hemicellulose retention variations change bound water affinity, causing errors in chemometric water retention value predictions.
Process control systems deploy discriminant analysis algorithms prior to regression calculations. The spectrometer identifies the incoming furnish blend ratio based on spectral fingerprint regions between 4000 and 5000 cm-1. Once classified, the control system selects the appropriate transfer transformation matrix for that specific furnish ratio.
A model calibrated solely on pine stock misinterprets eucalyptus fines as unrefined raw fibers, starving the refiner of electrical load.
The resulting sheet enters the paper machine wet end with erratic dewatering kinetics. The headbox consistency drifts, basis weight profiles fluctuate across the wire, and sheet dryness leaving the press section drops below normal operating thresholds. A board converter running this stock experiences delamination during high-speed scoring operations on flatbed die-cutters.
Mill technical personnel manage species transitions by enforcing periodic offline fiber morphology audits under ISO 16065-1 procedures.


Probe
Optical Flow Cell Geometries and Maintenance Controls
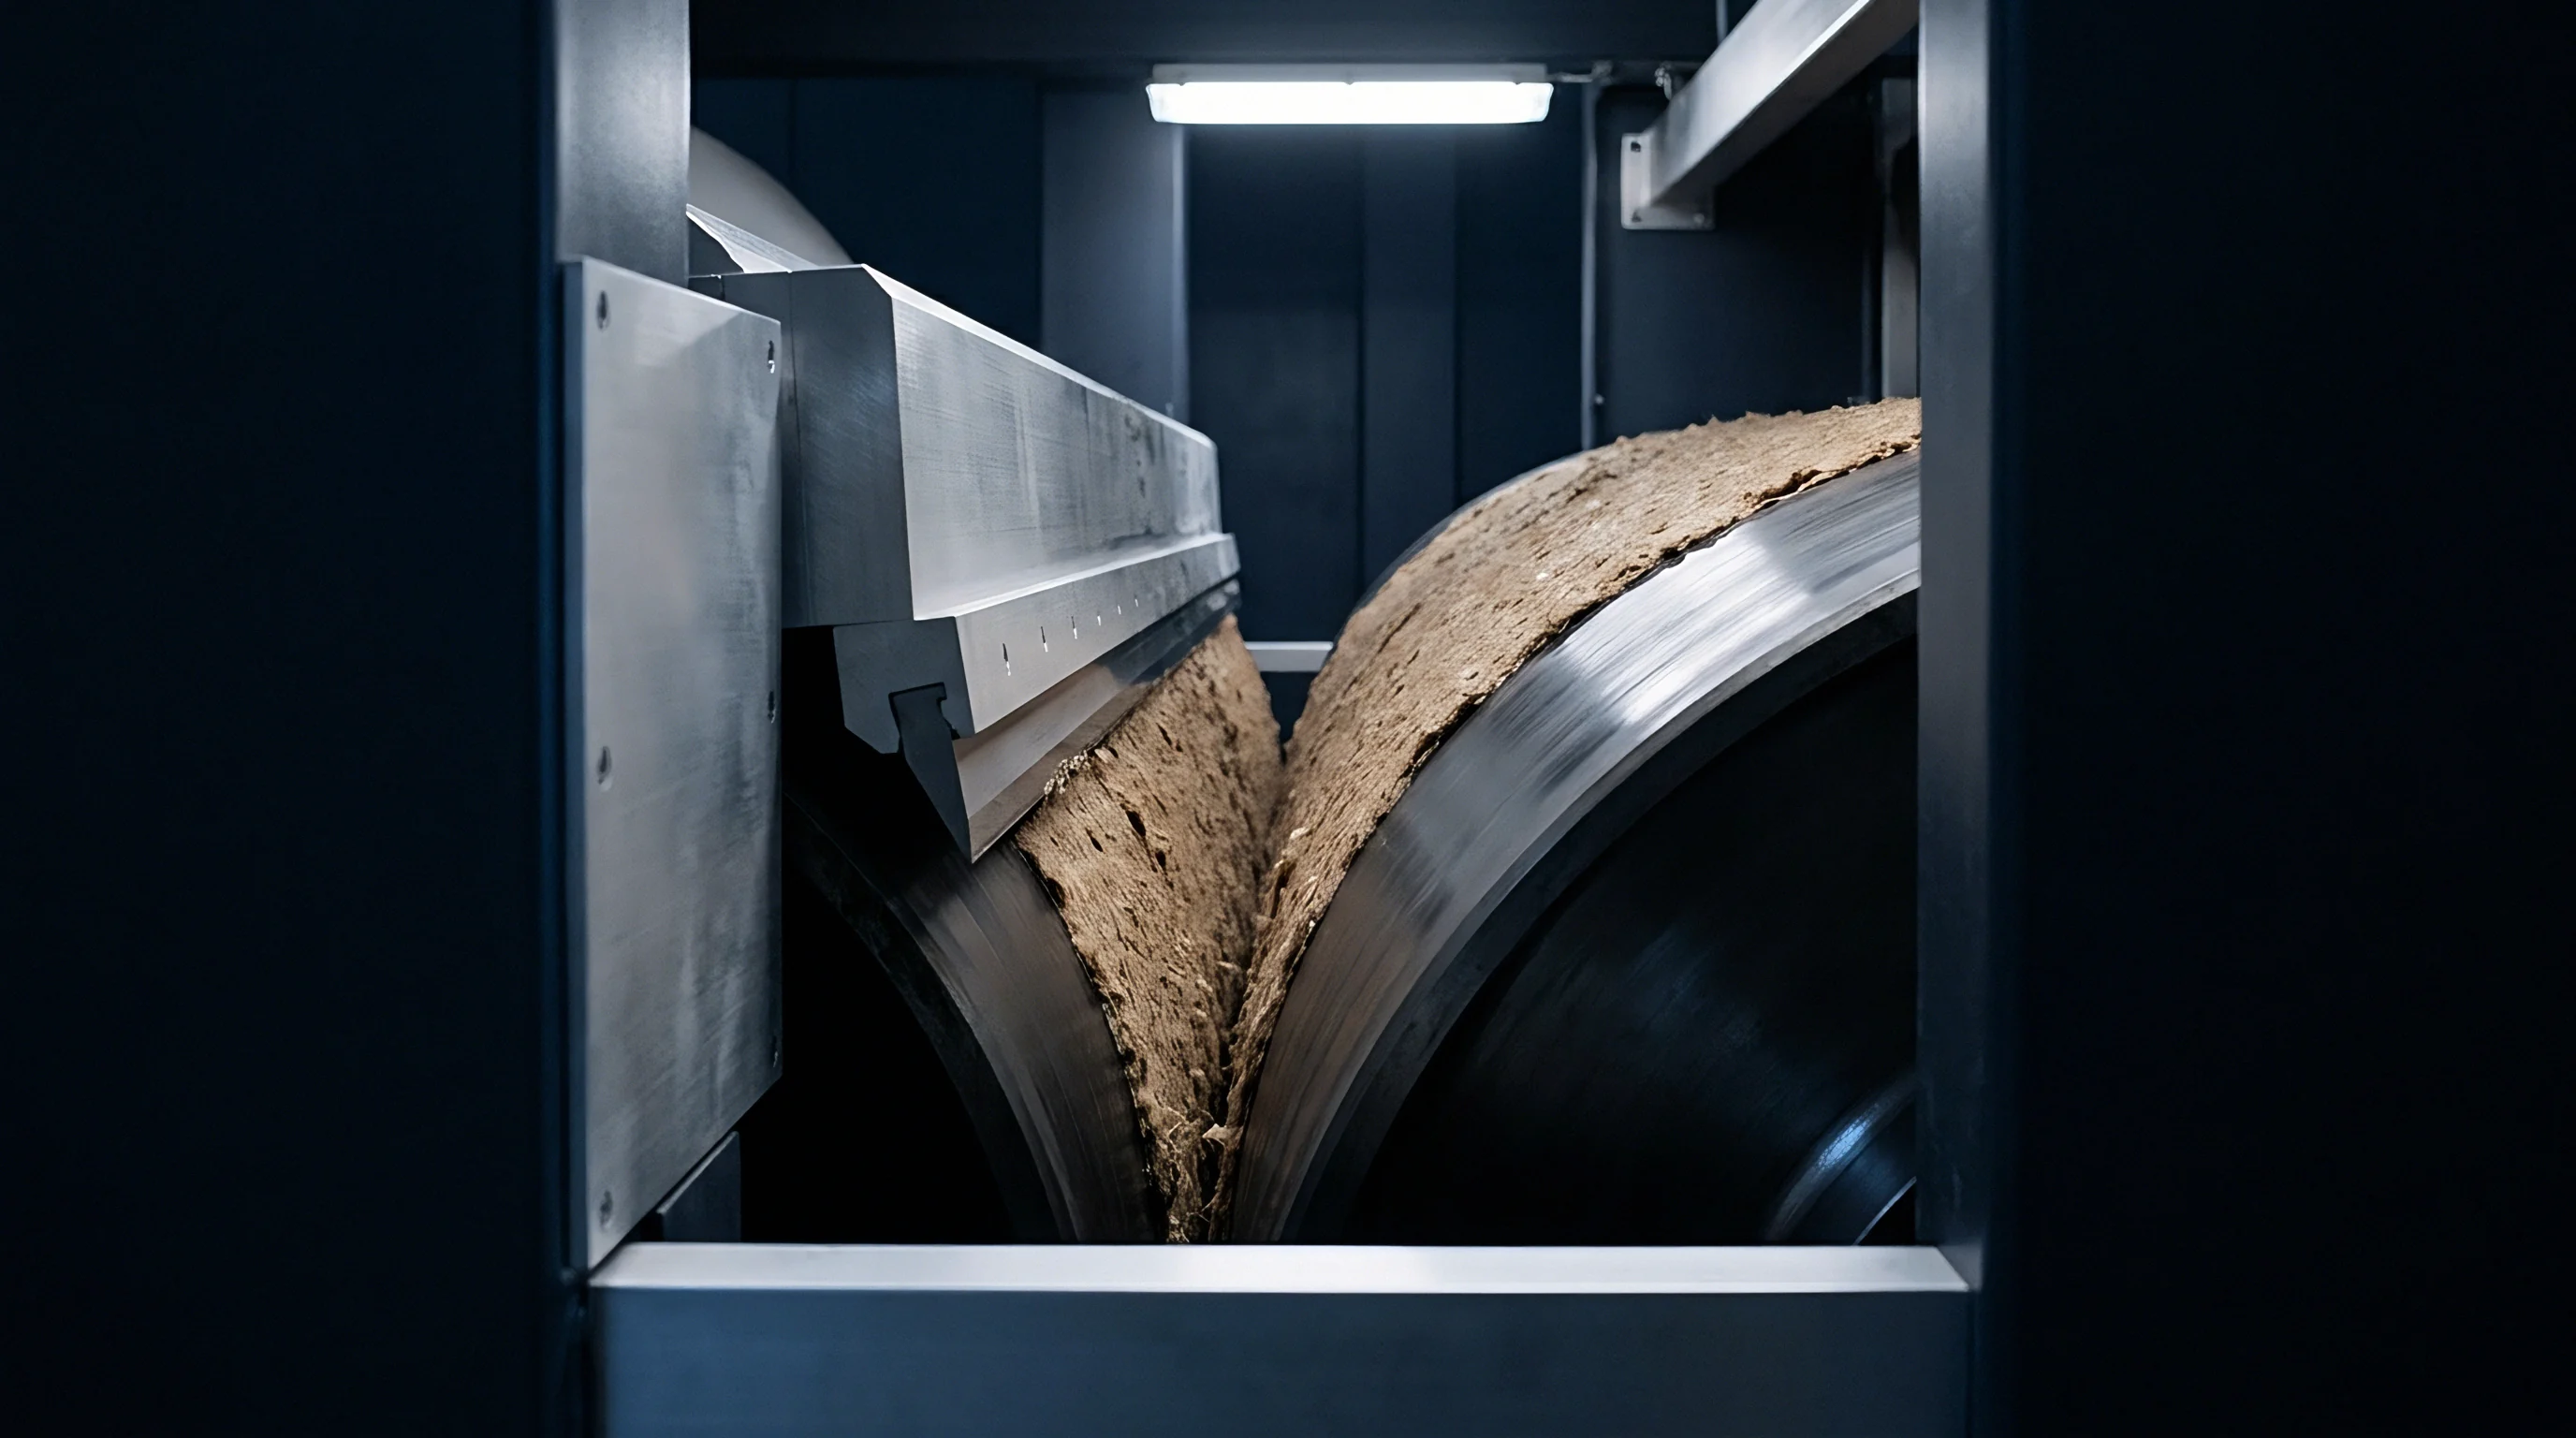
Industrial spectrometers monitor pulp properties via reflection probes or transmission flow cells inserted into pressurized stock lines. High stock consistency creates immense shear stress along the probe tip. Pulp fibers accumulate on sapphire windows, forming static boundary layers that blind the spectrometer to flowing stock variations.
Refiner lines operate at stock pressures between 200 and 600 kPa, generating micro-cavitation bubbles against optical faces. Cavitation scatters near-infrared radiation, creating high-frequency optical noise that distorts the second overtone water absorption band.
Self-cleaning flow cell assemblies mitigate fiber fouling. Dual-window transmission probes maintain high fluid velocity across the optical gap to scour fiber accumulation. The optical pathlength between sapphire windows remains fixed between 1.0 and 5.0 millimeters depending on stock consistency.
A 2.0 millimeter pathlength accommodates 3.5 percent consistency pulp slurries without inducing channel blockage. Reflection probes angled at 45 degrees to the flow direction leverage pulp turbulence to strip stationary fiber mats from the window surface.
| Probe Style | Consistency Band (%) | Pathlength / Gap (mm) | Window Material | Operating Pressure (kPa) | Drift Velocity (ΔA/1000 hrs) |
|---|---|---|---|---|---|
| Inline Reflection 45° | 2.5 to 6.0 | N/A (Reflectance) | Sapphire Crystal | 250 to 600 | 0.015 to 0.035 |
| Dual-Window Flow-Through | 0.8 to 2.5 | 2.0 to 4.0 | Fused Silica | 150 to 400 | 0.008 to 0.020 |
| Retractable Immersion | 3.0 to 8.0 | N/A (ATR Element) | Polycrystalline Diamond | 200 to 500 | 0.004 to 0.012 |
| Extractive Bypass Cell | 0.5 to 1.5 | 5.0 to 10.0 | Sapphire Crystal | 100 to 250 | 0.012 to 0.028 |
Hardware aging introduces non-linear spectral distortion across separate refiner installations. Tungsten-halogen light sources lose emission intensity in short wavelengths below 1100 nm as filament resistance climbs. InGaAs detector arrays develop thermal drift if thermoelectric coolers degrade under hot machine room ambient conditions.
Standard transfer protocols dictate checking dark current and white reference spectra every twelve operating hours. Automated internal referencing maintains baseline positions without shutting down refining lines.
A two-millimeter pathlength maintains continuous fluid shear across optical windows while preventing fiber flocs from plugging the measurement gap.
Refiner plate wear introduces metallic particles into pulp stock over plate lifetimes. Cast white iron and stainless-steel alloys release microscopic metallic fines into the slurry during high-intensity bar clashes. Metallic contaminants alter baseline reflectance properties, reducing overall light return to the spectrometer collection optics.
A chemometric model uncorrected for optical attenuation mistakes metallic darkening for an increase in unbleached kraft lignin concentration. Calibration transfer procedures apply baseline subtraction algorithms to isolate molecular vibrational overtone peaks from broadband absorption declines.
Standard supply contracts stipulate optical window replacement cycles alongside refiner plate maintenance schedules.


Ledger

Yield Economics and Stock Valuation Mechanics
Precise chemometric refining control dictates paper mill profitability and downstream box plant yield. Mills purchase market pulp based on air-dry metric tonnes at 90 percent dry solids content. Refining energy directly impacts fiber yield per batch.
Over-refining stock hydrolyzes short cellulose chains into dissolved organic matter, elevating effluent chemical oxygen demand and degrading pulp yield by 0.5 to 1.5 percent. On a 250,000-tonne annual linerboard machine, a 1.0 percent fiber loss across refining lines discards 2,500 tonnes of raw furnish into water treatment plants.
Assume an unbleached softwood kraft pulp price of 820 dollars per air-dry metric tonne delivered to the mill gate. A 1.0 percent furnish degradation directly wastes 2,050,000 dollars annually in lost fiber substance. Accurate calibration transfer across all parallel refiners eliminates uneven refining energy distribution.
Balanced refining ensures every metric tonne yields maximum sheet area without dropping tensile strength below contract limits. The financial return of implementing Piece-Wise Direct Standardization protocols balances against off-spec reel rejections and slabbing waste at the winder.
Downstream box converters purchase containerboard based on basis weight, specified in grams per square meter, but sell finished packaging by surface area. Fluting and linerboard with uneven freeness profiles exhibit inconsistent thickness and mechanical stiffness across the reel. Caliper variations force corrugator operators to increase double-backer roll nip pressures to achieve bonding.
Crushed flutes reduce edge crush test performance, requiring higher basis weight papers to meet box compression specifications.
A packaging plant downgauging virgin kraftliner from 175 gsm to 150 gsm relies on consistent fiber refining to preserve BCT performance. If the paper mill refiner node runs on an uncalibrated slave spectrometer, freeness drifts by plus or minus 40 Canadian Standard Freeness units. The sheet fails minimal burst strength requirements, triggering customer claims and pallet returns.
The economic penalty surfaces as ruined converting inventory and wasted freight charges on rejected corrugated cases.
A procurement specification guarantees calibration maintenance routines by enforcing root mean square error thresholds on all supplier quality documents.