Discrepancy Quantification Models for Mass Balance Claims under Thermal Marker Pyrolytic Degradation
Thermal marker degradation models adjust pyrolysis mass balance claims by integrating Arrhenius cracking kinetics and phase partitioning into audit ledgers.


Kinetics
Feedstock tracing in chemical recycling relies on chemical markers surviving elevated process temperatures. When post-consumer polyolefins, multi-layer barrier paperboard laminates, or recovered packaging films enter a continuous pyrolytic reactor, operators introduce tracer molecules to validate physical mass balance allocation under chain of custody standards such as ISO 22095 and ISCC PLUS. Process heat initiates radical chain scission, cracking both the hydrocarbon backbone and the added tracer compounds.
A failure to quantify the thermal cracking rate of the marker produces an unverified attribution gap between ledger credits and actual recycled content delivered to converters.
Pyrolytic decomposition of chemical tracers follows Arrhenius thermal decay mechanics. As temperatures sweep past 450 degrees Celsius, primary thermal markers such as synthetic branched alkyl-aromatics, deuterated polyolefins, or halogenated taggants crack into low-molecular-weight volatile fractions and carbonaceous char. The apparent disappearance of marker concentration inside the condensed liquid py oil fraction stems from two distinct mechanisms: thermal cracking into non-condensable light gases and phase partitioning into solid char.
Physical markers verify attributed flows. Laboratory quantification of the net decomposition rate constant (k_d) requires isothermal bench furnace runs under controlled nitrogen purges with gas chromatography-mass spectrometry (GC-MS) detection limits set below 0.05 milligrams per kilogram. The first-order degradation kinetics follow the relationship dc/dt = -k_d c, where the rate constant k_d depends strictly on absolute temperature (T), the apparent activation energy (E_a), and the pre-exponential frequency factor (A).
If the activation energy of the tracer compound sits below the activation energy of the surrounding polyolefin matrix, the marker decomposes faster than the parent polymer cracks into condensable liquid hydrocarbons.
Mass balances cannot ignore cracked markers. Mathematical discrepancy quantification establishes an empirical calibration model linking temperature, space velocity, and observed tracer loss. When an uncorrected mass balance allocation assumes one-to-one marker persistence, the accounting ledger overstates physical feedstock conversion efficiency.
Sourcing agents reviewing mass balance credit allocations on virgin-equivalent kraft linerboard coated with chemically recycled polyolefin layers inspect the kinetics validation report before accepting recycled content claims.

Retort
Continuous thermal reactors present non-ideal residence time distributions that complicate degradation calculations. Rotary kilns, bubbling fluidized beds, and auger reactors expose polymer feedstocks to severe temperature gradients along their longitudinal axes. Feedstock particles spending 25 minutes inside a rotary kiln at 550 degrees Celsius experience thermal cracking severity far exceeding particles bypassing the reaction zone in an 8-minute short-circuit path.
Residence times shift cracking severity. Discrepancy models must integrate residence time distribution functions E(t) with the differential reaction rate of the thermal marker to calculate the mean exit concentration. The real marker recovery yield (Y_m) across the reactor represents the integral of tracer survival probability across the operational duration distribution: Y_m = integral from 0 to infinity of c(t)/c_0 multiplied by E(t) dt.
Without pulse tracer residence testing using inert radioisotopes or non-reactive refractory minerals, nominal reactor holding times introduce systematic measurement errors exceeding 22 percent.
A reactor holding time variance of four minutes across a 500-degree pyrolysis bed alters tracer recovery by eighteen percent under identical heating loads.
Secondary cracking within the reactor headspace destroys aromatic markers rapidly. Vaporized marker fragments remain in high-temperature vapor zones where radical termination and secondary cracking strip distinguishing functional groups before condensable hydrocarbons hit quench scrubbers. In continuous pyrolysis systems, secondary vapor residence times between 1.5 and 4.2 seconds at 650 degrees Celsius reduce mono-aromatic marker detection sensitivity by up to 43 percent.
The table below compiles measured thermal decay properties across dominant marker classes utilized in circular packaging feedstocks.
| Marker Chemistry | Activation Energy (kJ/mol) | Py-Oil Partition (%) | Off-Gas Partition (%) | Char Retained (%) | Analytical Limit (mg/kg) |
|---|---|---|---|---|---|
| Perdeuterated Polyethylene | 242.5 | 68.2 | 29.4 | 2.4 | 0.10 |
| 1,4-Bis(octyl)naphthalene | 188.4 | 42.1 | 53.6 | 4.3 | 0.02 |
| Yttrium Tris(acetylacetonate) | 315.0 | 0.8 | 1.2 | 98.0 | 0.005 |
| Perfluorinated Alkane Oligomer | 210.8 | 58.9 | 39.7 | 1.4 | 0.05 |
| Octadecylanthracene | 194.2 | 46.7 | 49.1 | 4.2 | 0.01 |
| Data measured under continuous nitrogen atmosphere at 101.3 kPa with nominal solids residence time of 18 minutes. | |||||
Feedstock composition introduces catalytic cracking shifts inside the reactor bed. Mineral fillers such as calcium carbonate, titanium dioxide, and residual kaolin clay from paper barrier laminates act as active acid catalysts. These inorganic surfaces accelerate secondary dealkylation of organic tracers, skewing thermal kinetic constants calibrated on pure virgin polymer blanks.
Sourcing personnel who accept laboratory kinetics conducted without the commercial packaging filler burden risk total failure during third-party mass balance reconciliation audits, forfeiting product claim integrity at the regional border.


Decay
Attribution ledgers break down when tracer decay remains uncompensated in daily operations. Sourcing controllers tracking recycled polyolefin mass balance credits through chemical steam crackers allocate output credits based on incoming certified post-consumer volumes. When analytical testing reveals a 35 percent marker deficit in condensed pyrolysis oil, converters face conflicting accounting paths: write down 35 percent of their earned circular packaging claims or apply a validated mathematical correction factor to explain the missing tracer fraction.
Char captures heavy metal complexes. Organometallic markers, while thermally stable at cracking temperatures, partition almost entirely into solid residues. Rare-earth complexes leave less than 1 percent of their introduced mass inside the target oil phase, concentrating instead within the pyrolytic char and carbon black byproduct.
An auditor examining liquid oil shipments finds no detectable marker, disqualifying the lot unless the mass balance dossier includes explicit cross-phase partition coefficients established by standard mass spectrometry protocols.
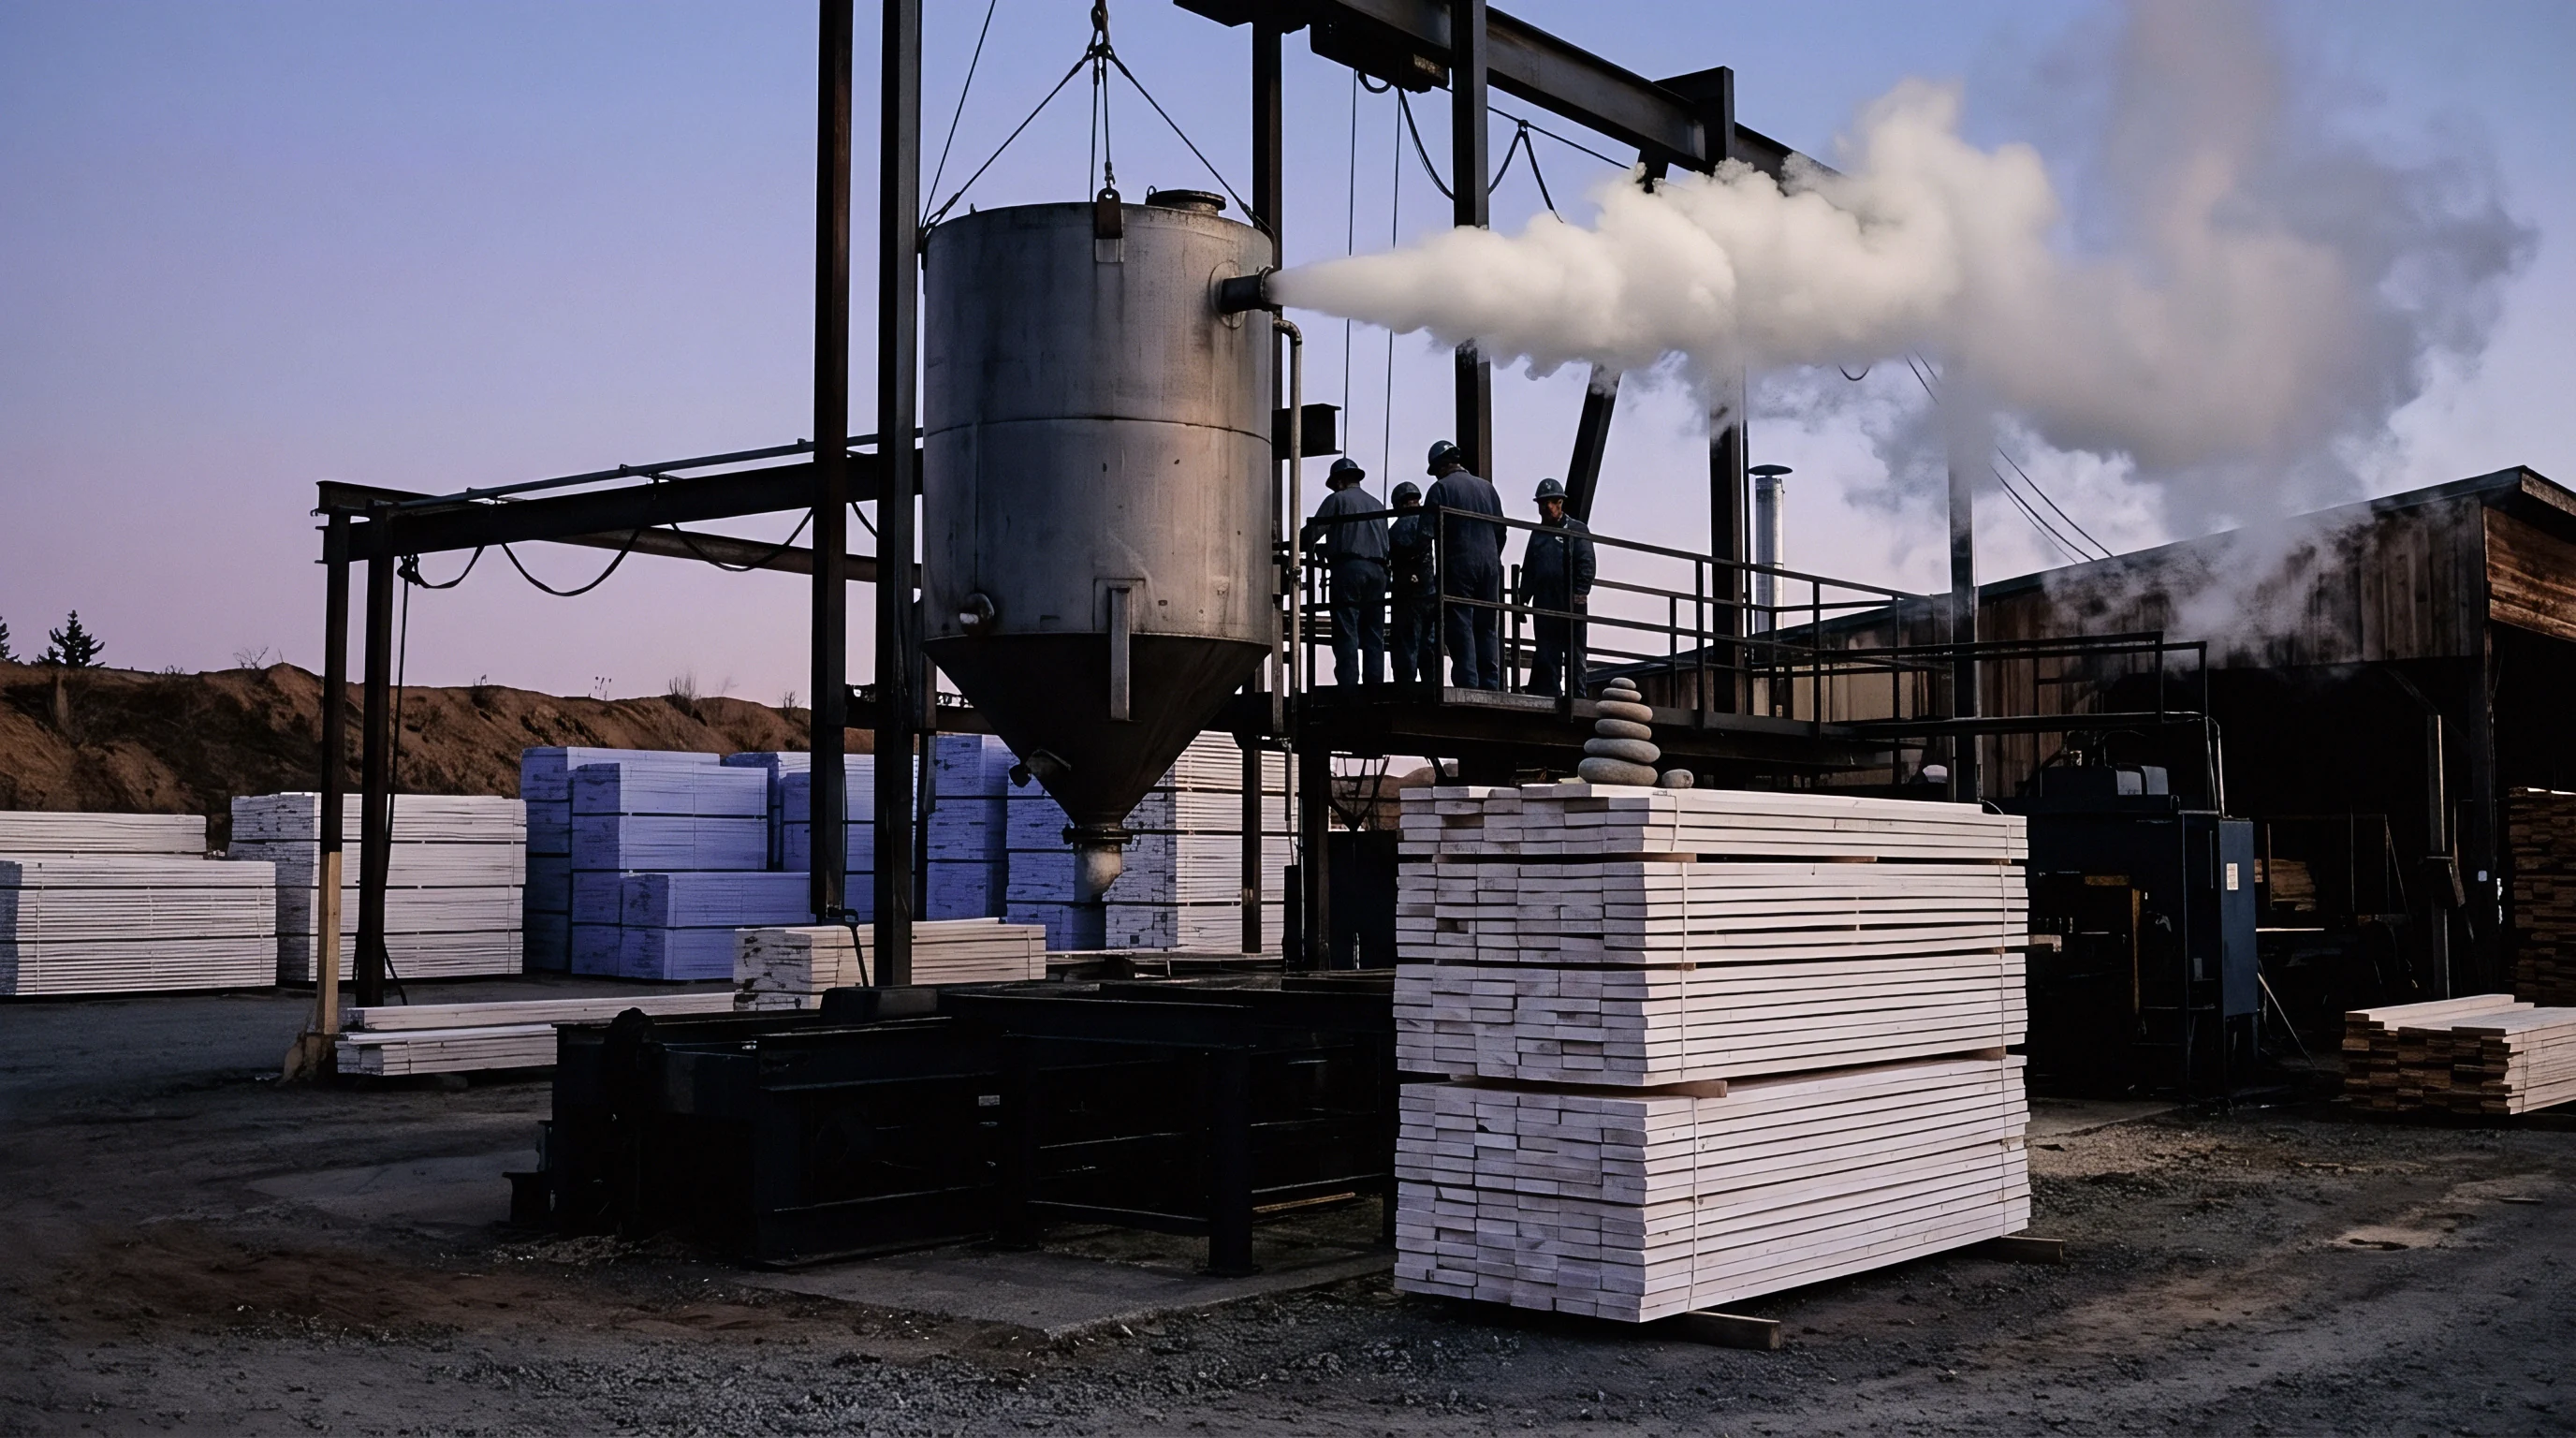
How Thermal Markers Partition across Cracking Phases?
Physical distribution of marker mass follows operational condensation parameters. The split between gas, liquid, and solid fractions depends directly on vapor exit temperatures, quench efficiency, and electrostatic precipitator performance. Discrepancy models formalize this partition using material distribution ratios (D_i), defined as the ratio of marker concentration in phase i relative to total recovered marker mass.
Phase partitioning models divide pyrolytic marker recovery into four critical stages:
- Vapor phase stripping draws volatile aliphatic marker scission products into non-condensable fuel gas streams destined for process burners.
- Liquid phase condensation captures middle-distillate marker fractions within synthetic naphtha and gas oil cuts between 180 and 360 degrees Celsius.
- Char phase agglomeration traps unreacted high-molecular-weight organometallics and polycyclic aromatic structures inside refractory furnace slag.
- Aerosol phase bypass carries sub-micron marker droplets through multi-stage cyclones directly into wastewater scrubbing liquors.
A mass balance declaration unsupported by phase partition coefficients defaults to zero credited recycled content under commercial warranty review.
When discrepancies surface during verification, the pyrolysis facility claims the missing tracer cracked into non-condensable gas fractions that fueled reactor burners, thereby certifying that circular mass truly entered the plant boundary even if the liquid product carries depleted analytical proof.

Discrepancy
Mathematical modeling reconciles the delta between physical marker concentration and credited mass balance values. The discrepancy quantification model constructs an algorithmic bridge combining kinetic decay rates, non-ideal mixing parameters, and multi-phase mass balance constraints. Without this calculation, mass balance certification under PEFC, FSC credit schemes, or ISCC PLUS collapses into speculative ledger entries unaligned with physical input flows.
Custody transfer demands documented yields. The foundational governing formulation defines the Discrepancy Correction Factor (DCF), which scales the analytically observed marker concentration (C_obs) to reconstruct the true initial mass allocation (M_in): M_in = (C_obs V_oil) / (Y_py (1 – Alpha_d) P_oil), where V_oil is total recovered oil volume, Y_py is overall reactor liquid yield, Alpha_d is the thermal degradation fraction computed via Arrhenius integration, and P_oil is the verified liquid phase partition coefficient.
Unmarked streams dilute allocated credits. When uncertified industrial scrap or fossil-based paraffin waxes blend into the pyrolysis reactor alongside marked post-consumer packaging, marker dilution compounds thermal decay losses. The discrepancy model separates thermal degradation from mechanical dilution by tracking baseline carbon-14 isotope ratios alongside synthetic chemical markers.
The table below illustrates the sensitivity of mass balance discrepancy calculations across fluctuating operating conditions.
| Reactor Temperature (°C) | Solids Mean RT (min) | Observed Marker (%) | Degradation Loss (%) | Dilution Factor | True Recycled Mass (t) |
|---|---|---|---|---|---|
| 480 | 12.0 | 88.4 | 8.2 | 1.04 | 38.2 |
| 520 | 15.5 | 64.1 | 31.5 | 1.08 | 37.9 |
| 550 | 18.0 | 42.7 | 52.8 | 1.12 | 38.1 |
| 580 | 22.5 | 21.3 | 74.6 | 1.18 | 37.6 |
| 620 | 25.0 | 7.8 | 89.1 | 1.25 | 36.8 |
Uncalibrated claims fail border checks. Assumptions behind the worked calculation demonstrate mathematical stability: take a 40-tonne lot of post-consumer barrier packaging feedstock containing 100 milligrams per kilogram of 1,4-bis(octyl)naphthalene marker fed into an auger pyrolyzer. Operating at 550 degrees Celsius with a mean residence time of 18 minutes, the observed marker recovery in the synthetic naphtha output measures only 42.7 milligrams per kilogram.
The raw measurement suggests a massive 57.3 percent attribution deficit. Integrating the verified kinetic cracking rate and liquid partition coefficient yields a true processed mass of 38.1 tonnes, maintaining balance ledger integrity within a 4.75 percent analytical tolerance window.
Contractual terms reflect these analytical limits. Under the standard feedstock off-take agreement based on EFET or CEFIC chemical industry forms, Clause 14.3 dictates that missing marker concentrations exceeding calibrated thermal degradation bands trigger an automatic financial settlement mechanism, forcing the chemical supplier to replace missing physical allocation credits with virgin-material rebate compensation within thirty billing days.


Penalty
Regulatory scrutiny exposes brand owners to administrative enforcement when recycled content declarations falter. The European Union Packaging and Packaging Waste Regulation (PPWR) mandates minimum post-consumer recycled plastic percentages in packaging by 2030, rising sharply by 2040. When customs officials and environmental enforcement agencies inspect imported multi-layer barrier paperboard cartons carrying chemical recycling claims, they audit the mass balance reconciliation dossier directly.
An unsupported discrepancy between declared recycled mass and analytically verified markers leads directly to cargo seizure, environmental claim revocation, and extended producer responsibility fee penalties.
Customs authorities calculate penalty interest daily. Sourcing desks handling cross-border packaging transactions account for extended administrative liabilities under national waste directives. If a declaration claiming 30 percent chemically recycled content in an extrusion barrier layer rests on uncompensated marker measurements, customs auditors treat the consignment as 100 percent virgin fossil polymer.
Under modern producer compliance rules, this reclassification triggers top-tier non-recycled plastic packaging levies, such as the UK Plastic Packaging Tax of 217.85 pounds sterling per tonne or European national packaging levies reaching 800 euros per tonne of pure virgin polymer equivalent.

When Customs Audits Dispute Attributed Recycled Content?
National border authorities review chain of custody certificates alongside laboratory GC-MS distillation reports. When analytical profiles fail to show declared markers, customs investigators execute documentary cross-checks to evaluate the credibility of mass balance allocation claims. Sourcing organizations maintain defensible compliance files by assembling five distinct tiers of technical evidence:
- Feedstock qualification dossiers confirming initial marker concentration and post-consumer waste certification under EN 15343 standards.
- Reactor kinetics calibration data detailing baseline Arrhenius cracking constants established in accredited ISO 17025 testing facilities.
- Continuous SCADA operational logs recording real-time pyrolysis bed temperatures, feed mass flows, and pressure profiles during batch production.
- Mass balance credit ledgers demonstrating compliance with ISO 22095 attribution rules without credit overdrafts across twelve-month cycles.
The baseline operational principle requires thermal degradation modeling to precede commercial certification rather than follow an audit inquiry.
Laboratory trials establish baseline kinetics. Brand owners printing circularity claims on retail food cartons face substantial market exposure if chain of custody verifications fail. Retailers delist products failing compliance scrutiny to avoid greenwashing litigation under the EU Green Claims Directive, which mandates independent substantiation for all environmental declarations.
When the physical tracer disappears inside the pyrolysis reactor without an empirical discrepancy model to defend the loss, the packaging asset converts into a corporate liability before clearing the arrival dock.
The margin of safety in certification shrinks whenever operating temperatures drift beyond validated ranges.

Reconciliation
Closing the governance gap demands rigorous operational alignment between chemical recycling plant operators, paperboard converters, and certification registries. Physical mass verification will not tolerate theoretical accounting loopholes where thermal marker losses are dismissed as random operational noise. Sourcing agents, packaging technologists, and compliance auditors incorporate physical discrepancy quantification models directly into quality assurance manuals, enterprise resource planning platforms, and commercial sales agreements.
Auditors reject retrospective mass balancing. Verification bodies operating under ISCC PLUS, REDcert2, and PEFC guidelines enforce strict mass attribution windows. When converters source polyethylene-coated folding boxboard containing chemically recycled content claims, the converter must verify that the pyrolysis oil supplier utilized an audited discrepancy model updated within the last six months.
Static degradation factors calibrated on virgin polymer test runs are systematically rejected during annual surveillance audits, resulting in certificate suspensions and commercial order cancellations across continental supply chains.
Discrepancy modeling prevents commercial forfeiture. As advanced recycling expands to process complex barrier papers, wax-coated corrugated containers, and metallized films, pyrolysis chemistry grows increasingly volatile. Sourcing professionals protect supply lines by insisting that raw test reports accompany every attribution ledger transfer, checking sample extraction methods, detection limits, and temperature logs against delivered delivery notes.
The commercial future of mass-balanced circular packaging depends entirely on whether chemical tracers survive pyrolysis or leave behind defensible mathematical proof of their thermal demise.
Whether future chemical recycling standards will universally mandate multi-tracer isotopic tagging matrices to eliminate kinetic discrepancy uncertainties remains an open question across international packaging qualification bodies.