Establishing Boundary Conditions for Physical Chemical Marker Recovery in Mass Balance Chain of Custody Audits
Physical marker recovery in mass balance audits requires correcting measured taggant content for wet-end retention loss, thermal decay, and matrix extraction yields.


Threshold

Taggant Physics in Fiber Suspension Matrices
Mass balance verification systems rely on physical chemical markers to validate certified material claims through complex pulp processing lines. Dosing synthetic DNA sequences, inorganic luminescent taggants, or isotopic signatures into a raw fiber stream establishes a physical trail alongside paper ledger calculations. Fiber slurries operating at consistencies between three percent and six percent present an active chemical environment where taggants bind to cellulose, adsorb onto mineral fillers, or remain suspended in the aqueous process water.
Retention behavior at the wet end determines the initial baseline concentration in the finished sheet. Fluorophore markers with cationic surface charges adhere directly to the negatively charged carboxylic acid groups of unbleached softwood kraft pulp. Negatively charged or non-ionic markers distribute predominantly into the filtrate, requiring higher mass addition rates at the hydrapulper to maintain detectable finished product levels.
Quantitative audit accuracy depends on establishing the baseline partition coefficient between retained fibers and white water fractions prior to converting operations.
Tagging chemistry requires matching the surface charge of the tracer compound to the zeta potential of the primary furnish.

Detection Boundaries in Solid Substrates
Analytical detection systems establish minimum quantifiable thresholds for physical markers embedded in finished board structures. Inductively coupled plasma mass spectrometry detects rare earth oxide taggants down to parts per billion, while real-time polymerase chain reaction quantifies synthetic oligonucleotide markers at picogram levels per gram of dry paperboard. Matrix suppression caused by calcium carbonate coatings, starch surface sizes, and residual lignosulfonates elevates the limit of quantification relative to pristine aqueous control samples.
Pulping additives introduce spectral and chemical background signals that obscure low-concentration markers. Fluorescent whitening agents emit broadly in the 420 to 470 nanometer spectrum, obscuring organic luminescent tags operating within identical emission bands. Establishing an audit baseline demands blank matrix baseline testing for every specific furnish composition running through the mill line.
A physical marker concentration falling below five times the verified limit of quantification yields ambiguous mass balance accounting during third-party verification. Unambiguous attribution requires marker concentrations that sit sufficiently above background noise to tolerate process dilutive factors. Mass balance credit transfers fail when analytical variance exceeds the claimed percentage of certified content.


Shear

Mechanical Stress and Physical Tag Disruption
Refining processes generate high hydrodynamic forces that physically alter marker compounds attached to fiber walls. Conical and double disc refiners operating at specific edge loads between 0.5 and 3.0 watt-seconds per meter impose compressive and shearing forces on suspended cellulose webs. These mechanical forces break micro-encapsulated chemical markers, releasing active taggants into process water loops where thin-stock washing units remove them from the fiber mat.
High-consistency pulping equipment subjects synthetic polymers and particulate tracers to severe friction against recycled corrugated containers. Fiber friction strips surface-bound markers from cellulosic surfaces, driving the taggant into suspension where clarifiers and dissolved air flotation units extract it as sludge. Taggant recovery drops linearly as refining intensity increases, creating a structural mismatch between real fiber presence and measured chemical signal strength.

Where Do Chemical Markers Shear during Stock Preparation?
Fibers experience peak mechanical deformation within the narrow gap between stationary and rotating refiner plates. Plate bars passing at high velocities create pressure pulses exceeding ten bar alongside localized fluid velocity gradients. Synthetic DNA markers without protective inorganic shells cleave under these high shear fields, destroying the specific nucleotide sequence required for polymerase chain reaction amplification.
Inorganic nanocrystals demonstrate higher physical durability under mechanical forces, but suffer from physical mechanical detachment. When refiners fibrillation unzexports primary wall cellulose fibers, surface-bound inorganic particles detach and transfer to the liquid phase. The free taggants bypass the wire section on the Fourdrinier table, accumulating in closed-loop white water circuits until bleed-off streams reject them from the facility balance.
- Refiner Plate Edge Shearing forces cause physical breakdown of microcapsule structures, releasing volatile core taggants directly into the slurry liquid phase.
- High-Density Cleaner Cavitation strips heavy inorganic particulate markers from fiber surfaces through localized pressure drops and intense fluid turbulence.
- Hydrapulper Rotor Impeller Impact tears agglomerated polymer taggants into sub-micron particles that slip through fine screen slots into waste streams.
- Deculator Vacuum Deaeration volatilizes low-molecular-weight chemical markers under reduced pressure elevated temperature conditions within stock delivery loops.
Substrate processing equipment running at maximum mechanical intensity strips taggants faster than predicted by static bench testing. Mills frequently attribute missing physical marker mass to chemical consumption during pulping rather than accounting for mechanical separation at stock prep equipment. Accounting models that neglect mechanical loss parameters produce unresolvable variance reports during annual chain of custody inspections.


Heat

Thermodynamic Degradation in Paper Drying and Chemical Pulping
Thermal profiles across dryer sections present severe environmental boundaries for organic chemical markers. Wet paper webs enter the dryer train at roughly sixty percent moisture and experience surface temperatures ranging from 90 to 160 degrees Celsius across thirty to sixty steam-heated cylinders. Organic taggants undergo thermal oxidation, cleavage, or caramelization when exposed to elevated temperatures in the presence of residual water vapor.
Chemical pulping operations introduce extreme thermodynamic and pH conditions that degrade unprotected markers before paper forming occurs. Kraft cooking liquor reaching 170 degrees Celsius with pH values above 13 hydrolyzes ester bonds in synthetic taggants within forty minutes. Sulfite pulping under acidic conditions at 140 degrees Celsius cleaves ether linkages, completely destroying organic fluorophore structures before the brownstock reaches the washer stage.
| Marker Chemical Family | Maximum Continuous Temperature | pH Tolerance Range | Primary Failure Mode | Typical Yield Loss Range |
|---|---|---|---|---|
| Unprotected Synthetic Oligonucleotides | 85 degrees Celsius | 5.0 to 8.5 | Thermal depunination and strand cleavage | 70 to 98 percent |
| Silica-Encapsulated DNA Sequences | 140 degrees Celsius | 3.0 to 10.5 | Silica shell dissolution in strong alkali | 10 to 30 percent |
| Rare Earth Element Complexes | 1100 degrees Celsius | 1.0 to 14.0 | Precipitation as insoluble hydroxides | 2 to 8 percent |
| Organic Fluorescent Dye Derivatives | 120 degrees Celsius | 4.0 to 9.0 | Photodegradation and thermal oxidation | 25 to 65 percent |

Chemical Oxidative Breakdown during Bleaching
Elemental chlorine-free bleaching sequences deploy aggressive oxidants that alter marker molecular structures. Chlorine dioxide stages operating at 70 degrees Celsius and pH 2.5 oxidize aromatic rings in organic markers, destroying UV fluorescence and mass spectrometry signature profiles. Hydrogen peroxide stages under alkaline conditions produce hydroxyl radicals that rapidly cleave synthetic polymer chains.
Ozone bleaching stages present the most severe chemical boundary for physical traceability markers. Ozone attacks carbon-carbon double bonds with high reactivity, degrading organic taggants within seconds of contact in high-consistency reactors. Industrial mass balance recovery models must apply chemical degradation correction factors based on the specific bleaching sequence applied across the pulp line.
ISO 22095 chain of custody rules mandate that physical tracer loss through chemical degradation cannot be categorized as certified volume output.
Standard supply contracts specify that marker loss during chemical bleaching falls entirely outside acceptable manufacturing tolerances unless explicitly covered by credit system conversion factors. Incorporating chemical degradation coefficients into mass balance software prevents artificial inflation of certified credit accounts. The failure to account for thermal oxidation under TAPPI T 410 conditions invalidates downstream chain of custody claims.


Extraction
Analytical Recovery and Matrix Interference
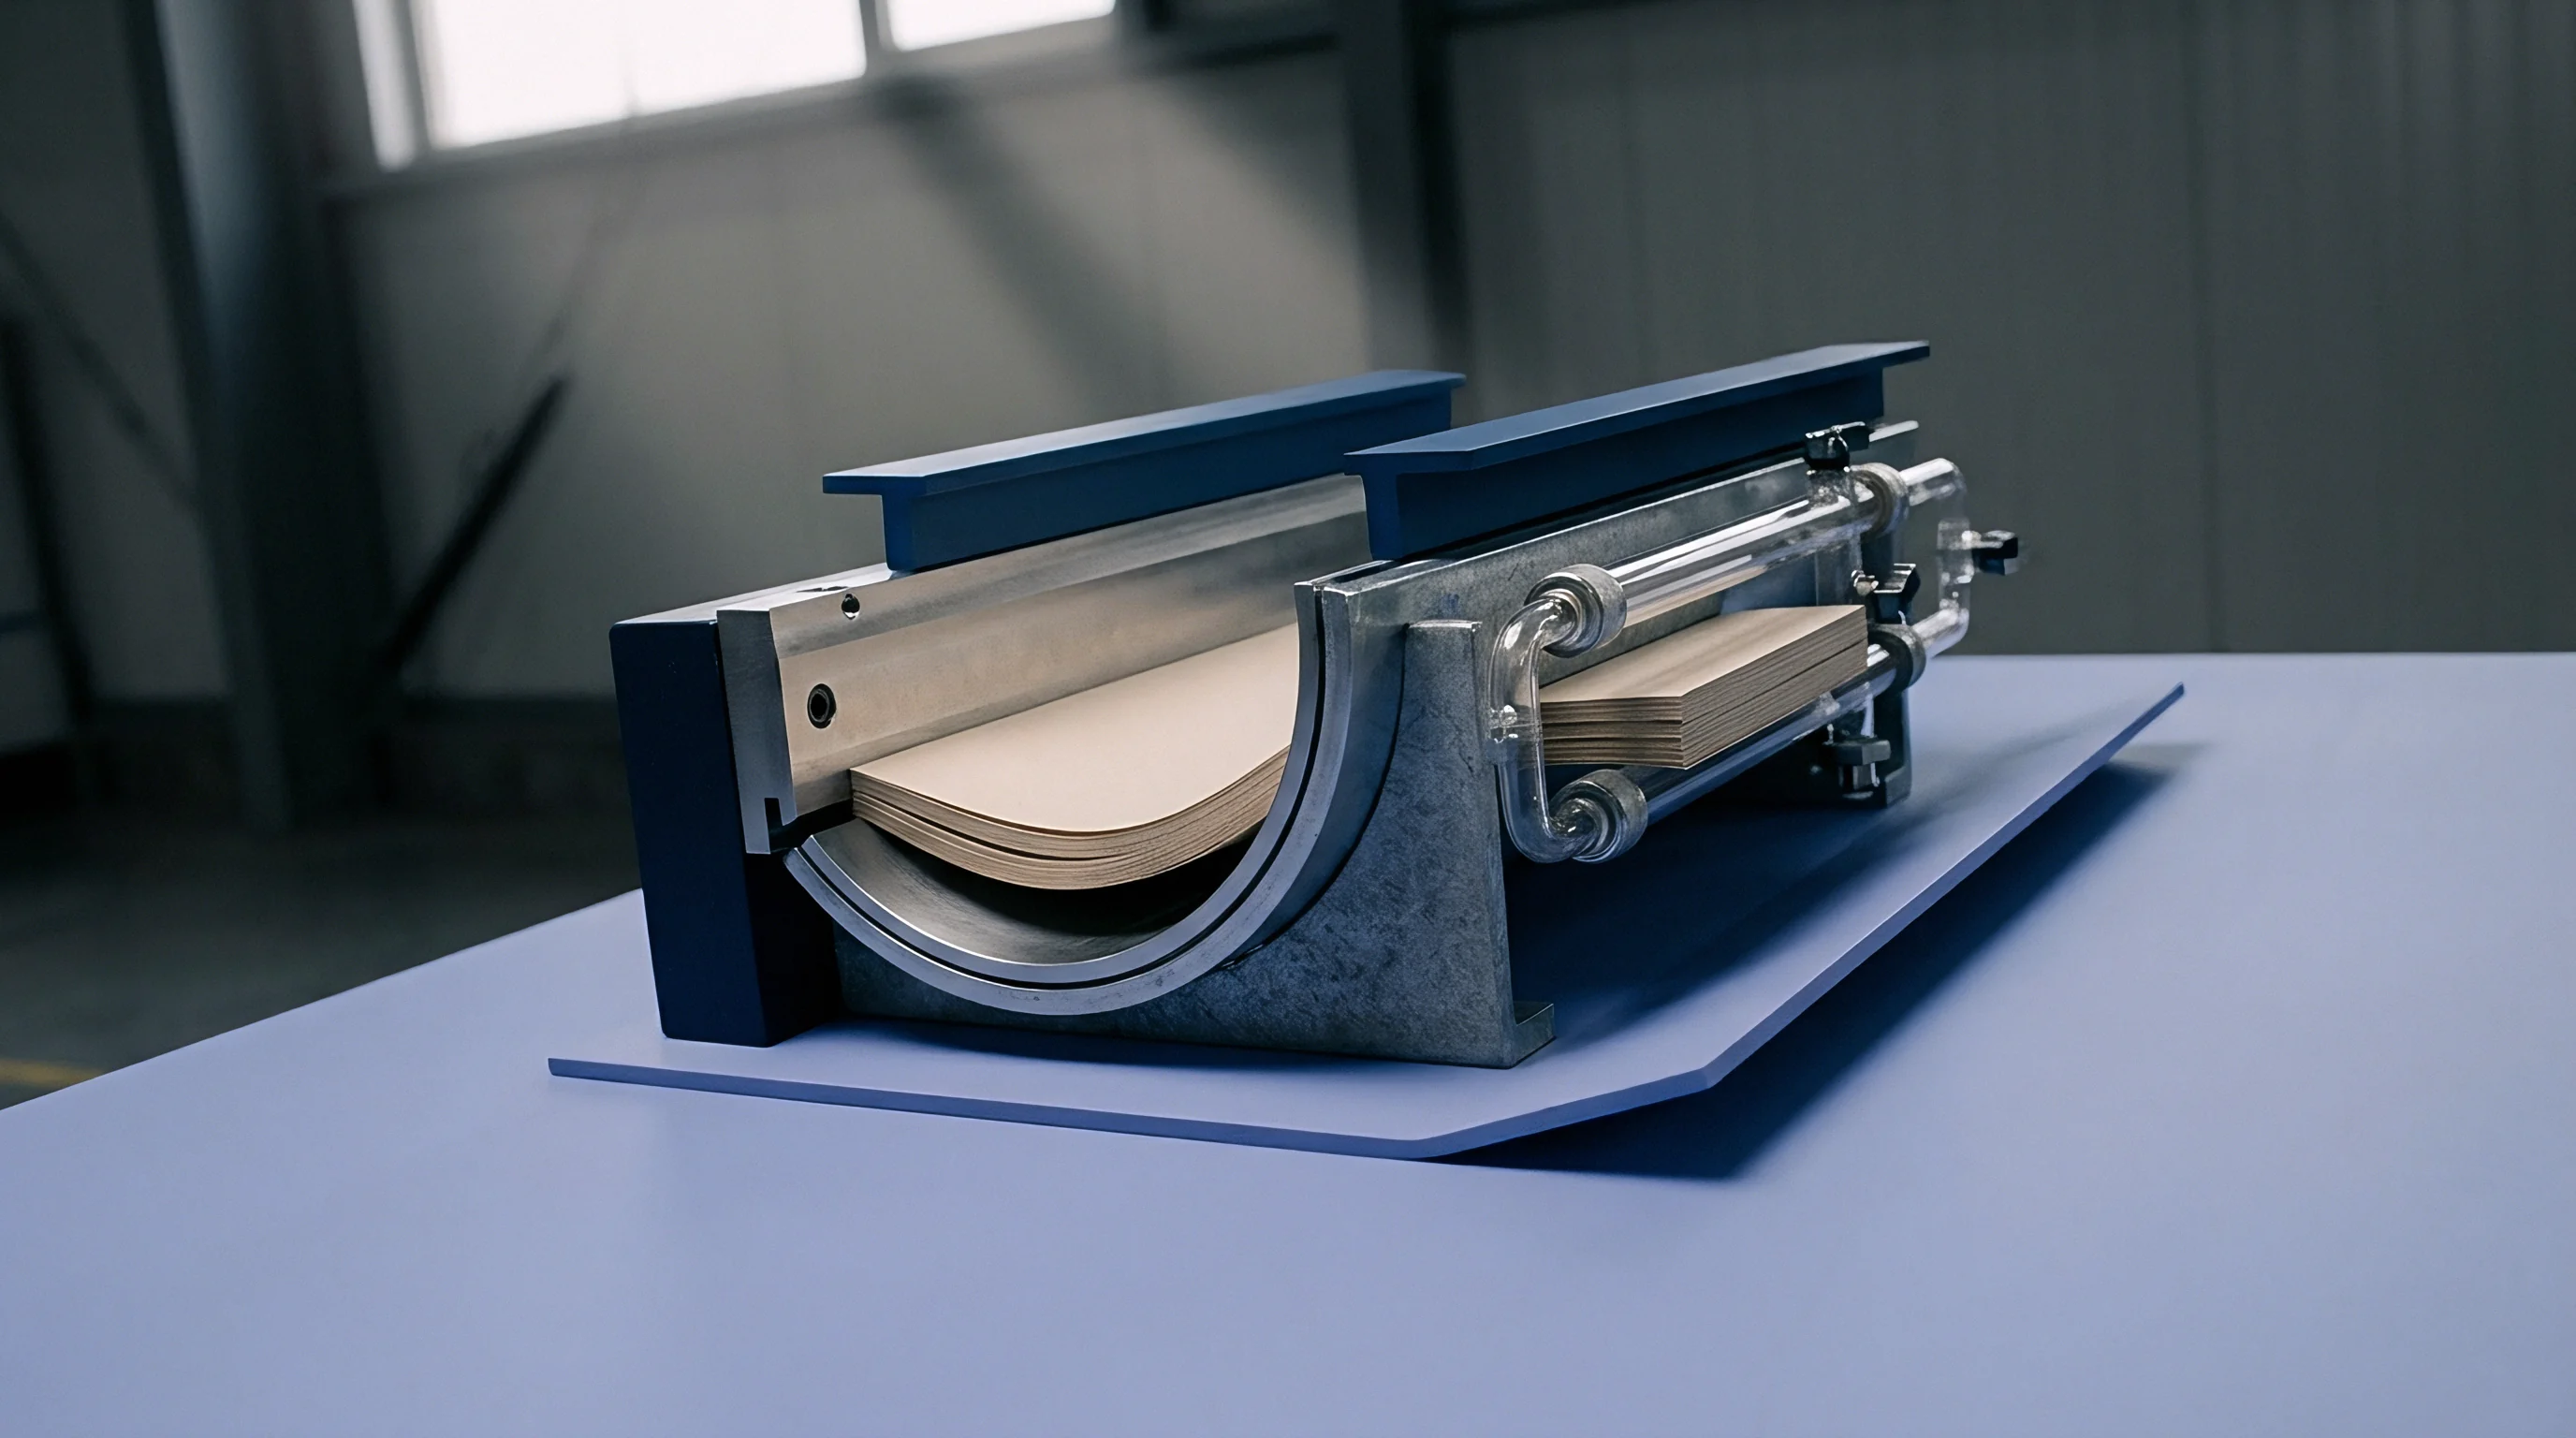
Quantifying physical markers in paper and board packaging requires complete extraction from the cellulose matrix without altering the chemical structure of the marker. Solvent extraction using accelerated solvent extraction protocols at elevated pressures extracts hydrophobic organic markers from dry board fibers. Wet digestion using concentrated nitric acid and hydrofluoric acid breaks down cellulosic and inorganic coatings to liberate rare earth element markers for mass spectrometry measurement.
Matrix interference reduces analytical recovery efficiency below theoretical yields. Lignin residues in unbleached kraft papers bind hydrophobic chemical tags through pi-stacking interactions, requiring aggressive polar solvent mixtures to release the marker into the liquid phase for analysis. Incomplete extraction leads directly to undercounting physical content, triggering false failure reports during compliance audits.

Worked Mass Balance Reconciliation Model
An audit reconciliation calculation converts raw analytical marker signal strength into a physical mass balance balance sheet for a 100-tonne production lot of certified paperboard. Assume a nominal target addition rate of 100 milligrams of rare earth oxide taggant per dry tonne of pulp during hydrapulping, representing 10,000 milligrams of total taggant input across the production run.
Analytical testing of the finished paperboard yields a measured marker concentration (Cmeasured) of 72.0 milligrams per tonne. The laboratory establishes an analytical extraction recovery factor (R) of 0.88 (88 percent yield) for the paperboard matrix, and a chemical bleaching loss factor (α) of 0.05 (5 percent loss) based on mill-specific process calibration.
The true retained physical marker concentration (Ctrue) in the final product is calculated using the recovery factor:
Ctrue = fracCmeasuredR = frac72.00.88 = 81.82 mg/tonne
Total physical marker mass retained in the 100-tonne finished lot (Mrηined) equals:
Mrηined = 81.82 mg/tonne × 100 tonnes = 8,182 mg
The physical mass loss percentage (Lphysical) across wet-end retention, white water discharge, and thermal drying is computed against the initial input mass (Minput = 10,000 mg):
Lphysical = left( 1 – fracMrηinedMinput right) × 100 = left( 1 – frac8,18210,000 right) × 100 = 18.18%
Accounting for the known 5 percent bleaching loss factor (α = 0.05), the unmapped process loss factor (Lunmapped) representing retention leakage or unrecorded discharge is:
Lunmapped = Lphysical – (α × 100) = 18.18% – 5.00% = 13.18%
This 13.18 percent unmapped physical loss represents white water filtrate losses and mechanical binding to mill rejection fractions. The audit reconciliation accepts the lot certified volume claim provided this unmapped loss remains within the mill’s pre-qualified retention variance envelope of 15.0 percent.
| Substrate Grade | Extraction Solvent System | Mean Analytical Yield (R) | Relative Standard Deviation | Dominant Matrix Interferent |
|---|---|---|---|---|
| Unbleached Kraft Linerboard | Dichloromethane / Methanol (80:20) | 82.4 percent | 4.2 percent | Residual hydrophobic lignin |
| Bleached Hardwood Market Pulp | Aqueous Buffer / Proteinase K | 94.1 percent | 2.1 percent | Carboxymethyl cellulose fines |
| Coated Folding Boxboard | Nitric Acid / Hydrogen Peroxide Digestion | 88.6 percent | 3.8 percent | Calcium carbonate coating binder |
| Recycled Corrugated Medium | Tetrahydrofuran / Ethanol (50:50) | 76.3 percent | 6.5 percent | Bitumen and synthetic adhesive contaminants |
- Sample collection requires pulling ten representative square-decimeter sheets across the reel width according to ISO 186 sampling standards.
- Cryogenic milling reduces the sampled paperboard to a fine powder passing a 40-mesh sieve without generating frictional heat that degrades markers.
- Accelerated solvent extraction runs at 100 degrees Celsius and 1500 psi for three static cycles to extract targeted organic tracer compounds.
- Internal standard addition of stable-isotope labeled analogues corrects for volume losses during extract concentration steps.
- Quantitative analysis by mass spectrometry measures final analyte concentration against a matrix-matched calibration curve.
Quantification results feed directly into accounting balances to confirm physical fiber movement against claimed credit ledger volumes. Discrepancies between physical marker presence and paper balance ledgers indicate improper credit allocations or unverified input fiber streams entering the pulper. A fully verified recovery factor prevents false rejection of certified production lots during third-party chain of custody audits.


Discrepancy

Audit Boundaries and Variance Reconciliation
Physical chemical marker recovery values rarely match paper ledger balances perfectly due to cumulative physical, chemical, and analytical losses. Audit systems establish defined variance tolerances within which physical marker recovery verifies the underlying material claim. A reconciliation threshold setting acceptable recovery variance at plus or minus 15 percent accommodates normal wet-end process fluctuations without triggering formal corrective action requests.
When measured physical marker levels fall below the lower tolerance boundary, auditors perform secondary verification steps. Unexplained physical marker deficits suggest the introduction of non-certified virgin fiber or uncertified post-consumer waste into the stock preparation system after the marker addition point. Conversely, physical marker concentrations exceeding target baseline figures signal improper marker dosing, incomplete mixing, or white water loop accumulation.
A physical marker recovery reading below sixty percent automatically invalidates physical chain of custody claims under accredited verification protocols.
Decision Logic for Audit Findings
Resolving audit discrepancies requires a systematic evaluation of process chemistry records, mill water balances, and laboratory extraction reports. Certification bodies utilize defined decision criteria to categorize physical marker anomalies into process losses, measurement errors, or chain of custody failures.
- Uncalibrated Addition Rates result in immediate audit suspension until mass-flow meter calibration records prove accurate marker dosing at the pulper.
- Analytical Recovery Drift mandates re-extraction of retained archival samples using matrix-matched standards to recalculate the baseline recovery yield factor.
- White Water Accumulation requires adjustments to systemic recovery equations to account for marker recirculation in fully closed water circuits.
- Substitution of Fiber Furnish leads to permanent withdrawal of certified material claims for the affected production lot and formal non-conformance reporting.
Enforcement of physical marker requirements shifts compliance liability directly to packaging converters and paper manufacturers. Misrepresenting uncertified fiber as certified content due to poorly calculated marker recovery parameters leads to customs delays, financial penalties under green claims legislation, and mandatory product recalls across international markets.