Laboratory Screen Slot Dimensions and Macro-Stickie Yield Calculation Methods
Laboratory screen slot dimensions dictate macro-stickie separation efficiency, requiring standardized 0.10 millimeter slot width calibration to calculate accurate area yields for packaging recyclability certification.

Geometry
Precision separation of non-water-soluble adhesive contaminants in recovered paper stock relies on exact physical barriers. Laboratory slot screening mechanisms isolate hydrophobic synthetic polymers, hot melts, pressure-sensitive adhesives, and wax fractions from wood fiber suspensions based strictly on particle cross-section. Particle passage depends on width rather than length or mass.
Physical slot dimensions define the boundary between macro-stickies, which remain on the screen plate, and micro-stickies or suspended colloids, which pass into the accept stream.
Slot geometry governs particle passage directly.
Standard laboratory testing instruments, such as Somerville, Haindl, and Pulmac screening units, utilize slotted nickel or stainless steel plates manufactured to exact mechanical specifications. Standard slot width settings for macro-stickie determination are 0.10 millimeter (100 micrometers) or 0.15 millimeter (150 micrometers), with a height tolerance restricted to plus or minus 0.005 millimeter. Slot edge profiles are machined with sharp perpendicular corners to prevent particle rolling.
A rounded contour on the leading edge of a slot reduces hydraulic resistance but allows flexible stickie contaminants to deform and squeeze through at lower differential pressures.
Slotted screen plates with edge radii exceeding 0.02 millimeters cause an artificial fifteen percent drop in measured macro-stickie yield by allowing compressible adhesives to pass through the barrier.
Slit length, relief angles, and open surface area ratio govern the fluid dynamics across the screen plate during standard testing cycles. A standard Somerville plate features 0.10 millimeter slot widths spaced at 1.50 millimeter intervals across a flat plate, yielding a specific open area percentage. The plate undergoes rapid horizontal vibration while a regulated water shower maintains a constant slurry height and continuous pulsation.
Deformable synthetic materials experience combined hydrodynamic shear forces and pressure pulses that drive clean fiber through the apertures while retaining tacky synthetic contaminants larger than the cut-off dimension. Misalignment of the plate relative to the drive mechanism introduces uneven shear fields, driving macro-stickies into the filtrate and skewing quantification results. Uncontrolled plate wear increases effective slot aperture, rendering historical pulp quality records incomparable across batch runs.

Fractionation
Standardized fractionation separates macro-stickies from cellulosic pulp fibers using mechanical screening, rinsing, and collection protocols. International standards specify exact fiber slurry consistency, temperature, agitation rate, and washing duration to ensure repeatable contaminant isolation. Deviations in slurry consistency alter fiber mat formation on the plate surface, creating an artificial filter medium that traps contaminants smaller than the nominal slot width.

Mechanical Washing and Contaminant Isolation
Preparation of recycled pulp samples requires disintegration in accordance with ISO 5263 or TAPPI T 205 to fully separate individual fibers without shearing macro-stickie particles into smaller fragments. High-shear mixing during sample preparation breaks large adhesive films into micro-stickies, undercounting macro-stickie yield in the final report. Disintegrated pulp suspensions, diluted to a consistency between 0.2 percent and 0.5 percent oven-dry fiber content, are fed into the screening chamber under controlled water supply pressure.
Clean water rinses remove residual fibers.
Water temperature during laboratory screening affects stickie physical state. Testing conducted above the glass transition temperature or softening point of common synthetic adhesives increases particle elasticity, causing macro-stickies to stretch and extrude through 0.10 millimeter slots. Standard methods maintain washing water temperatures strictly within 20 to 22 degrees Celsius to maintain structural rigidity of synthetic polymers during physical fractionation.
| Standard Designation | Screen Type | Slot Width (mm) | Slurry Consistency (%) | Wash Duration (min) | Water Temp (°C) |
|---|---|---|---|---|---|
| TAPPI T 274 | Pulmac MasterScreen | 0.10 or 0.15 | 0.30 to 0.50 | 10.0 | 21 ± 1 |
| INGEDE Method 4 | Haindl or Somerville | 0.10 or 0.15 | 0.20 to 0.30 | 20.0 | 20 ± 2 |
| ISO 15360-2 | Laboratory Vibrating Screen | 0.15 | 0.15 to 0.25 | 15.0 | 20 ± 2 |
| CEPI Recyclability | Somerville Screen | 0.15 | 0.50 | 20.0 | 20 ± 1 |
Post-Screening Transfer and Substrate Preparation
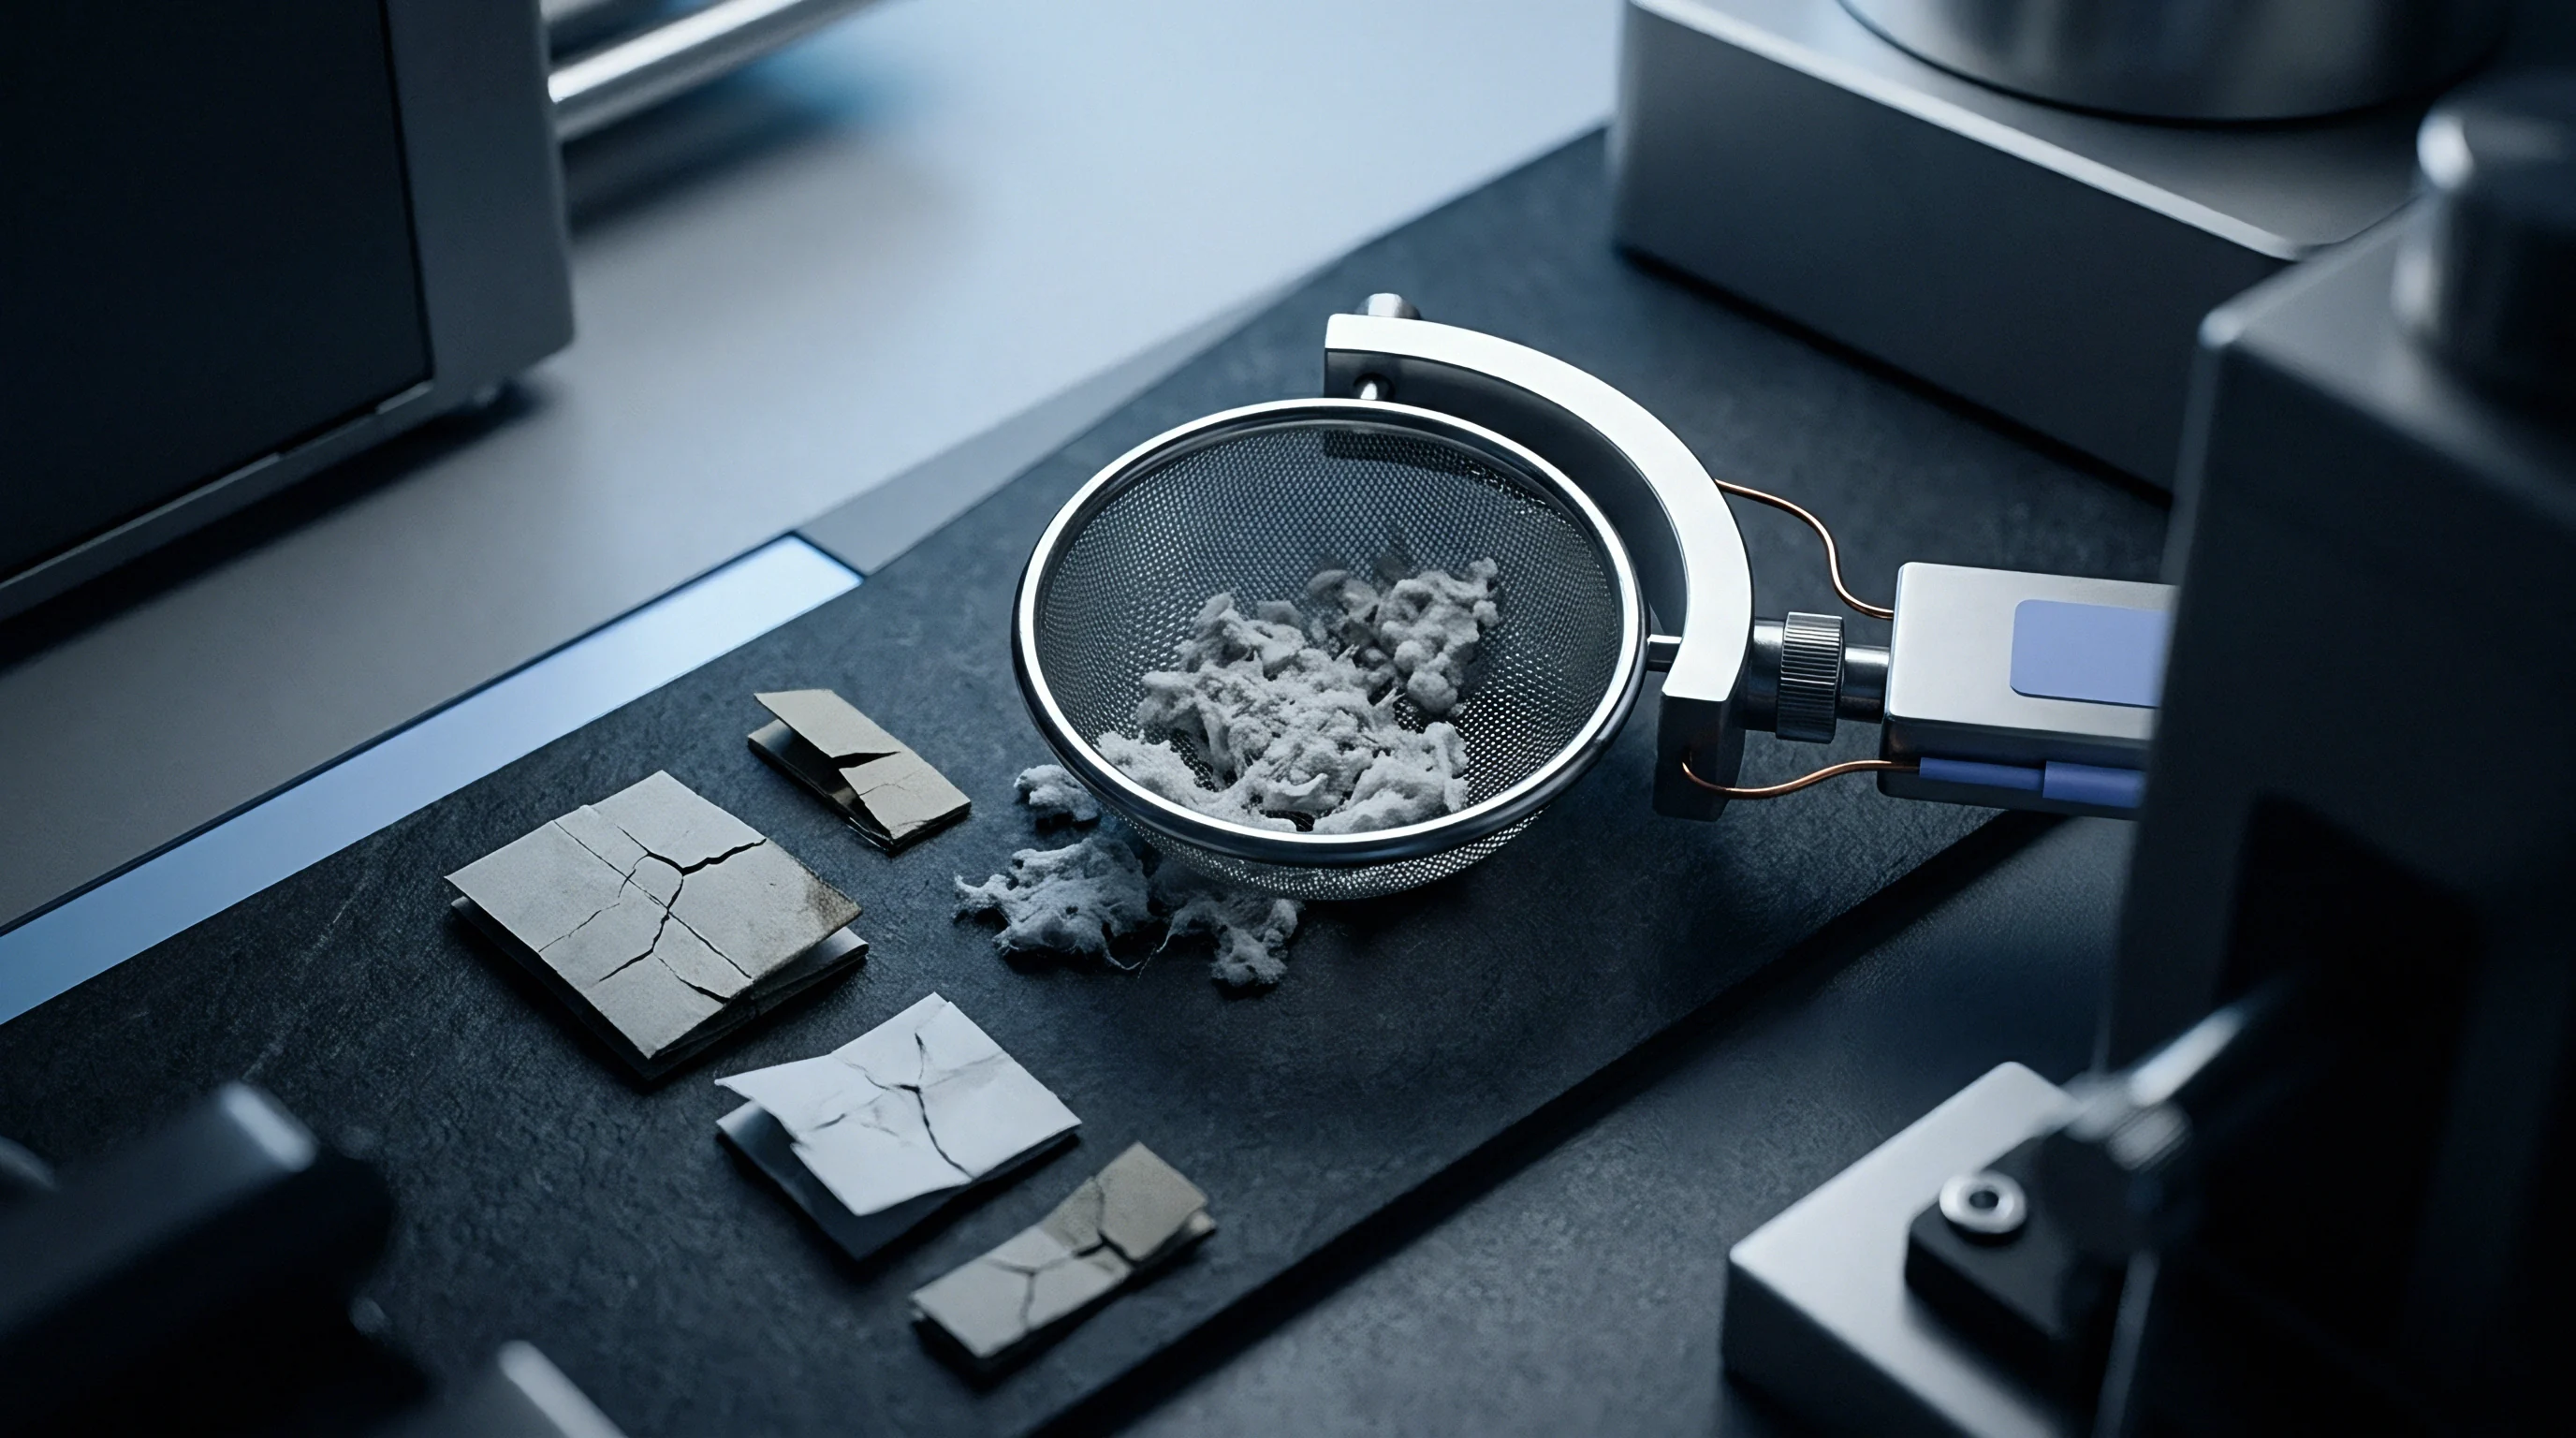
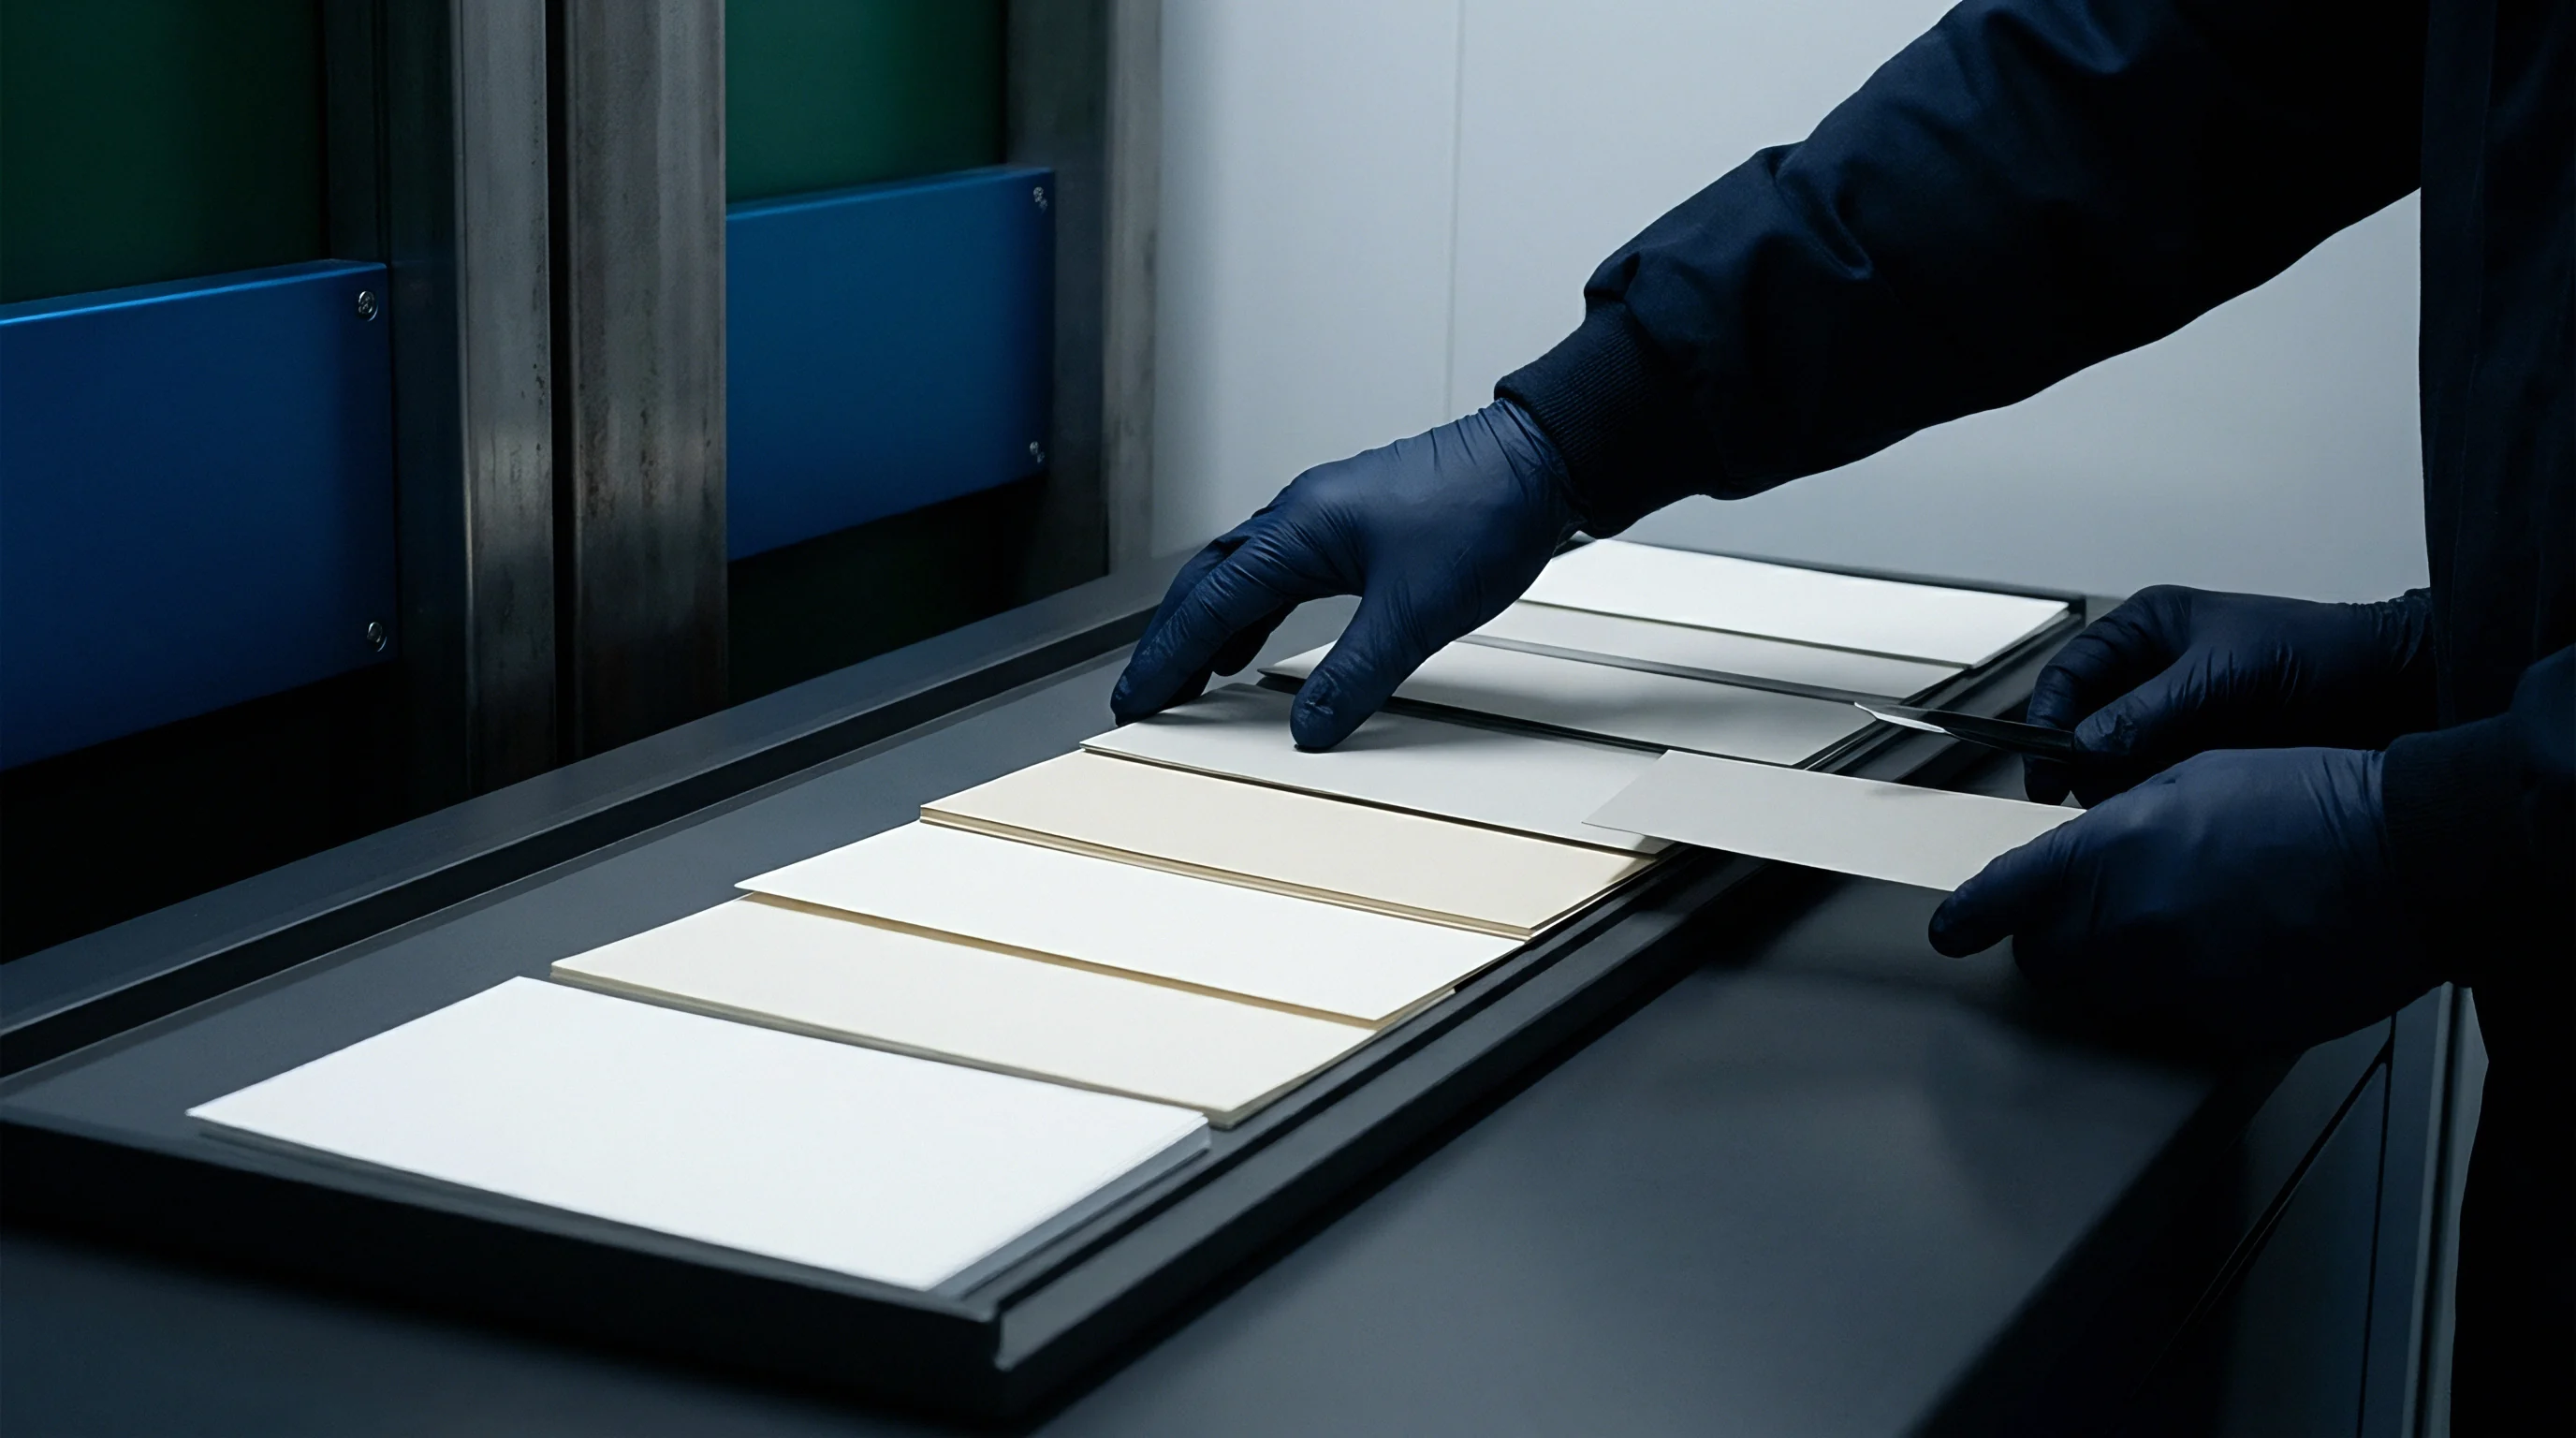
Material retained on the slotted plate is quantitatively transferred onto filter paper or coated black paper sheets for subsequent examination. Rinsing water under light spray conditions collects every particle from the slot grooves without forcing stuck adhesives through the underside. The collected retentate contains macro-stickies, plastics, shives, flakes, and unpulped paper fragments.
Differentiating adhesive contaminants from non-tacky organic matter demands thermal transfer, press-staining, or visual inspection techniques.
Thermal history alters tackiness significantly.
Coating the screen retentate with siliconized filter paper prior to hot pressing fixes pressure-sensitive adhesives to the transfer substrate without fragmenting soft polymer agglomerates.
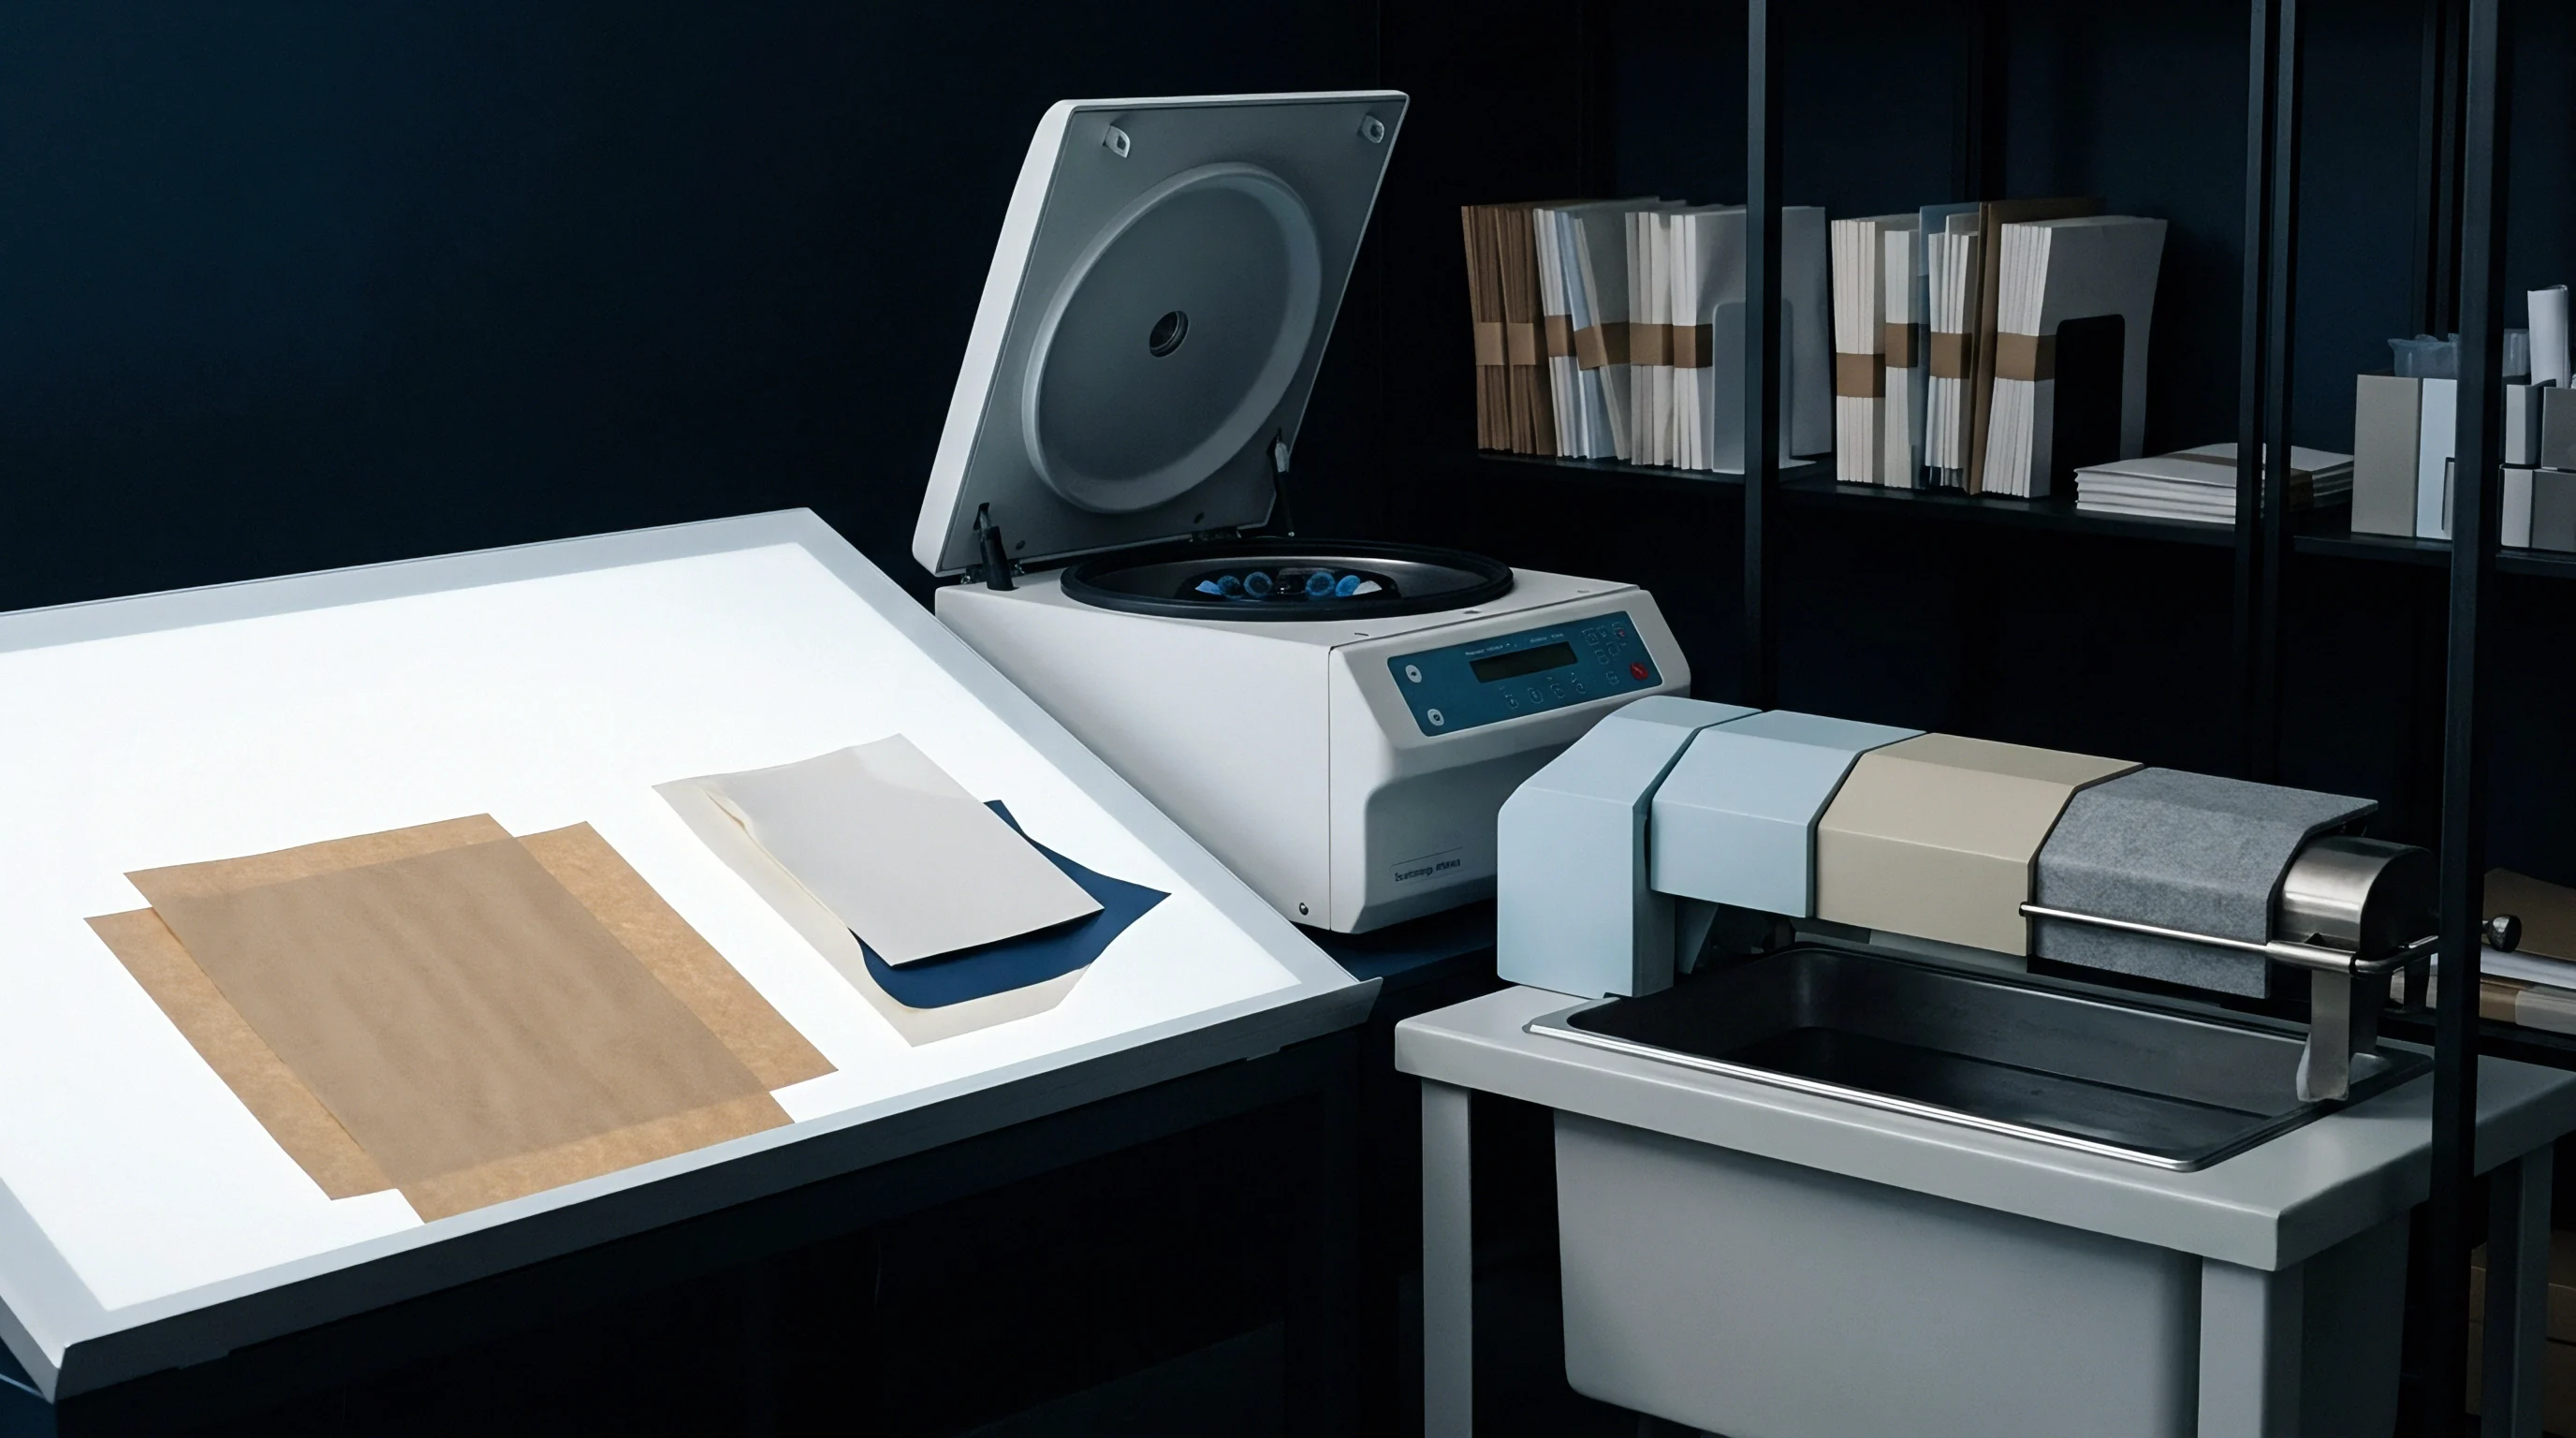
Heat-assisted transfer places the retentate in contact with a silicone-coated transfer sheet under a mechanical press set between 95 and 105 degrees Celsius at a pressure of 300 kilopascals for 10 minutes. Tacky components melt or soften, bonding permanently to the target substrate while non-adhesive wood fibers remain unattached and are washed away with a controlled water jet. Retentate handling protocols dictate complete surface drying before image analysis to prevent wet cellulosic fibers from shadowing adhesive particles.
Proper calibration of laboratory screen plates remains the primary defense against systemic drift in pulp quality metrics across supply chains.
Quantification
Converting isolated macro-stickie samples into numerical yield figures requires mass-based or area-based calculation methods. Area concentration expressed as square millimeters per kilogram of oven-dry pulp, alongside mass concentration expressed as milligrams per kilogram, represents the standard industry reporting parameter. Automated optical image analysis provides high-speed particle measurement, replacing manual counting procedures that carry high operator subjectivity.
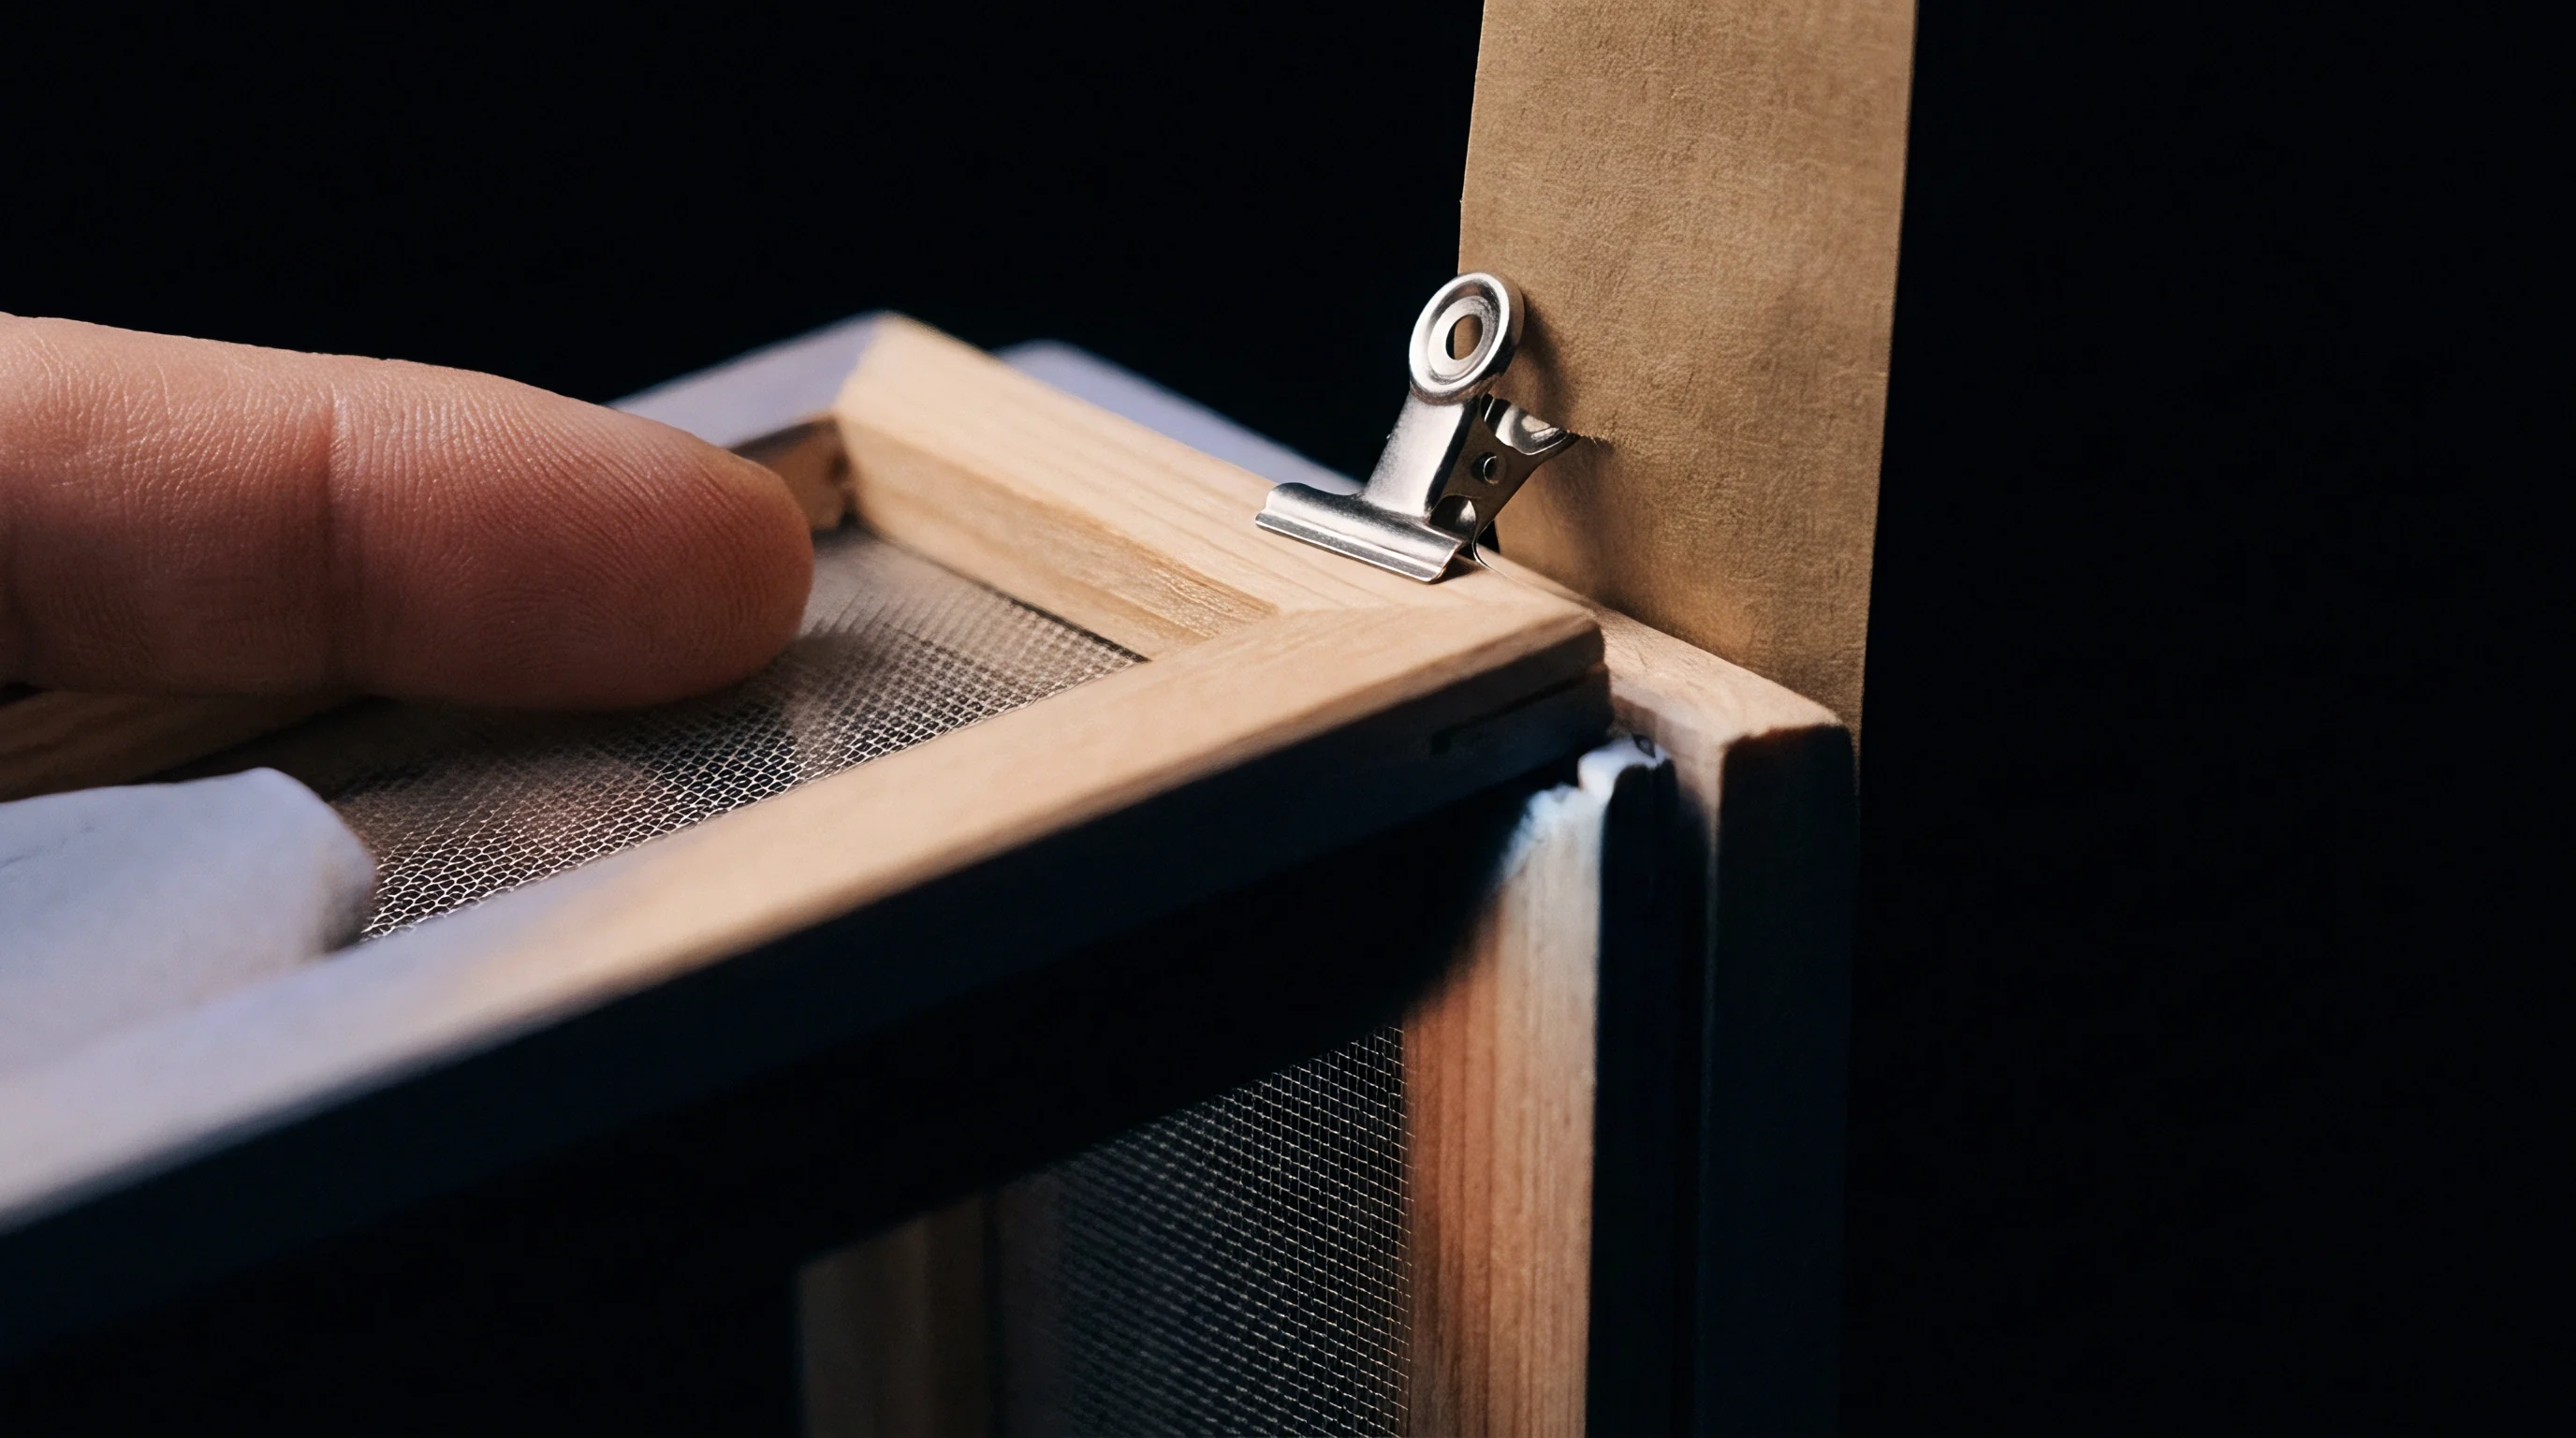
Image Processing Parameters
- Substrate Preparation places the dried coated paper carrying transferred stickies into an optical scanner bed with a calibrated black background backing plate.
- Image Capture acquires high-resolution digital imagery at a spatial resolution of no less than 600 dots per inch (23.6 dots per millimeter), generating a minimum pixel dimension of 0.042 millimeter per pixel side.
- Gray-Scale Conversion transforms 24-bit color images into 8-bit monochromatic intensity matrices using standardized luminance weighting factors.
- Threshold Setting applies a fixed binarization cut-off based on contrast differentials between dark background surfaces and white or dyed adhesive particles.
- Particle Measurement measures the pixel area of every connected foreground object exceeding 0.04 square millimeter surface area to exclude noise artifacts.

Yield Calculation Derivation and Formula Structure
Calculating macro-stickie yield involves normalizing the total detected contaminant area or mass against the exact dry mass of the processed pulp sample. The fundamental equation for total macro-stickie area concentration per kilogram of dry fiber follows:
A_total = ( Sum(a_i) / m_dry ) 1000
In this equation, A_total represents the total macro-stickie area yield in square millimeters per kilogram, a_i represents the measured area of an individual stickie particle i in square millimeters, and m_dry represents the oven-dry mass of the analyzed pulp sample in grams. When converting to percentage yield loss or weight-based concentrations, the mass of isolated stickies is measured directly using gravimetric balances following solvent extraction of non-stickie contaminants.
Visual inspection fails without digital image analysis.
To demonstrate the calculation method under standard laboratory conditions, consider a worked analysis of a recovered paper shipment. Assume an operator processes a wet pulp sample with a total mass of 125.0 grams and a measured solids content of 32.0 percent. The dry fiber mass m_dry equals 40.0 grams (0.040 kilograms).
Following fractionating through a 0.15 millimeter Somerville slot screen and subsequent thermal transfer image analysis, the system detects a total of 342 individual macro-stickie particles across the test substrate.
The image analysis system tabulates the size distribution of the detected particles:
- Small Fractions measuring between 0.04 and 0.10 square millimeters total 180 particles with a combined area of 11.50 square millimeters.
- Medium Fractions measuring between 0.10 and 0.50 square millimeters total 125 particles with a combined area of 28.75 square millimeters.
- Large Fractions measuring between 0.50 and 2.00 square millimeters total 30 particles with a combined area of 27.00 square millimeters.
- Coarse Fractions measuring above 2.00 square millimeters total 7 particles with a combined area of 18.20 square millimeters.
Summing the area contributions yields a total stickie surface area of 85.45 square millimeters on the test sheet. Applying the area concentration formula yields:
A_total = ( 85.45 mm² / 40.0 g ) 1000 = 2136.25 mm²/kg
Calculating the mass yield requires gravimetric evaluation of the retentate sheet following tared weighing on an analytical balance precise to 0.1 milligram. Assuming the extracted adhesive mass equals 3.8 milligrams from the same 40.0 gram dry pulp sample, the mass concentration calculation follows:
C_mass = ( 3.8 mg / 0.040 kg ) = 95.0 mg/kg (or 95 ppm)
Suppliers frequently cite low particle counts while omitting the total surface area figures that dictate actual paper machine runnability problems.

Discrepancy
Laboratory macro-stickie yield calculations routinely diverge from industrial mill-scale reject recovery figures. Test methods isolate contaminants under controlled, low-consistency, single-pass conditions with fresh water rinsing. Industrial stock preparation systems operate under continuous recycled water loops, high consistency ranges, fluctuating pressure differentials, and complex multi-stage screening cascades.
These process differences alter particle breakdown and screening efficiency.

Mechanical Slot Wear and Degradation
Physical screen plates experience continuous abrasion from inorganic fillers, sand, metal clips, and calcium carbonate loading contained in recycled pulp. Wear widens effective slot apertures over time, shifting the physical cut-off threshold. A nominal 0.15 millimeter screen plate worn to 0.18 millimeter permits significantly higher quantities of macro-stickies to pass into the accept stream, underreporting true raw material contamination levels during laboratory screening.
Mechanical wear increases effective slot width.
Optical calibration logs confirm that slot geometry shifts alter measured yield figures progressively across inspection cycles.
| Usage Cycles | Nominal Slot (mm) | Measured Slot (mm) | Edge Radius (mm) | Measured Yield Variance (%) |
|---|---|---|---|---|
| 0 (New) | 0.150 | 0.150 ± 0.003 | 0.005 | 0.0 (Baseline) |
| 250 | 0.150 | 0.158 ± 0.005 | 0.012 | -6.5 |
| 500 | 0.150 | 0.169 ± 0.008 | 0.024 | -14.2 |
| 1000 | 0.150 | 0.185 ± 0.012 | 0.041 | -28.8 |

Contaminant Breakdown and Process Failure Modes
Inconsistent screening results expose packaging buyers to unexpected converting failures and invalid recyclability declarations. When laboratory yields underrate stickie loads, papermaking lines experience severe operational disruptions, including press roll wrapping, wire blinding, and localized web breaks.
Reject mass correlates with stickie concentration.
- Shear Fragmentation occurs when high-speed disintegrators tear large pressure-sensitive adhesive labels into sub-100 micrometer particles, converting macro-stickies into unmeasurable micro-stickies.
- Thermal Softening happens when sample drying temperatures exceed adhesive glass transition points, flattening particles and driving them through screen slots under hydraulic pressure.
- Fiber Network Trapping occurs when excessively high slurry consistency creates a dense fiber mat over screen slots, preventing macro-stickies from contacting slot openings and inflating apparent retentate mass.
- Substrate Blinding develops when sticky synthetic materials coat transfer paper surfaces unevenly, creating dark shadows during optical scanning that trigger false thresholding calculations.
Discrepancies in test methodology raise fundamental questions about how certification schemes can establish uniform recyclability thresholds for paper-based packaging under modern European packaging waste regulations.
Exposure
Under the European Packaging and Packaging Waste Regulation (PPWR) and national Extended Producer Responsibility (EPR) fee modulation structures, packaging recyclability must be proven using standardized laboratory testing protocols. Recyclability claims printed on consumer packaging require verifiable technical documentation showing that adhesive layers, hot melts, and pressure-sensitive labels separate cleanly during standard repulping and screening operations without generating excessive macro-stickie contamination.
Deinking efficiency depends on slot width.
Packaging designs that generate macro-stickie levels exceeding established industry thresholds, such as 2000 square millimeters per kilogram of dry pulp under CEPI testing guidelines, face downgrading into lower recyclability performance classes. Lower performance classes trigger financial penalties, increased EPR fees, or outright bans from retail markets enforcing strict circular economy criteria. A commercial claim of 100 percent packaging recyclability unsupported by laboratory screen yield documentation leaves brand owners liable to regulatory enforcement action, product recalls, and greenwashing fines under consumer protection mandates.
Plate calibration logs prevent batch rejection.
A structured compliance file requires systematic verification of all incoming recycled pulp lots and finished packaging structures before issuing legal declarations of conformity.
- Plate Verification documents slot dimensions using optical micrometers prior to sample screening.
- Temperature Logs confirm repulping and washing water remain strictly below 22 degrees Celsius throughout the fractionating sequence.
- Image Thresholding Records archive raw binary image files alongside calculated square millimeter yields for every tested lot.
- Transfer Efficiency Audits verify complete removal of cellulosic fiber from stickie surfaces prior to digital scanning.
- Third-Party Test Reports attach accredited laboratory certificates citing exact standards, slot widths, and sample conditioning values to every commercial specification file.
Oversized particles block downstream conversion steps.
Failure to mandate maximum allowable macro-stickie area yields within raw material supply contracts voids supplier warranty claims when contaminated pulp stock causes paper machine downtime or converted packaging rejection.