In Line Stress Wave Frequency Analysis for Paperboard Delamination Detection
Inline stress wave frequency analysis isolates paperboard micro-delamination at high speeds by detecting attenuation drops and dynamic resonant shifts.

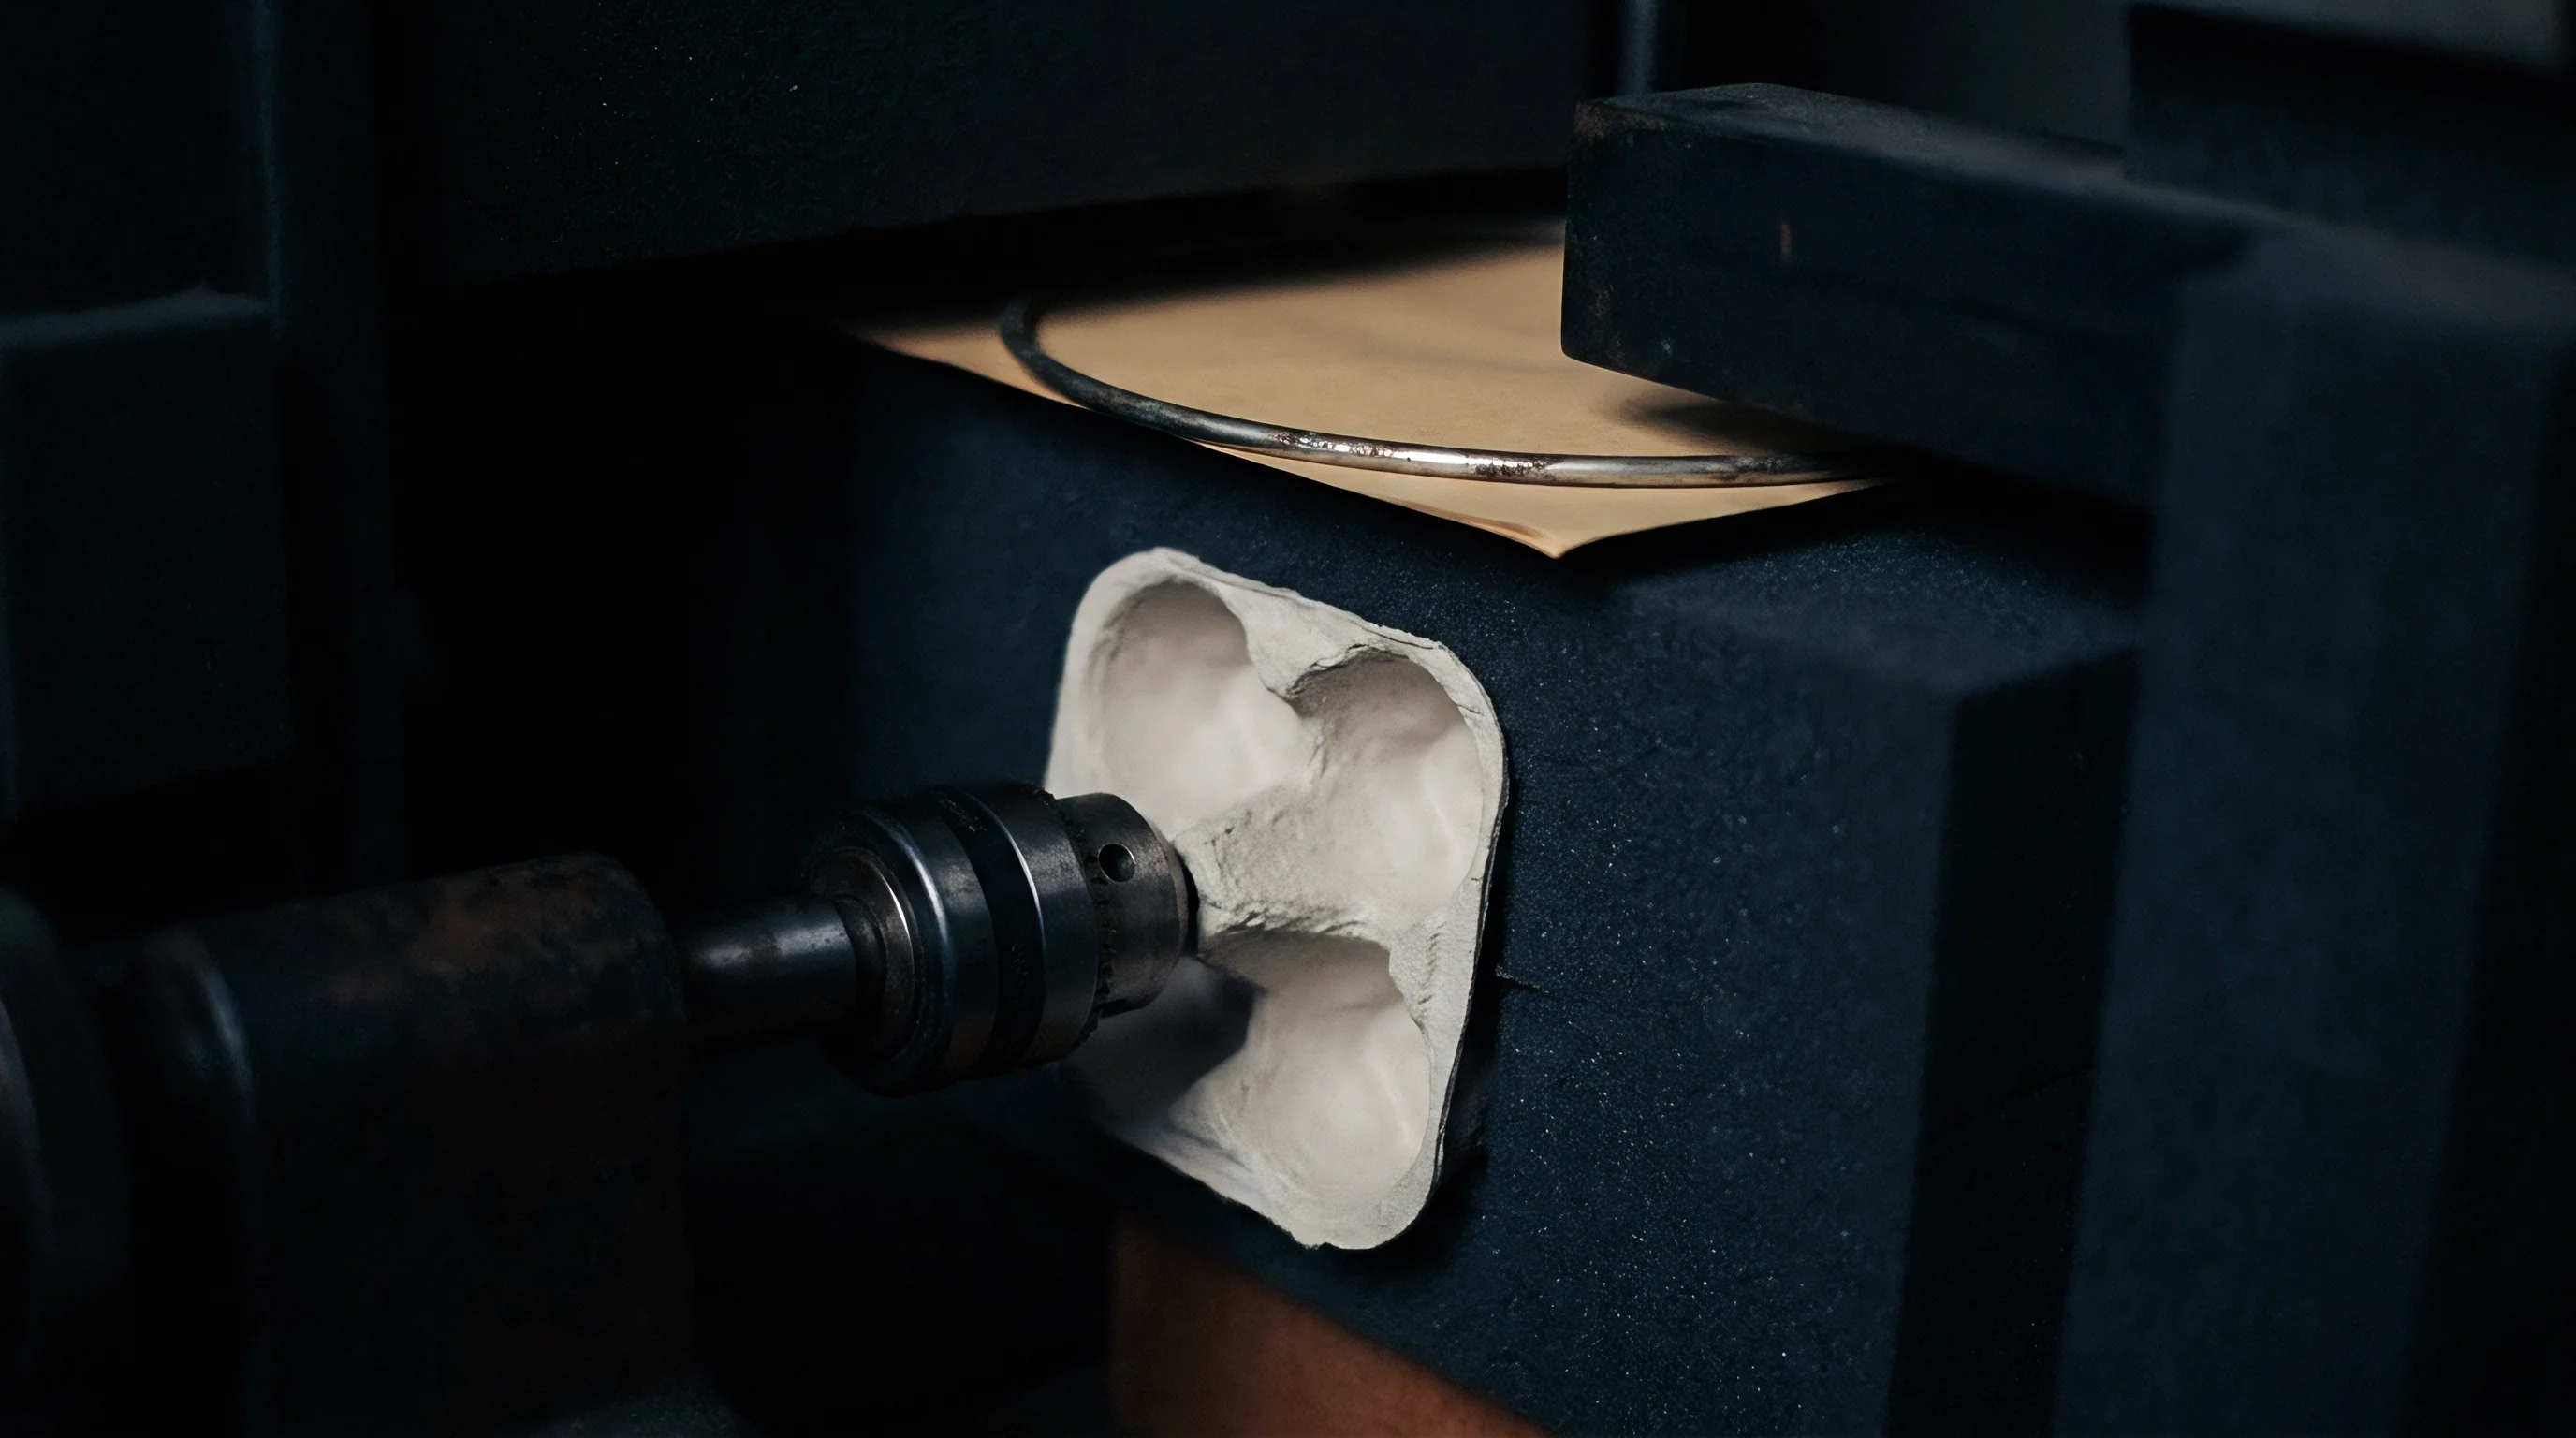
Pulse
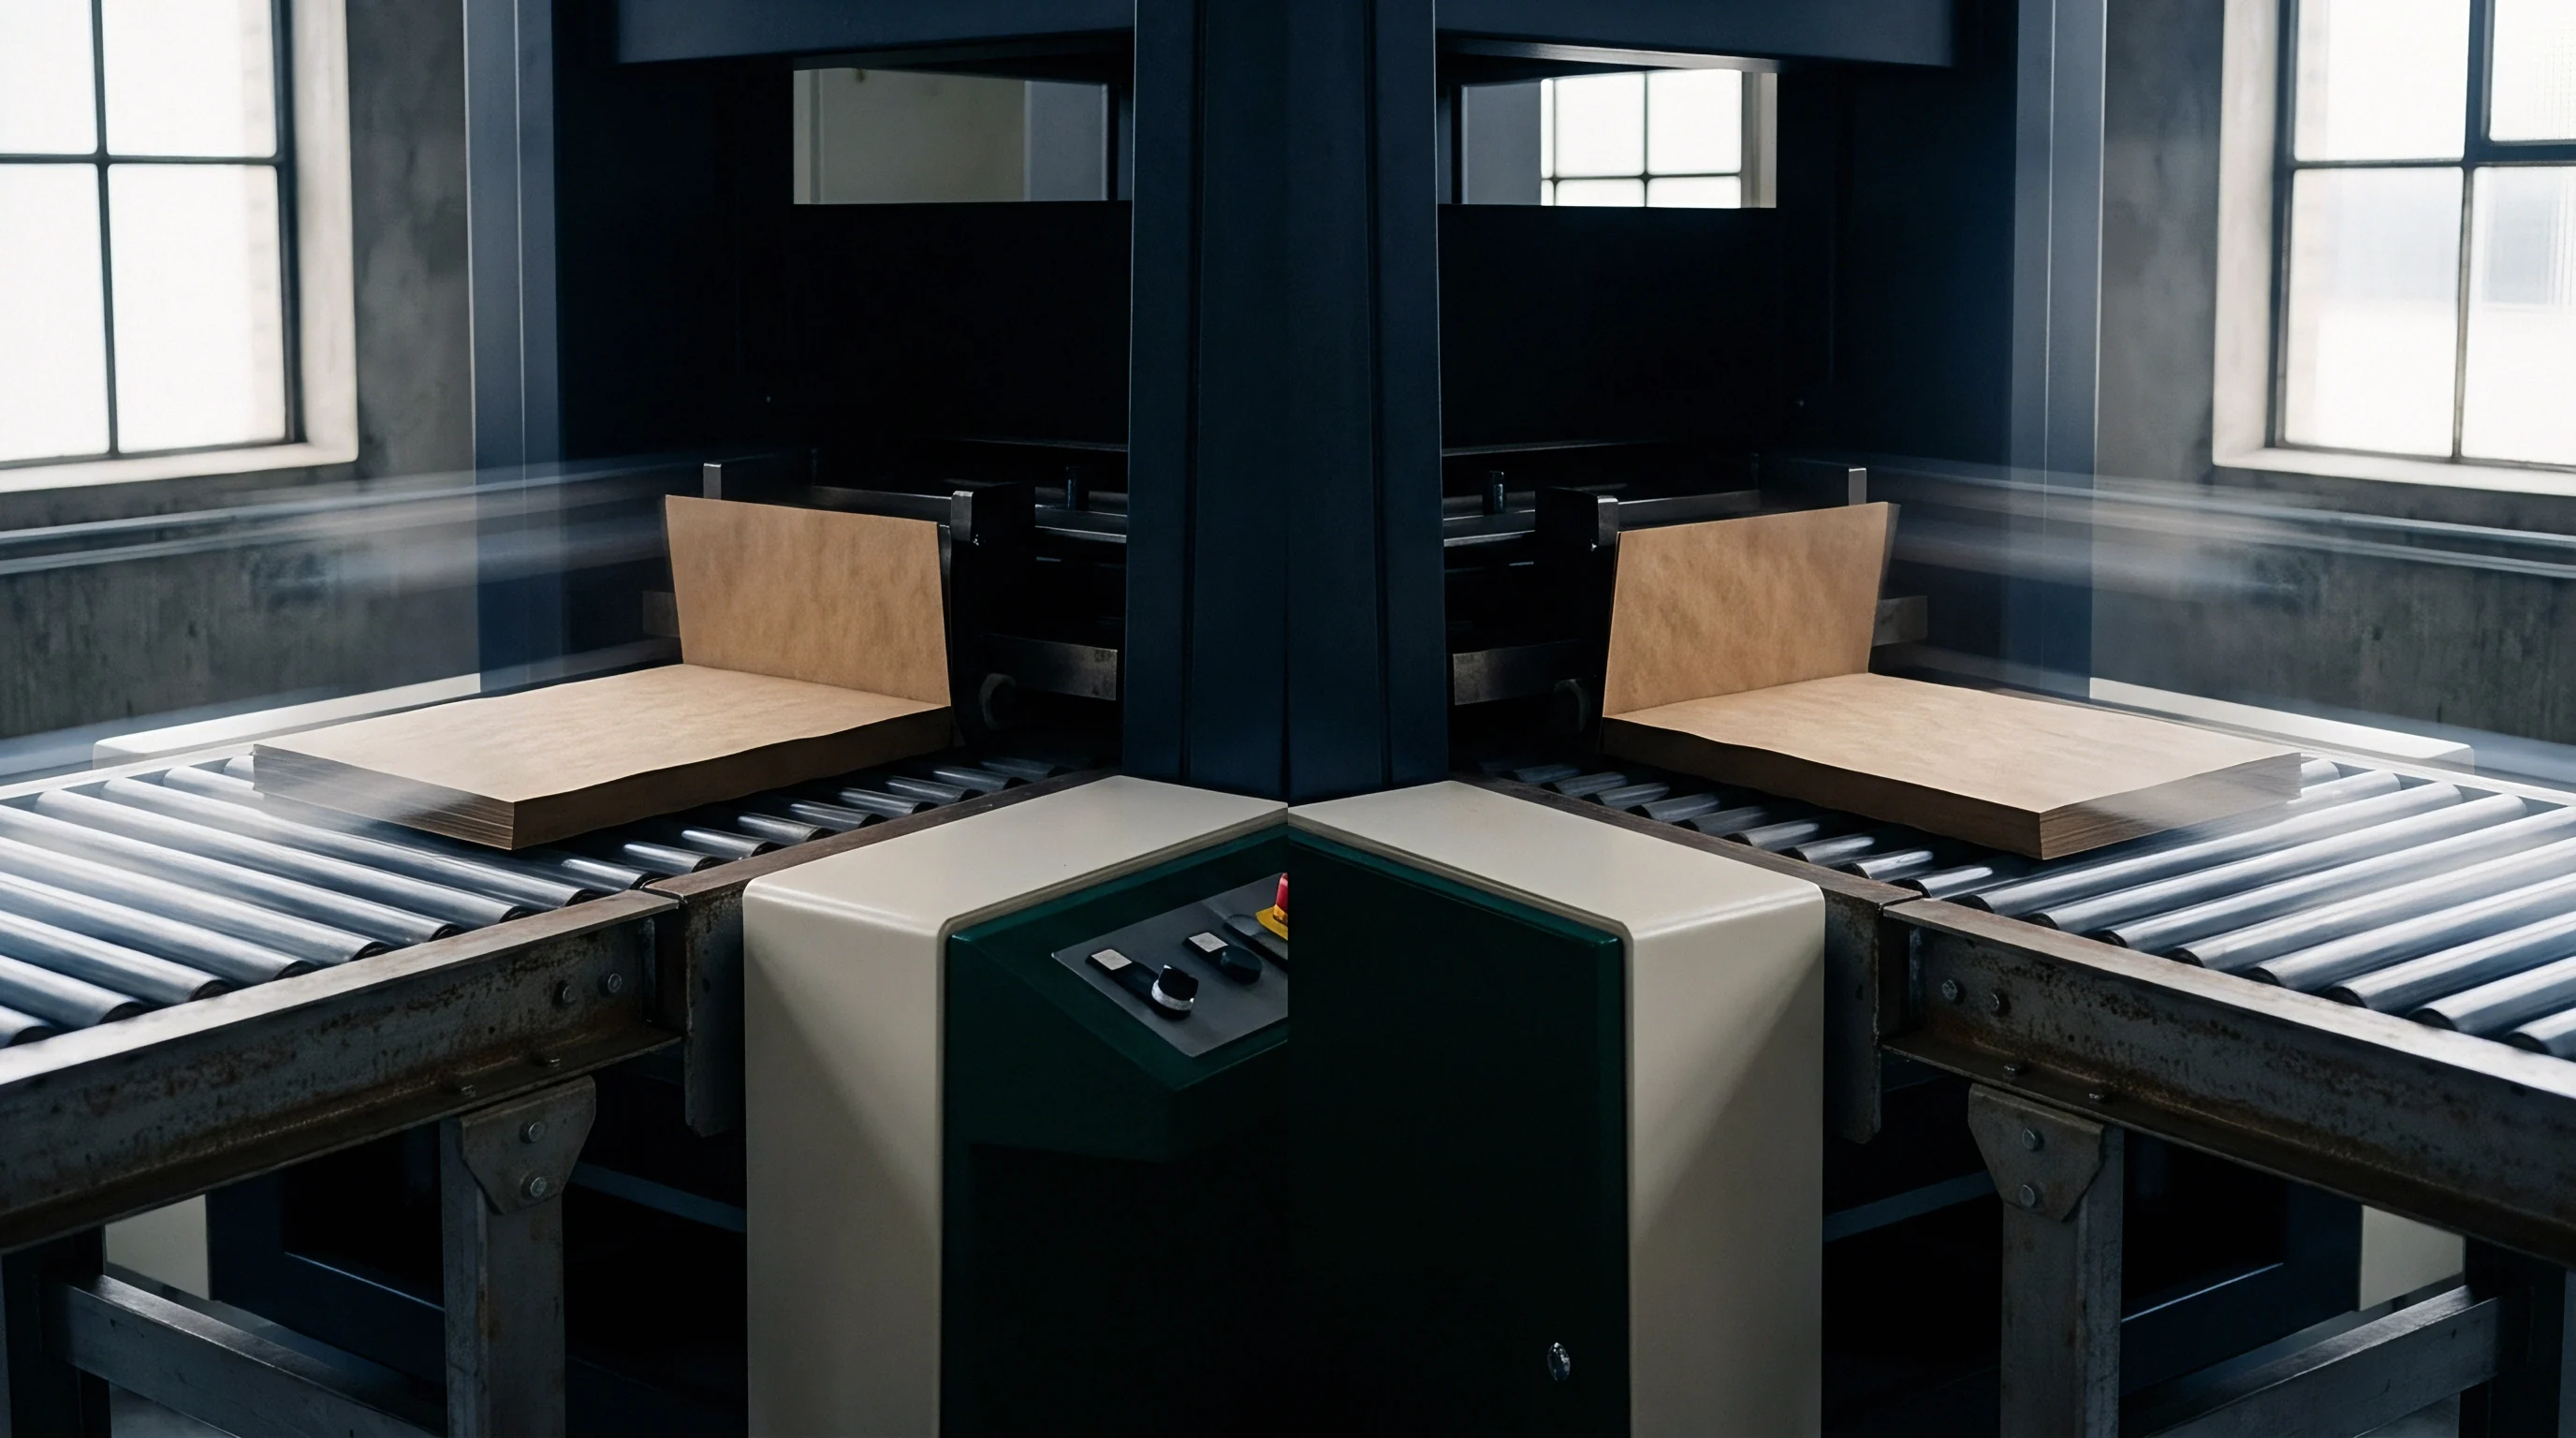
Transient Elastic Waves in Multi-Ply Fiber Networks
In-line stress wave analysis relies on introducing low-amplitude elastic disturbances into a moving paperboard web and capturing the resultant acoustic propagation across the sheet thickness. When a mechanical strike or non-contact thermoacoustic pulse impacts the board surface, stress waves propagate as compression waves, shear waves, and surface Rayleigh waves. High-speed multi-ply folding boxboard (FBB) and solid bleached sulfate (SBS) possess highly anisotropic mechanical properties, with elastic modulus in the machine direction exceeding the Z-directional modulus by factors of ten to twenty.
Acoustic wave velocity through the board thickness correlates directly with the out-of-plane dynamic stiffness, determined by fiber orientation, refining degree, and inter-ply starch adhesion.
Delamination introduces a discontinuous acoustic impedance boundary inside the sheet structure. Under normal conditions, an acoustic pulse travels through homogeneous or continuously graded fiber plies, reflecting predictably off the back surface. Internal ply separation creates an air-gap interface that reflects nearly one hundred percent of the acoustic wave energy back to the transmitting surface, blocking transmission to the opposing side and setting up localized resonant entrapment.
Detecting this interface failure requires capturing changes in wave phase velocity and resonant attenuation at millisecond time scales while the web moves at operational converting speeds up to 600 meters per minute.
Discontinuous impedance boundaries within multi-ply structures reflect acoustic energy before wave energy reaches the back surface.

In-Plane versus Out-of-Plane Propagation Paths
Wave modes separate inside anisotropic paperboard based on excitation geometry and receiver placement. In-plane stress wave propagation measures longitudinal stiffness and tension variations along the machine and cross directions. Delamination detection relies on Z-directional compression and shear wave reflections, where transmission distance spans only the caliper of the sheet, typically between 200 and 800 micrometers.
At these microscopic path lengths, acoustic wave transit time through sound board ranges from 100 to 400 nanoseconds, demanding receiver sampling rates exceeding 50 megahertz to resolve wave reflections from individual ply boundaries.
High-frequency energy dissipates rapidly within fiber networks due to viscoelastic damping from cellulose fibers and synthetic binder additives. As moisture content rises or sheet density drops, acoustic attenuation increases exponentially. Distinguishing between normal viscoelastic signal decay and delamination-induced energy loss requires continuous frequency-domain monitoring.
When a delamination defect passes beneath the sensor head, the high-frequency spectral components of the transmitted stress wave drop sharply while localized lower-frequency resonance peaks emerge from the decoupled upper ply vibrating independently.
Failure to register internal ply separation during primary web converting allows defective board to enter high-speed die-cutting and lamination passes. Undetected micro-delamination splits completely under the mechanical shear of scoring matrixes, resulting in blister-outs, jam-ups on folder-gluers, and mass rejections of finished packaging lots.
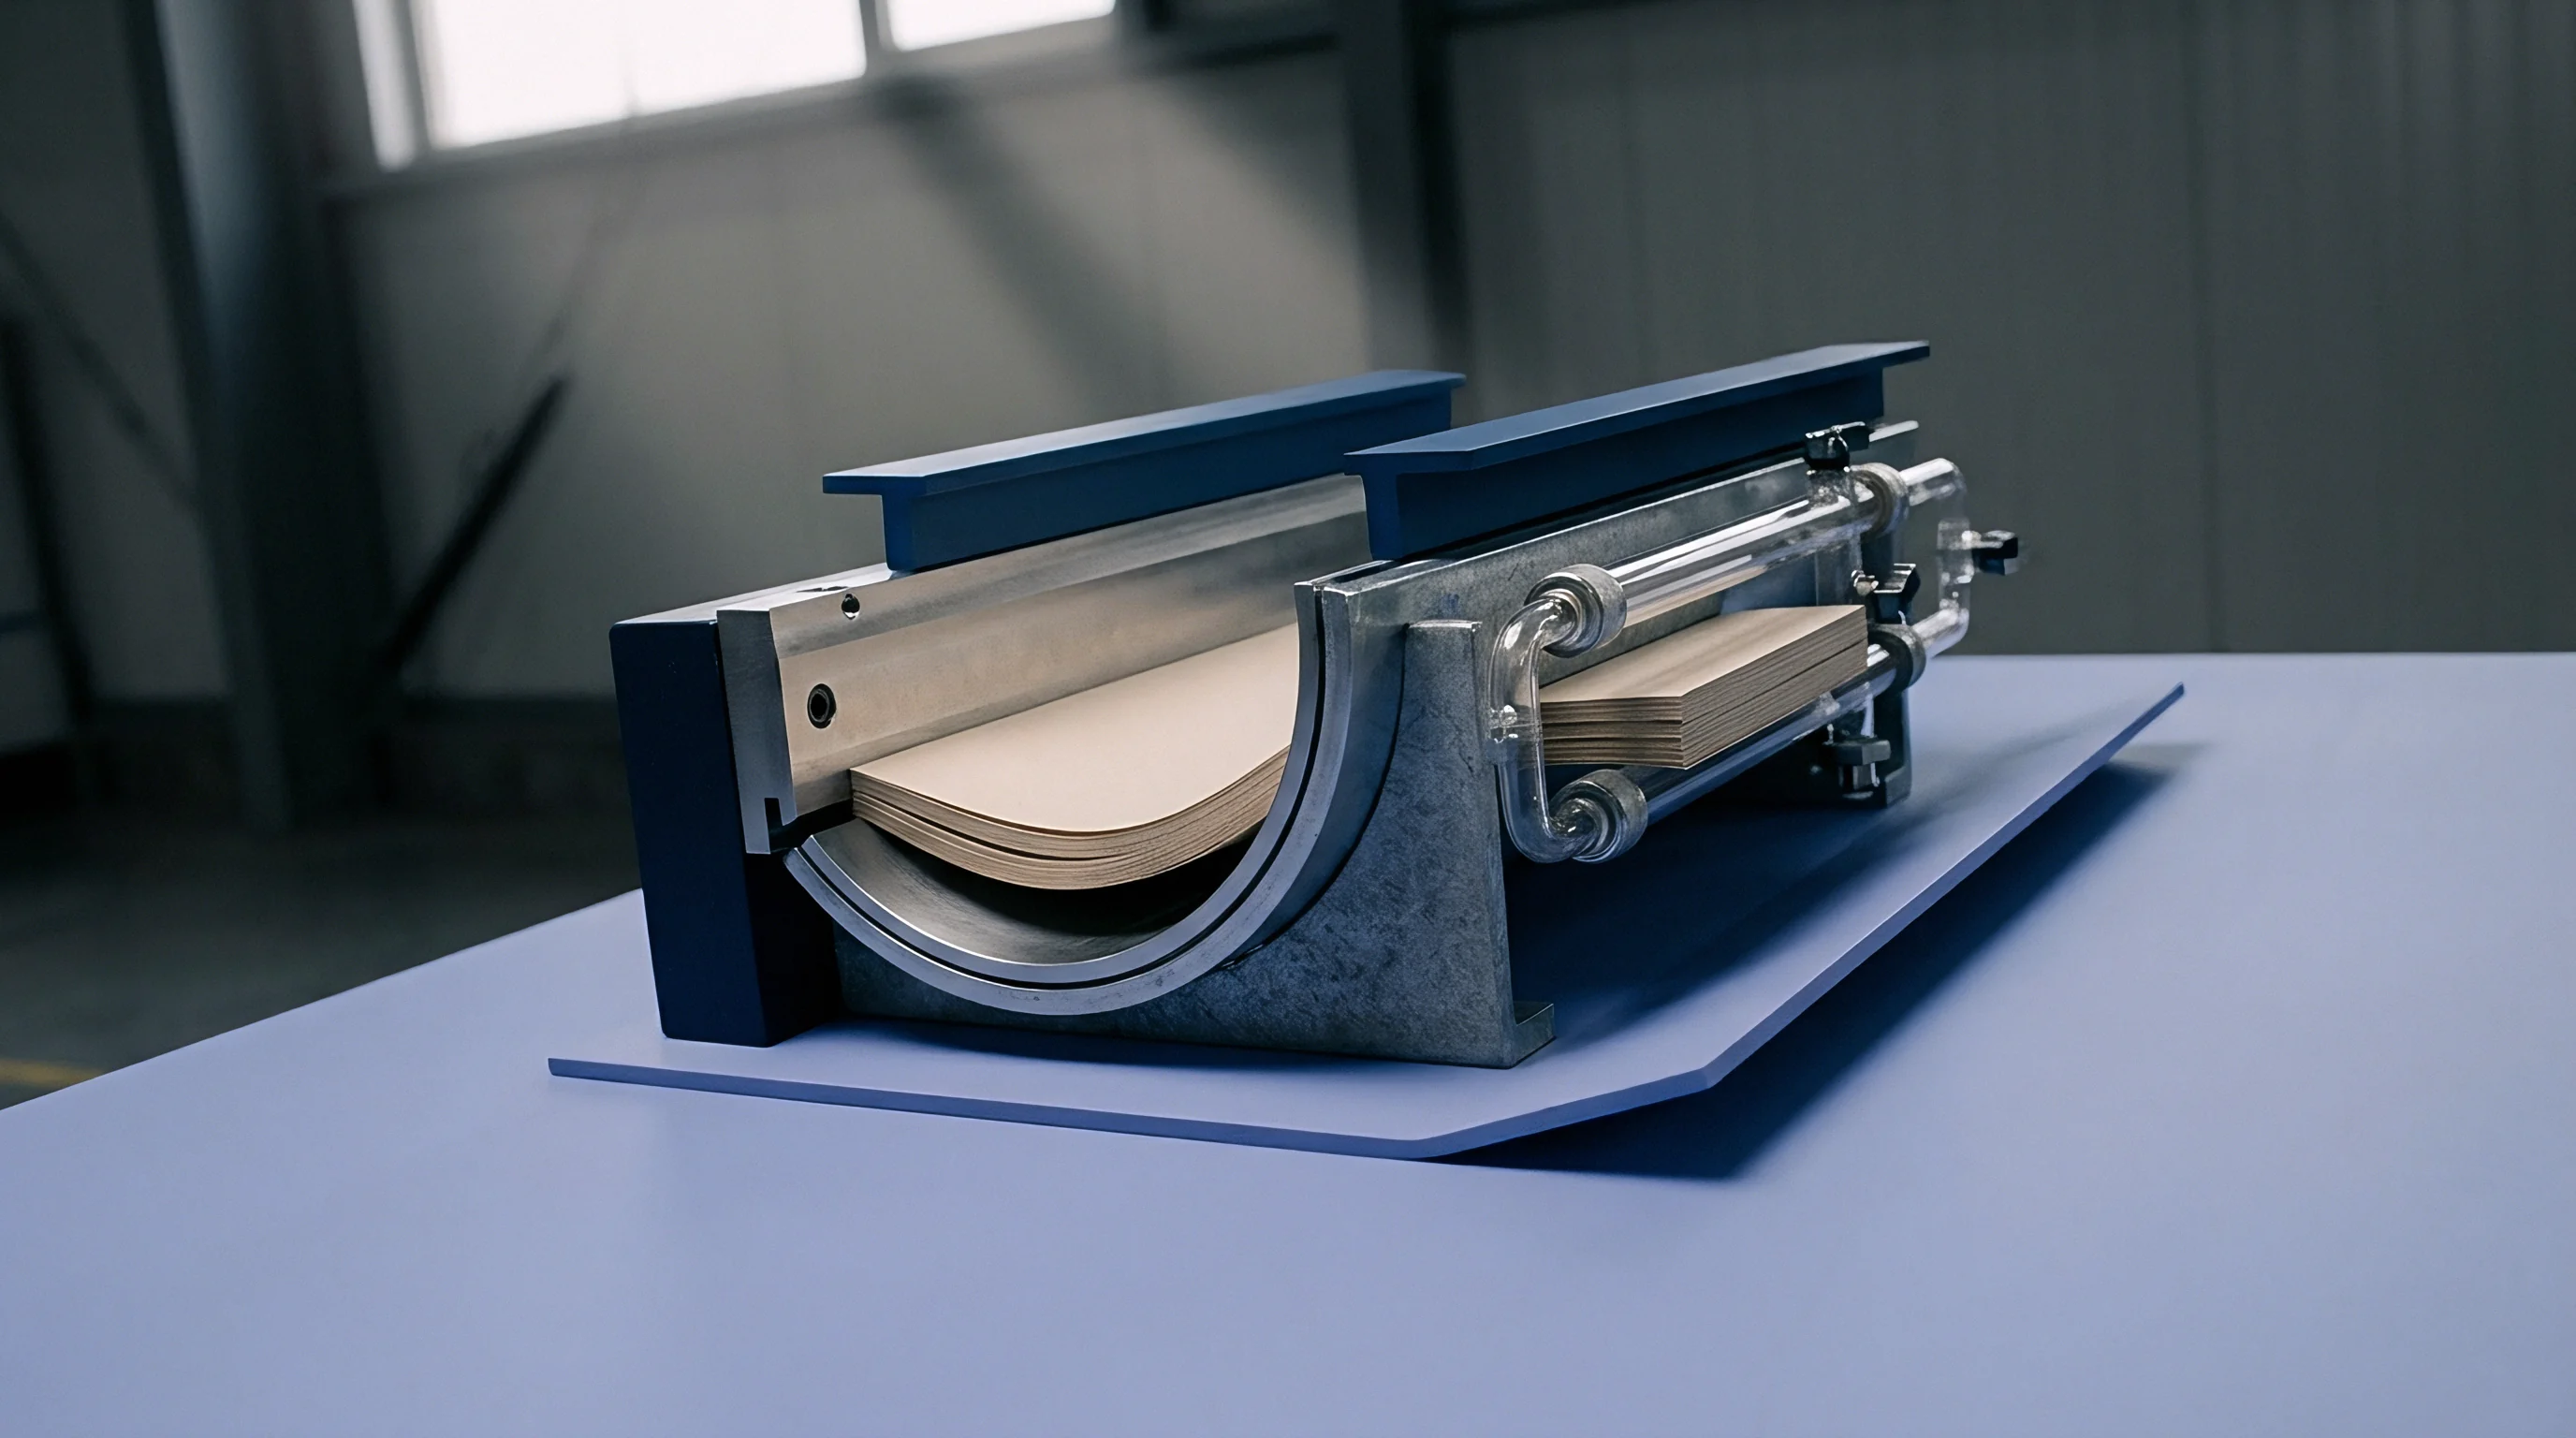
Resonance

Transducer Selection and Web Coupling Architecture
Continuous acoustic measurement on high-speed paperboard machines presents immediate physical coupling challenges. Physical contact transducers using piezoelectric elements mounted on dry-contact rolling wheels maintain direct mechanical link to the moving web. These rolling contact transducers eliminate air attenuation but introduce mechanical vibration noise from roller bearings, web surface roughness variations, and wheel-bounce at web speeds above 300 meters per minute.
Non-contact Air-Coupled Ultrasonic Transducers (ACUT) eliminate mechanical wear and surface scratching, utilizing focused piezoceramic or micro-machined capacitive elements operating across narrow transmission channels.
Air exhibits an acoustic impedance of approximately 400 Rayleighs, whereas dense paperboard plies range from 1.5 to 3.0 MegaRayleighs. This severe impedance mismatch reflects more than 99.8 percent of acoustic energy at the air-paperboard interfaces. Non-contact ACUT systems overcome this energy loss by using specialized impedance-matching silicone elastomer or porous ceramic coatings on the transducer faces, combined with high-voltage excitation pulses reaching 400 to 800 volts.
Signal-to-noise performance hinges on filtering low-frequency aerodynamic rumble generated by the boundary air layer traveling along the accelerated web surface.
Coupling modes and signal delivery mechanisms vary across inline hardware configurations, each exhibiting specific operating thresholds and mechanical limitations.
- Dry rolling contact wheels utilize resilient polyurethane tires encasing central piezoelectric crystals to maintain continuous physical pressure against the running web, achieving low insertion loss at moderate line speeds.
- Air-coupled ultrasonic pairs operate in pitch-catch alignment across an open web gap, transmitting acoustic energy through compressed air columns to eliminate sheet marking entirely.
- Laser thermoacoustic excitation fires nanosecond laser pulses directly onto the moving board surface to generate instantaneous thermoelastic stress waves without physical mechanical contact.
- Non-contact electrostatic transducers establish high-voltage capacitive fields between the sensor face and grounded conductive backing rolls to detect minute surface displacement shifts.
| Paperboard Grade | Nominal Caliper (μm) | Z-Direction Wave Velocity (m/s) | Dominant Resonant Band (kHz) | Attenuation Rate (dB/mm) |
|---|---|---|---|---|
| Solid Bleached Sulfate (SBS) | 350 | 1850 – 2200 | 120 – 180 | 18 – 24 |
| Folding Boxboard (FBB) | 450 | 1200 – 1600 | 80 – 130 | 28 – 36 |
| White Lined Chipboard (WLC) | 500 | 950 – 1350 | 60 – 100 | 35 – 48 |
| Coated Unbleached Kraft (CUK) | 400 | 1650 – 2000 | 100 – 150 | 22 – 30 |
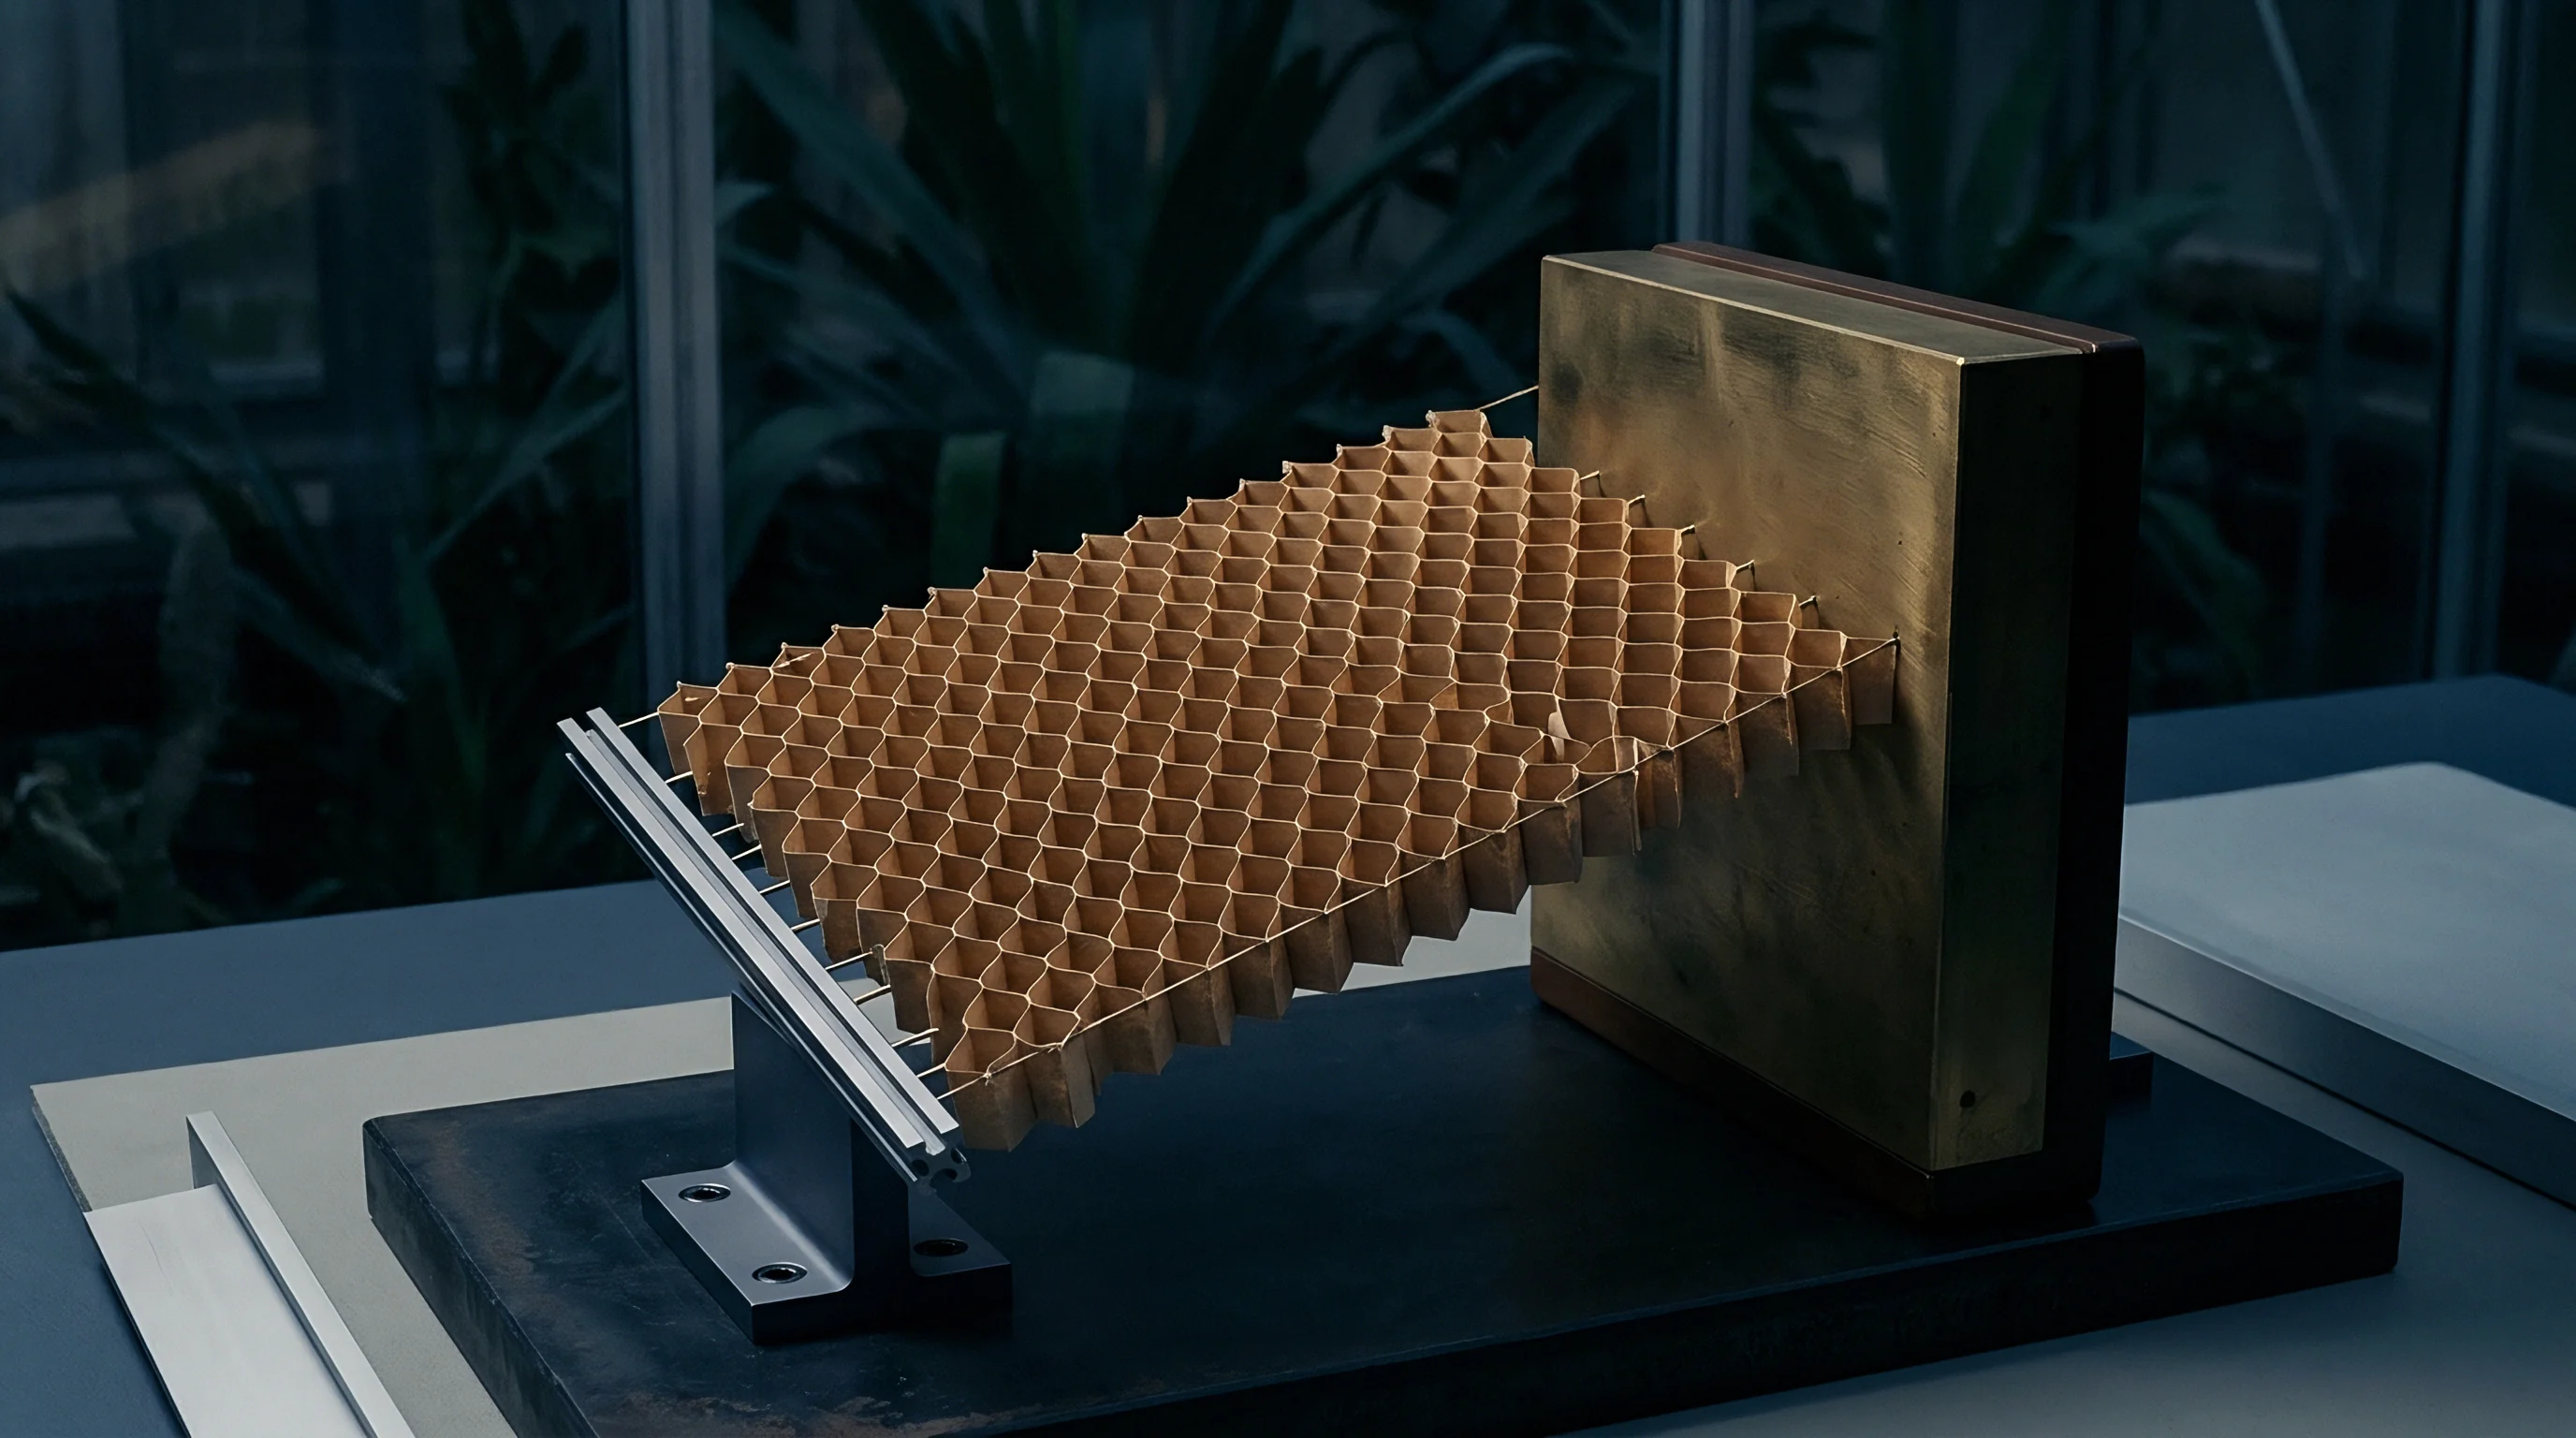
Frequency Shifts and Phase Angle Analysis
Analyzing stress waves in the frequency domain transforms complex time-domain waveforms into distinct spectral signatures. Healthy board plies display a characteristic fundamental structural resonance determined by total sheet thickness and bulk dynamic modulus. When an internal delamination occurs, the effective load-bearing thickness of the board section decreases instantly to the thickness of the detached upper ply.
According to acoustic wave theory, fundamental resonant frequency scales inversely with layer thickness. A half-thickness ply separation doubles the observed fundamental resonant frequency of the reflected wave while attenuating the signal transmitted completely through the sheet.
Phase angle evaluation provides additional sensitivity to partial micro-delamination where fiber webs remain loosely intertwined but lack internal bond shear strength. Sound board exhibits stable phase relationship between transmitted and received signals across fixed sensor gaps. Micro-flaws introduce phase lag and broadens signal phase distribution due to multiple wave reflections scattering off non-planar fracture surfaces within the core plies.
Phase shift thresholds identify weak inter-ply bonding before complete structural separation occurs downstream.
Subcontract converters frequently attribute post-print blisters to localized coating moisture spikes rather than structural ply failure. Laboratory frequency scans prove that moisture variations alter absolute wave velocity smoothly across meters of web, whereas ply delamination produces step-change frequency jumps within millimeters of web travel.


Structure
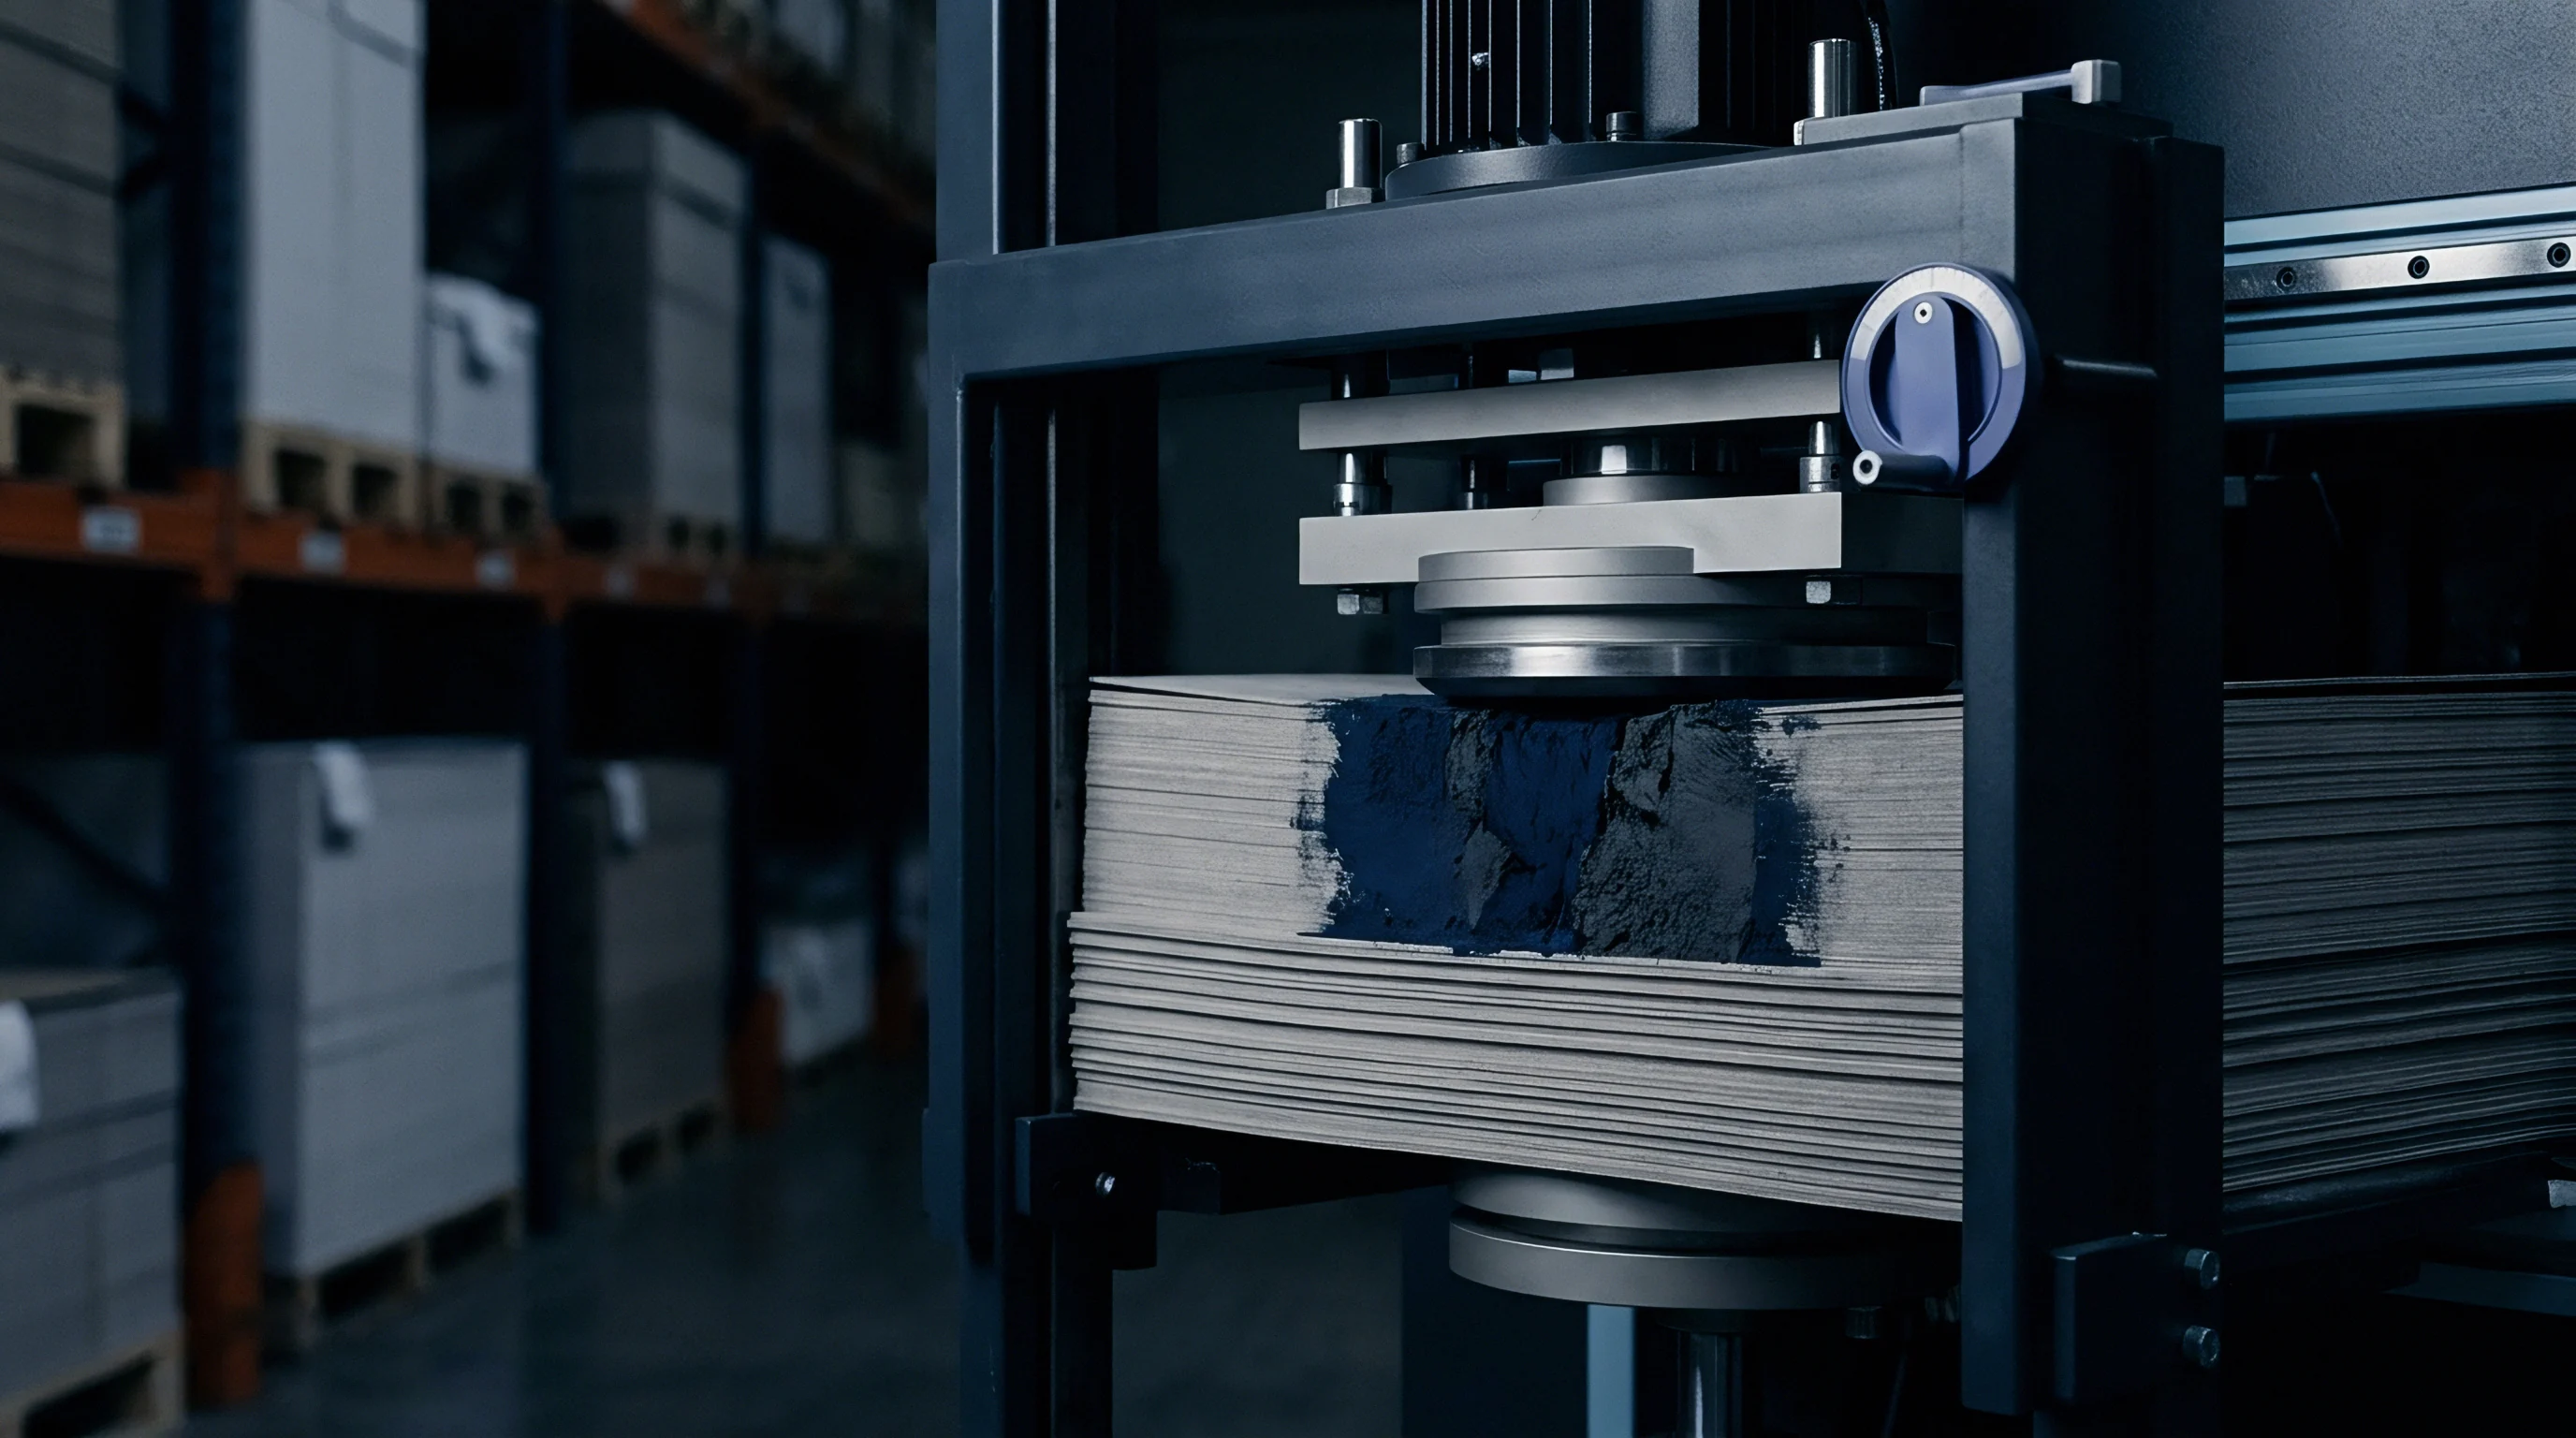
Fiber Matrix Anisotropy and Z-Direction Bond Physics
Paperboard plies are formed sequentially on multi-former wet ends, joining wet fiber webs under mechanical vacuum and press nip pressure. Inter-ply bonding relies on hydrogen bonds forming between cellulose fibrils, reinforced by cooked native or cationic starch sprayed between wet plies before press consolidation. The internal bond strength, measured statically via the Scott Bond test (ISO 16254), reflects the energy absorbed when splitting a board sample along its weakest Z-directional plane.
High-speed stress wave analysis offers non-destructive dynamic mapping that correlates directly with static Scott Bond values across the web area.
Fiber orientation angles within individual plies alter the directional dispersion of stress waves. Mechanical refining increases fiber swelling and fibrillation, raising internal contact area and density, which accelerates acoustic wave velocity. Conversely, high filler content, such as calcium carbonate or clay mixed into middle plies of recycled grades, reduces inter-fiber contact points.
Lower fiber-to-fiber bonding drops the Z-directional dynamic modulus, slowing wave propagation speeds and shifting the baseline structural resonance toward lower frequency bands.
At an equilibrium moisture content of 50 percent relative humidity, a drop in dynamic Z-directional modulus below 1.2 Gigapascals indicates immediate loss of inter-ply shear integrity.

Mechanical Breakdown Sequence under Shear Strain
Under operational converted loads, sheet delamination follows a distinct mechanical progression driven by internal stress concentration during drying, curling, and matrix scoring passes.
- Micro-void formation initiates within low-density core plies or poorly gelled inter-ply starch boundaries during thermal drying stress.
- Transverse shear stresses generated in calendering or lamination nips propagate micro-voids along weak fiber-matrix interfaces.
- Adjacent micro-voids coalesce under cyclic flexing, forming continuous planar cracks that sever hydrogen bonding networks.
- Complete physical separation decouples adjacent fiber plies, creating trapped air pockets that halt out-of-plane acoustic wave transmission.
Starch gelation failures during board manufacture create latent delamination zones that survive reel winding but fail during high-speed scoring. When scoring matrix rules compress board stock, sound board deforms plastically along engineered score lines. Board containing latent starch defects splits along internal ply boundaries across the score line, destroying crease hinge stiffness and preventing automated carton erection.
A simple operational rule holds true: if the Z-direction acoustic velocity drops by more than fifteen percent across a narrow cross-machine section, internal ply separation has already initiated within the core plies.

Spectrum

Real-Time Fast Fourier and Wavelet Transforms
Converting raw stress wave signals into actionable line-speed defect maps requires immediate digital signal processing. Time-domain signals captured by high-speed analog-to-digital converters undergo real-time Fast Fourier Transform (FFT) processing inside field-programmable gate arrays (FPGAs). Standard FFT methods average spectral content over fixed time windows, which can smear short transient events caused by localized micro-delamination defects measuring under two millimeters in diameter.
Continuous Wavelet Transform (CWT) algorithms overcome this limitation by analyzing time and frequency domains simultaneously, using scale-shifted mother wavelets to detect sudden phase and amplitude variations with sub-millisecond precision.
Signal processing pipelines apply bandpass filters to isolate structural board resonance frequencies from background machine noise. Mechanical vibration from press gears, drying cylinder bearings, and air blowers occupies low-frequency spectra below 20 kilohertz. Electromagnetic drive noise sits in narrow, predictable bands.
The acoustic signature of paperboard delamination lives higher up, between 50 kilohertz and 400 kilohertz, where environmental mill noise exhibits minimal interference.

What Spectral Band Reveals Starch Bond Failure?
Inter-ply starch bond failure shows up predominantly between 120 kilohertz and 220 kilohertz as a distinct reduction in transmission energy coupled with fundamental harmonic splitting. Sound inter-ply starch layers produce a single focused transmission peak. Partial starch spray nozzle blockages create weak bond zones that scatter the primary peak into multiple low-amplitude sidebands, signalling reduced shear strength before physical separation occurs.

Threshold Determination and Reject Signal Mapping
Establishing operational reject thresholds requires balancing defect sensitivity against false-positive reel flags. Sensor processing software calculates a running baseline of spectral density across sound board sections, establishing dynamic upper and lower control limits based on three-sigma statistical variance. When a transient signal breaches the lower attenuation boundary for longer than a specified duration, the system registers a delamination event and sends positioning triggers to automatic spray markers or web rejection gates.
The operational protocol for inline signal calibration demands clear parameter definitions and documented acceptance boundaries:
- Baseline spectral calibration records acoustic transmission characteristics across ten meters of known defect-free board at full production speed.
- Noise floor isolation measures ambient acoustic energy with transducers active while web motion stops, setting lower limit digital filters.
- Attenuation boundary trigger flags any continuous spectral energy drop exceeding 6 dB within the 100 to 250 kHz band spanning a web distance greater than 5 millimeters.
- Positional defect logging syncs signal drop events with encoder pulse counts to mark precise longitudinal and lateral defect positions on roll map files.
Under ISO 12647-1 print workflow standards and mill quality specifications, quality assurance clauses state that any continuous reel length exhibiting more than three delamination triggers per thousand meters permits immediate rejection of the entire mill roll by the buyer.
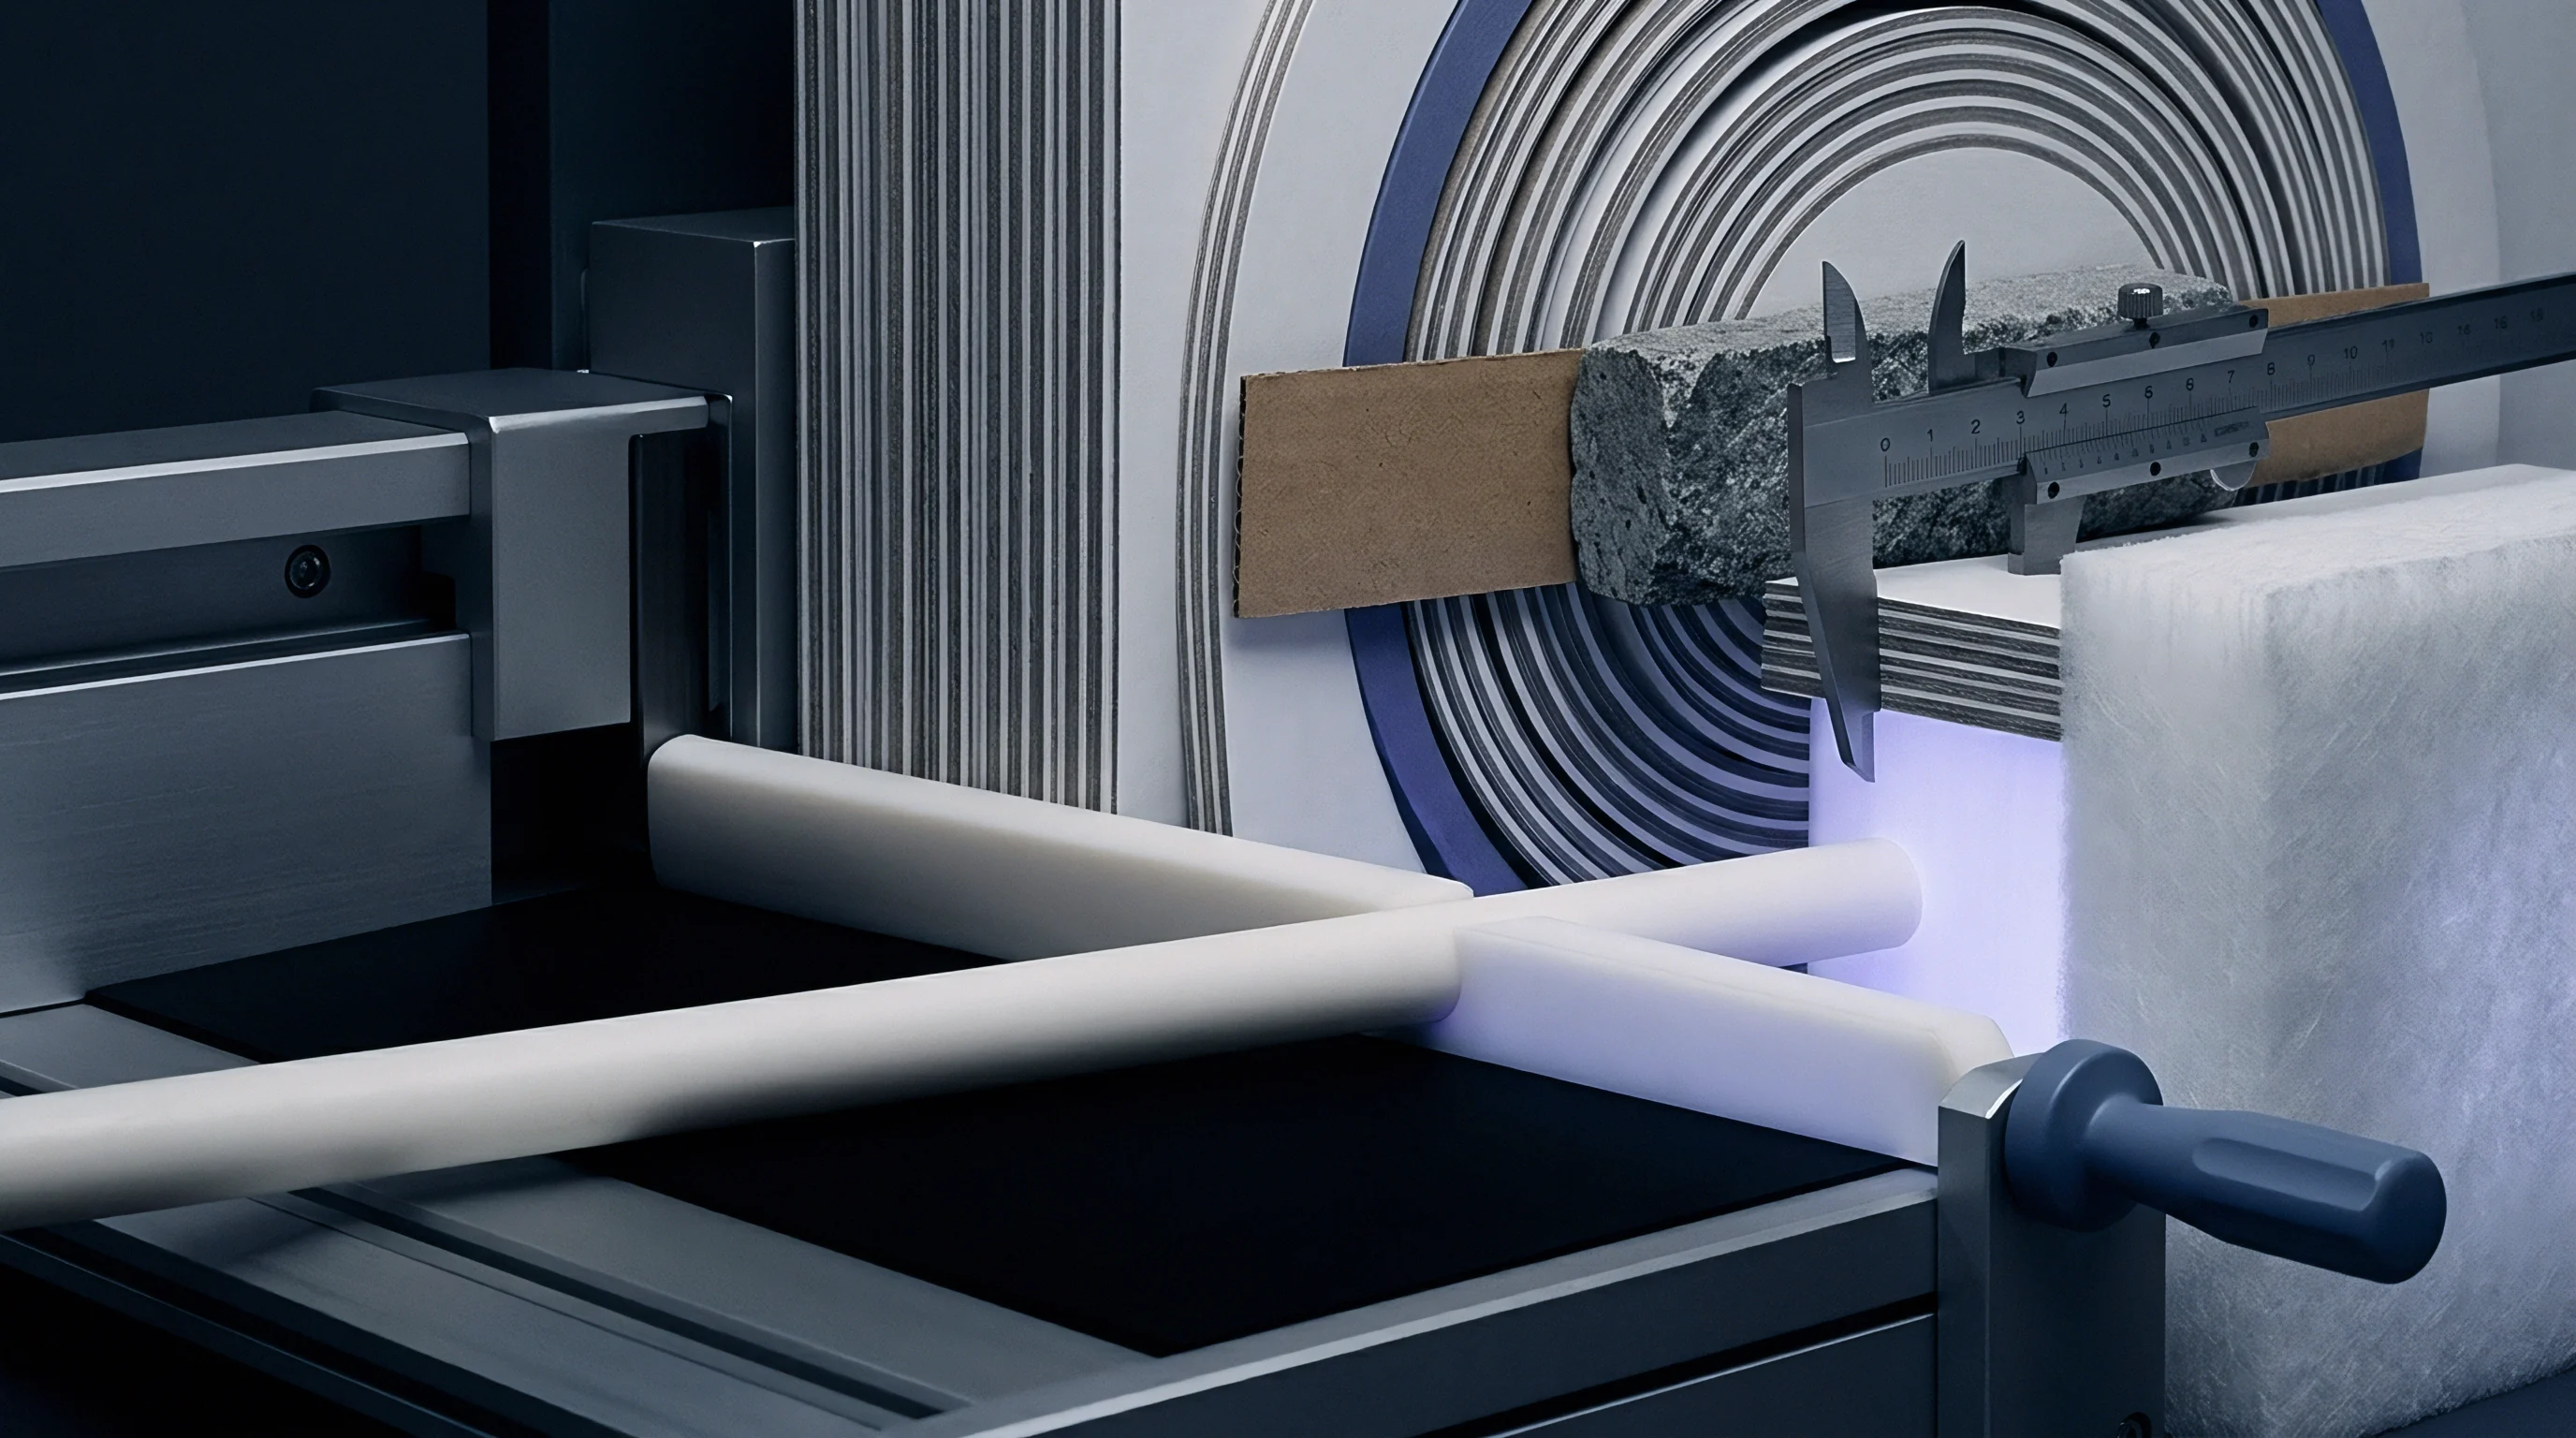
Laminate

Acoustic Impedance in Multi-Pass Surface Finishes
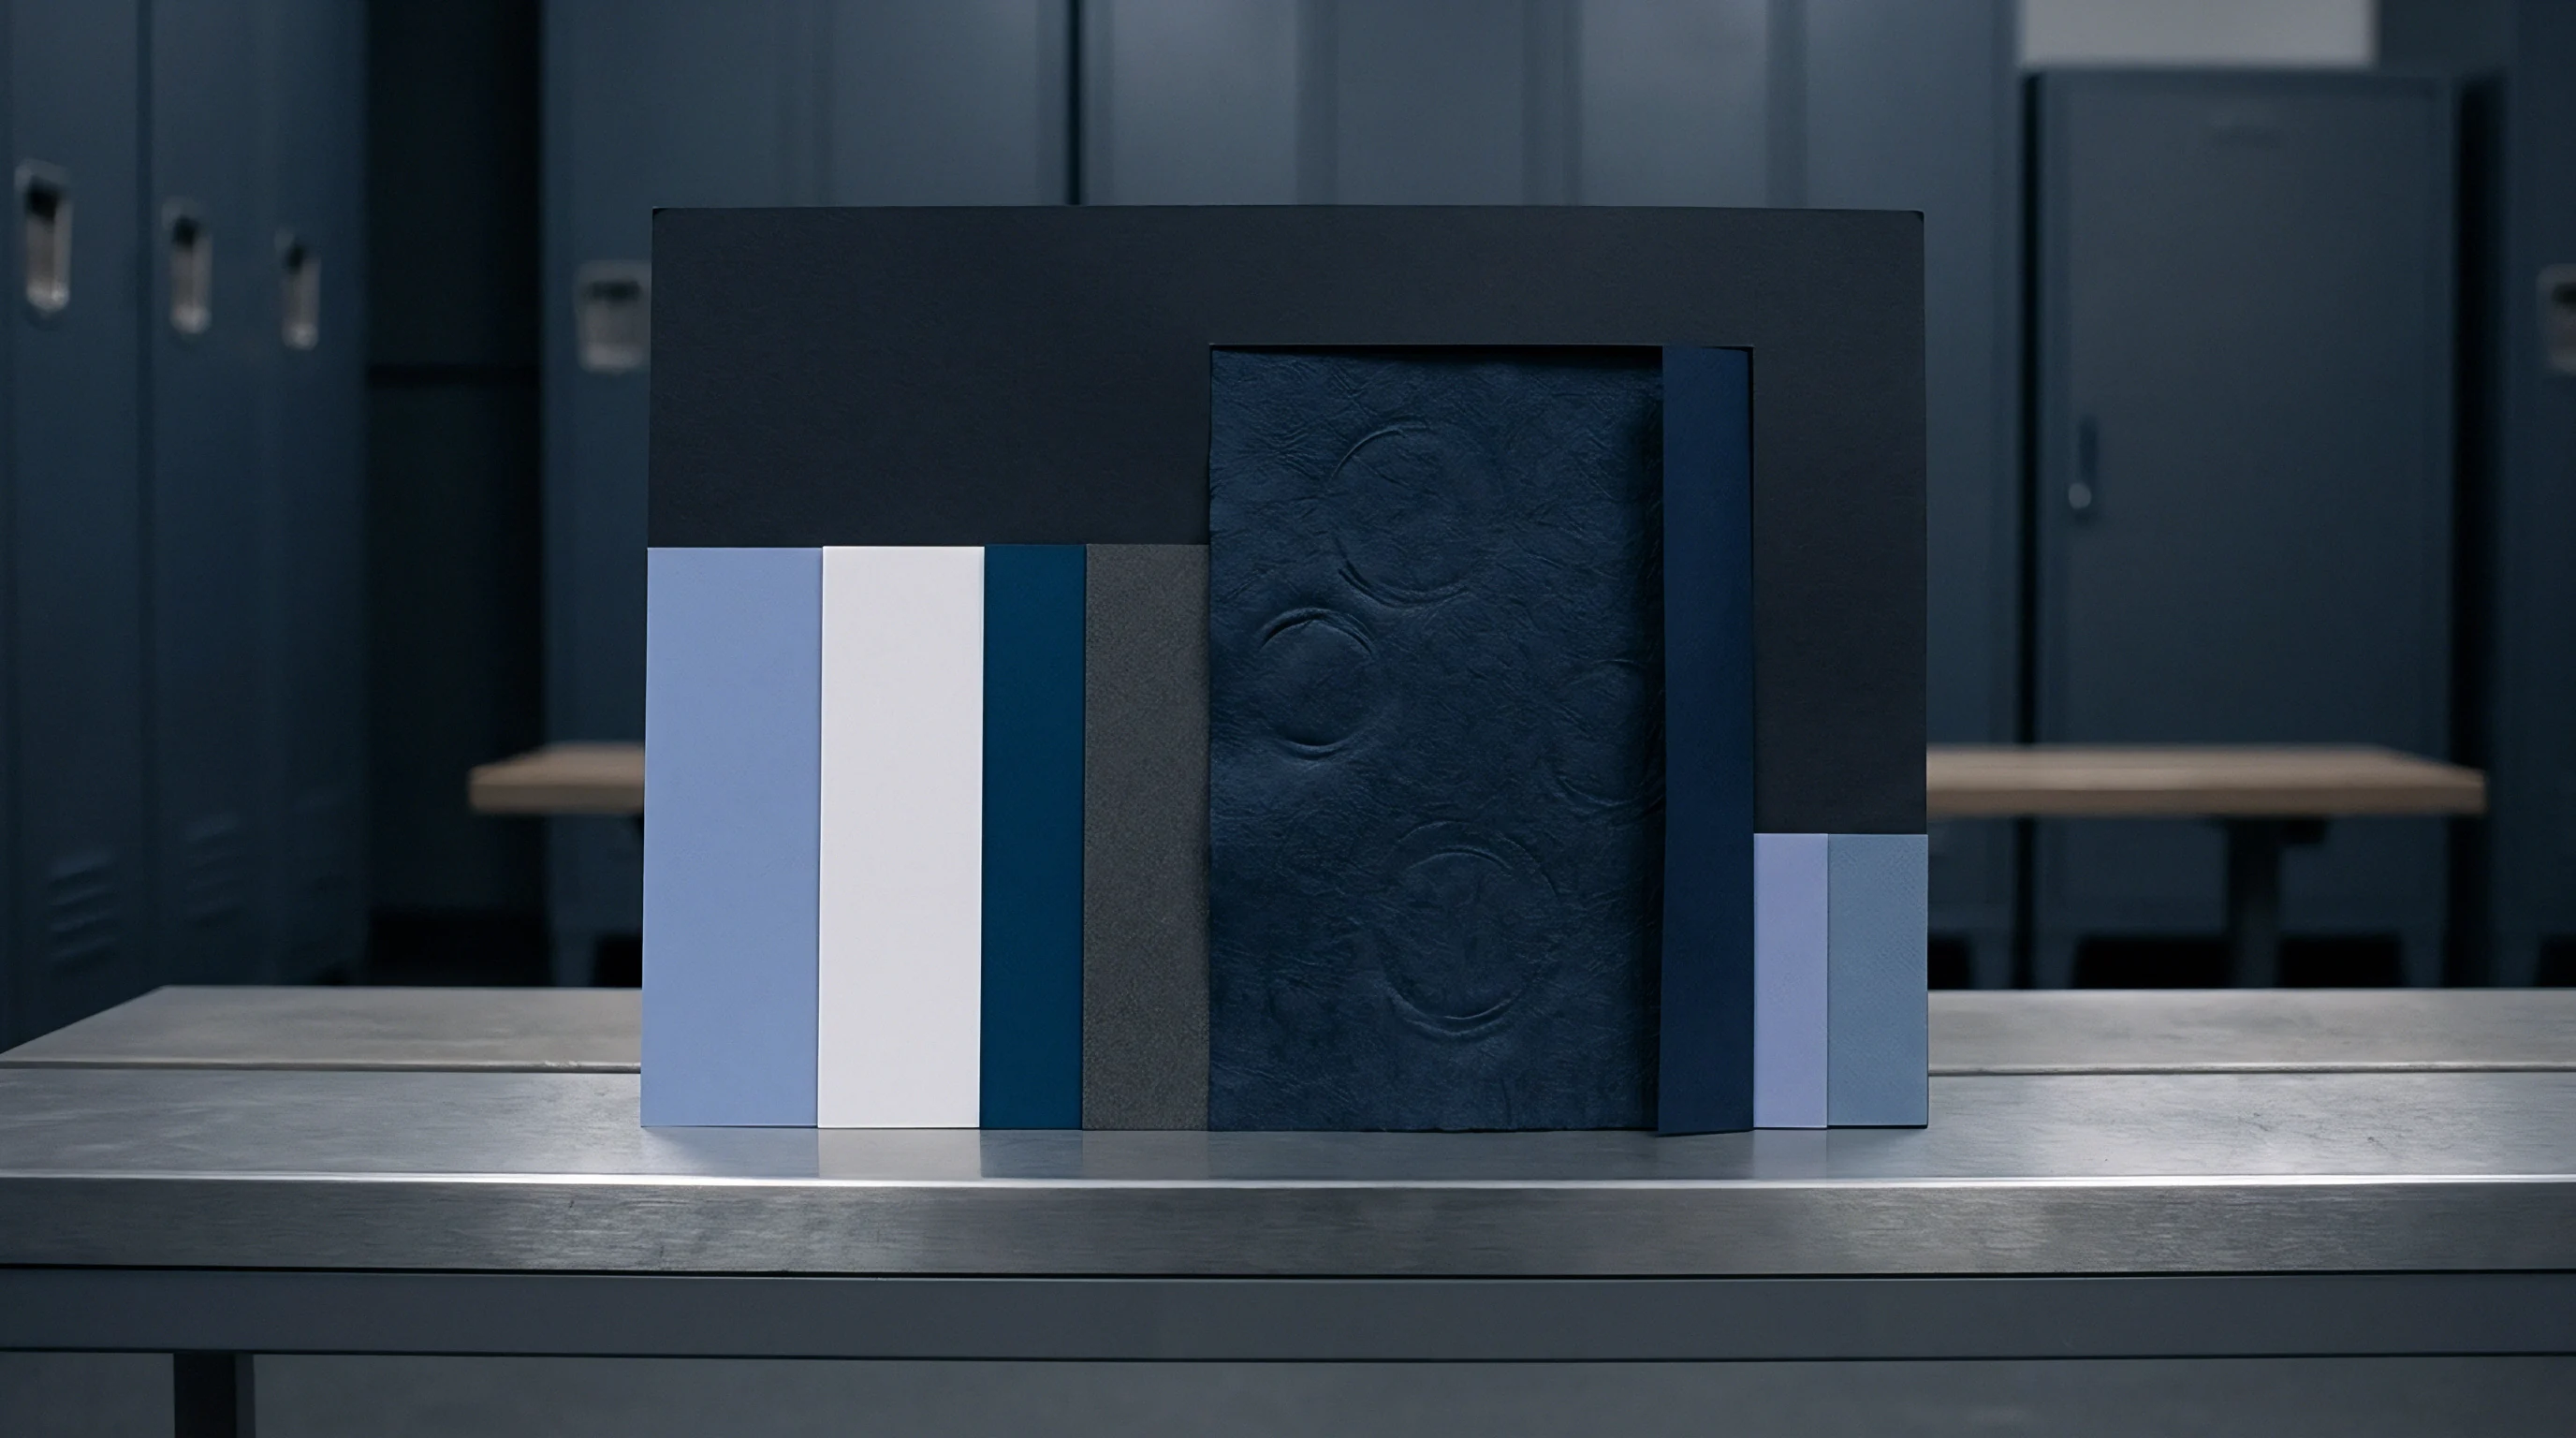
Applying secondary surface finishes introduces extra structural layers that alter the sheet’s acoustic response. Polyethylene (PE) extrusion coatings, cast-coated high-gloss films, foil stampings, and thick ultraviolet (UV) cured varnish layers add distinct physical masses to the board surface. Each added layer creates a new acoustic reflection interface characterized by its own material density and acoustic wave velocity.
A clear UV varnish pass, for instance, adds a dense, brittle polymer film ranging from 4 to 12 micrometers in thickness, increasing surface wave velocity while damping out high-frequency structural resonances.
Film lamination using biaxially oriented polypropylene (BOPP) or polyethylene terephthalate (PET) creates a multi-layered composite board structure. The adhesive layer joining film to board acts as an acoustic damper, absorbing high-frequency stress waves and reducing overall signal amplitude transmitted through the sheet. Inline analysis algorithms must adjust amplification gains and shift detection frequency windows dynamically whenever a lamination pass enters the process line.
| Interface Boundary | Layer 1 Impedance (MRayl) | Layer 2 Impedance (MRayl) | Reflection Coefficient (R) | Transmission Ratio (T) |
|---|---|---|---|---|
| Air to SBS Top Coating | 0.0004 | 2.40 | 0.9997 | 0.0003 |
| Bleached Kraft Ply to Starch Interface | 2.10 | 1.65 | 0.1200 | 0.8800 |
| Bleached Kraft Ply to Internal Air Void | 2.10 | 0.0004 | 0.9996 | 0.0004 |
| Board Surface to Wet PE Film | 1.85 | 1.45 | 0.1212 | 0.8788 |
| Board Surface to Cured UV Varnish | 1.85 | 2.85 | 0.2128 | 0.7872 |

Acoustic Reflection at Layer Boundaries
Calculating wave reflection across multi-pass coatings uses the characteristic acoustic impedance Z, defined as the product of material density ρ and acoustic wave velocity c (Z = ρ · c). The sound pressure reflection coefficient R between two adjacent layers is defined by the impedance difference:
R = fracZ2 – Z1Z2 + Z1
Where Z1 represents the acoustic impedance of the primary board ply and Z2 is the impedance of the applied surface layer or internal defect boundary. When sound board meets an internal air void (Z2 ≈ 0.0004 MRayl), R approaches -1.0, indicating complete phase-inverted reflection. When board meets a cured UV varnish coating (Z1 = 1.85 MRayl, Z2 = 2.85 MRayl), R yields approximately 0.2128, meaning roughly 21.3 percent of the wave pressure reflects off the coating interface while 78.7 percent transmits through into the substrate.
Consider a worked case involving a 400-micrometer FBB board undergoing film lamination. Take board density at 750 kg/m3 and Z-direction wave velocity at 1400 m/s, giving a board impedance Z1 = 1.05 MRayl. The lamination adhesive layer exhibits a density of 1100 kg/m3 and acoustic velocity of 1800 m/s, yielding Z2 = 1.98 MRayl.
The reflection coefficient R at the board-adhesive interface calculates as:
R = frac1.98 – 1.051.98 + 1.05 = frac0.933.03 ≈ 0.3069
The intensity reflection coefficient RI, which measures energy transfer, equals R2:
RI = (0.3069)2 ≈ 0.0942
This confirms that 9.42 percent of the acoustic wave energy reflects off the sound adhesive layer. If an internal delamination void sits directly beneath the adhesive layer, Z2 drops to 0.0004 MRayl, driving RI to 0.9984. The system registers an immediate tenfold energy jump in the early-reflection spectral window, confirming substrate failure beneath an intact surface film.
Surface film additions shift baseline acoustic impedance, but internal air gaps dominate total signal reflection regardless of overlaying layers.
Does heavy soft-touch film lamination damp high-frequency acoustic reflection so severely that micro-delaminations under 100 micrometers in depth become masked during inline inspection?


Ledger

Yield Metrics and Downstream Waste Arithmetic
Installing inline stress wave frequency analysis systems requires evaluating equipment expenditure against downstream waste exposure. Converting lines running at high speeds produce thousands of square meters of board per hour. An undetected delamination flaw originating at the paper mill web former can pass through offset printing, solid barrier lamination, and flatbed die-cutting without visual detection.
The structural failure reveals itself only on high-speed folder-gluers, where score folds split under high-rate mechanical bending, jamming equipment and damaging precision belt feeds.
Calculating the true financial cost of delamination includes material scrap, machine downtime, discarded post-print passes, and labor charges incurred during sorting. A single lot of defective board that reaches final converting can destroy thousands of dollars in added pass value.
| Cost Component | Inline Flagged at Mill / Slitter | Failure on Folder-Gluer Line |
|---|---|---|
| Substrate Waste Cost | Raw paperboard value per ton | Full printed and finished blank value per ton |
| Lost Converting Pass Value | Zero added pass loss | 100% loss of print, lamination, and foil passes |
| Machine Downtime Charge | Zero (automatic marker flags reel) | $450 to $850 per hour gluer downtime |
| Sorting and Inspection Labor | Zero | Manual pallet inspection at $45/hour |
| Downstream Penalty / Claim | Standard mill credit rebate | Total job chargeback plus line breach fines |

Covenant Wording and Quality Specification Integration
Securing commercial protection against systemic board delamination requires embedding clear acoustic verification protocols into raw material purchase contracts. Standard mill specifications often rely on static Scott Bond ranges, which allow localized micro-flaws to pass unrecorded inside batch averages. Dynamic inline stress wave verification metrics replace subjective testing with continuous wave attenuation and frequency limits.
To enforce quality accountability, sourcing contracts integrate precise technical verification covenants into supply agreements.
- Dynamic shear verification clause stipulates that board reels must maintain continuous Z-direction dynamic modulus above 1.4 Gigapascals as measured by inline ultrasonic analysis.
- Acoustic map documentation requirement mandates that every delivered roll carries a digital roll map file referencing acoustic defect locations synchronized to barcode roll IDs.
- Batch rejection threshold protocol permits automatic lot rejection without supplier arbitration if inline acoustic logs show delamination defects exceeding 0.5 percent of total roll surface area.
- Finishing pass warranty indemnity holds the mill financially responsible for secondary pass costs incurred when delamination occurs on board marked defect-free in mill roll maps.
Integrating continuous stress wave frequency analysis directly into high-speed converting lines bridges the gap between raw board manufacture and final package performance. Material buyers who specify real-time frequency limits convert unpredictable delamination risk into verifiable quality ledger metrics. Line operators monitor spectral attenuation stability, adjust machine web tension before micro-voids expand, and isolate defective board rolls before money is spent printing and laminating failed fiber webs.
Contractual covenants linking material acceptance to digital acoustic roll maps transfer secondary finishing waste risks back to the board manufacturer.
The financial ledger reflects every unmonitored material defect. Quality managers review real-time spectral frequency charts, verify process limits across every reel section, and approve delivery lots with verified acoustic profiles.