Laser Line Triangulation Profilometry Principles on Continuous Paperboard Substrates
Inline blue laser triangulation measures paperboard surface topography at high speeds by overcoming fiber light penetration and isolating mechanical flutter.

Optics
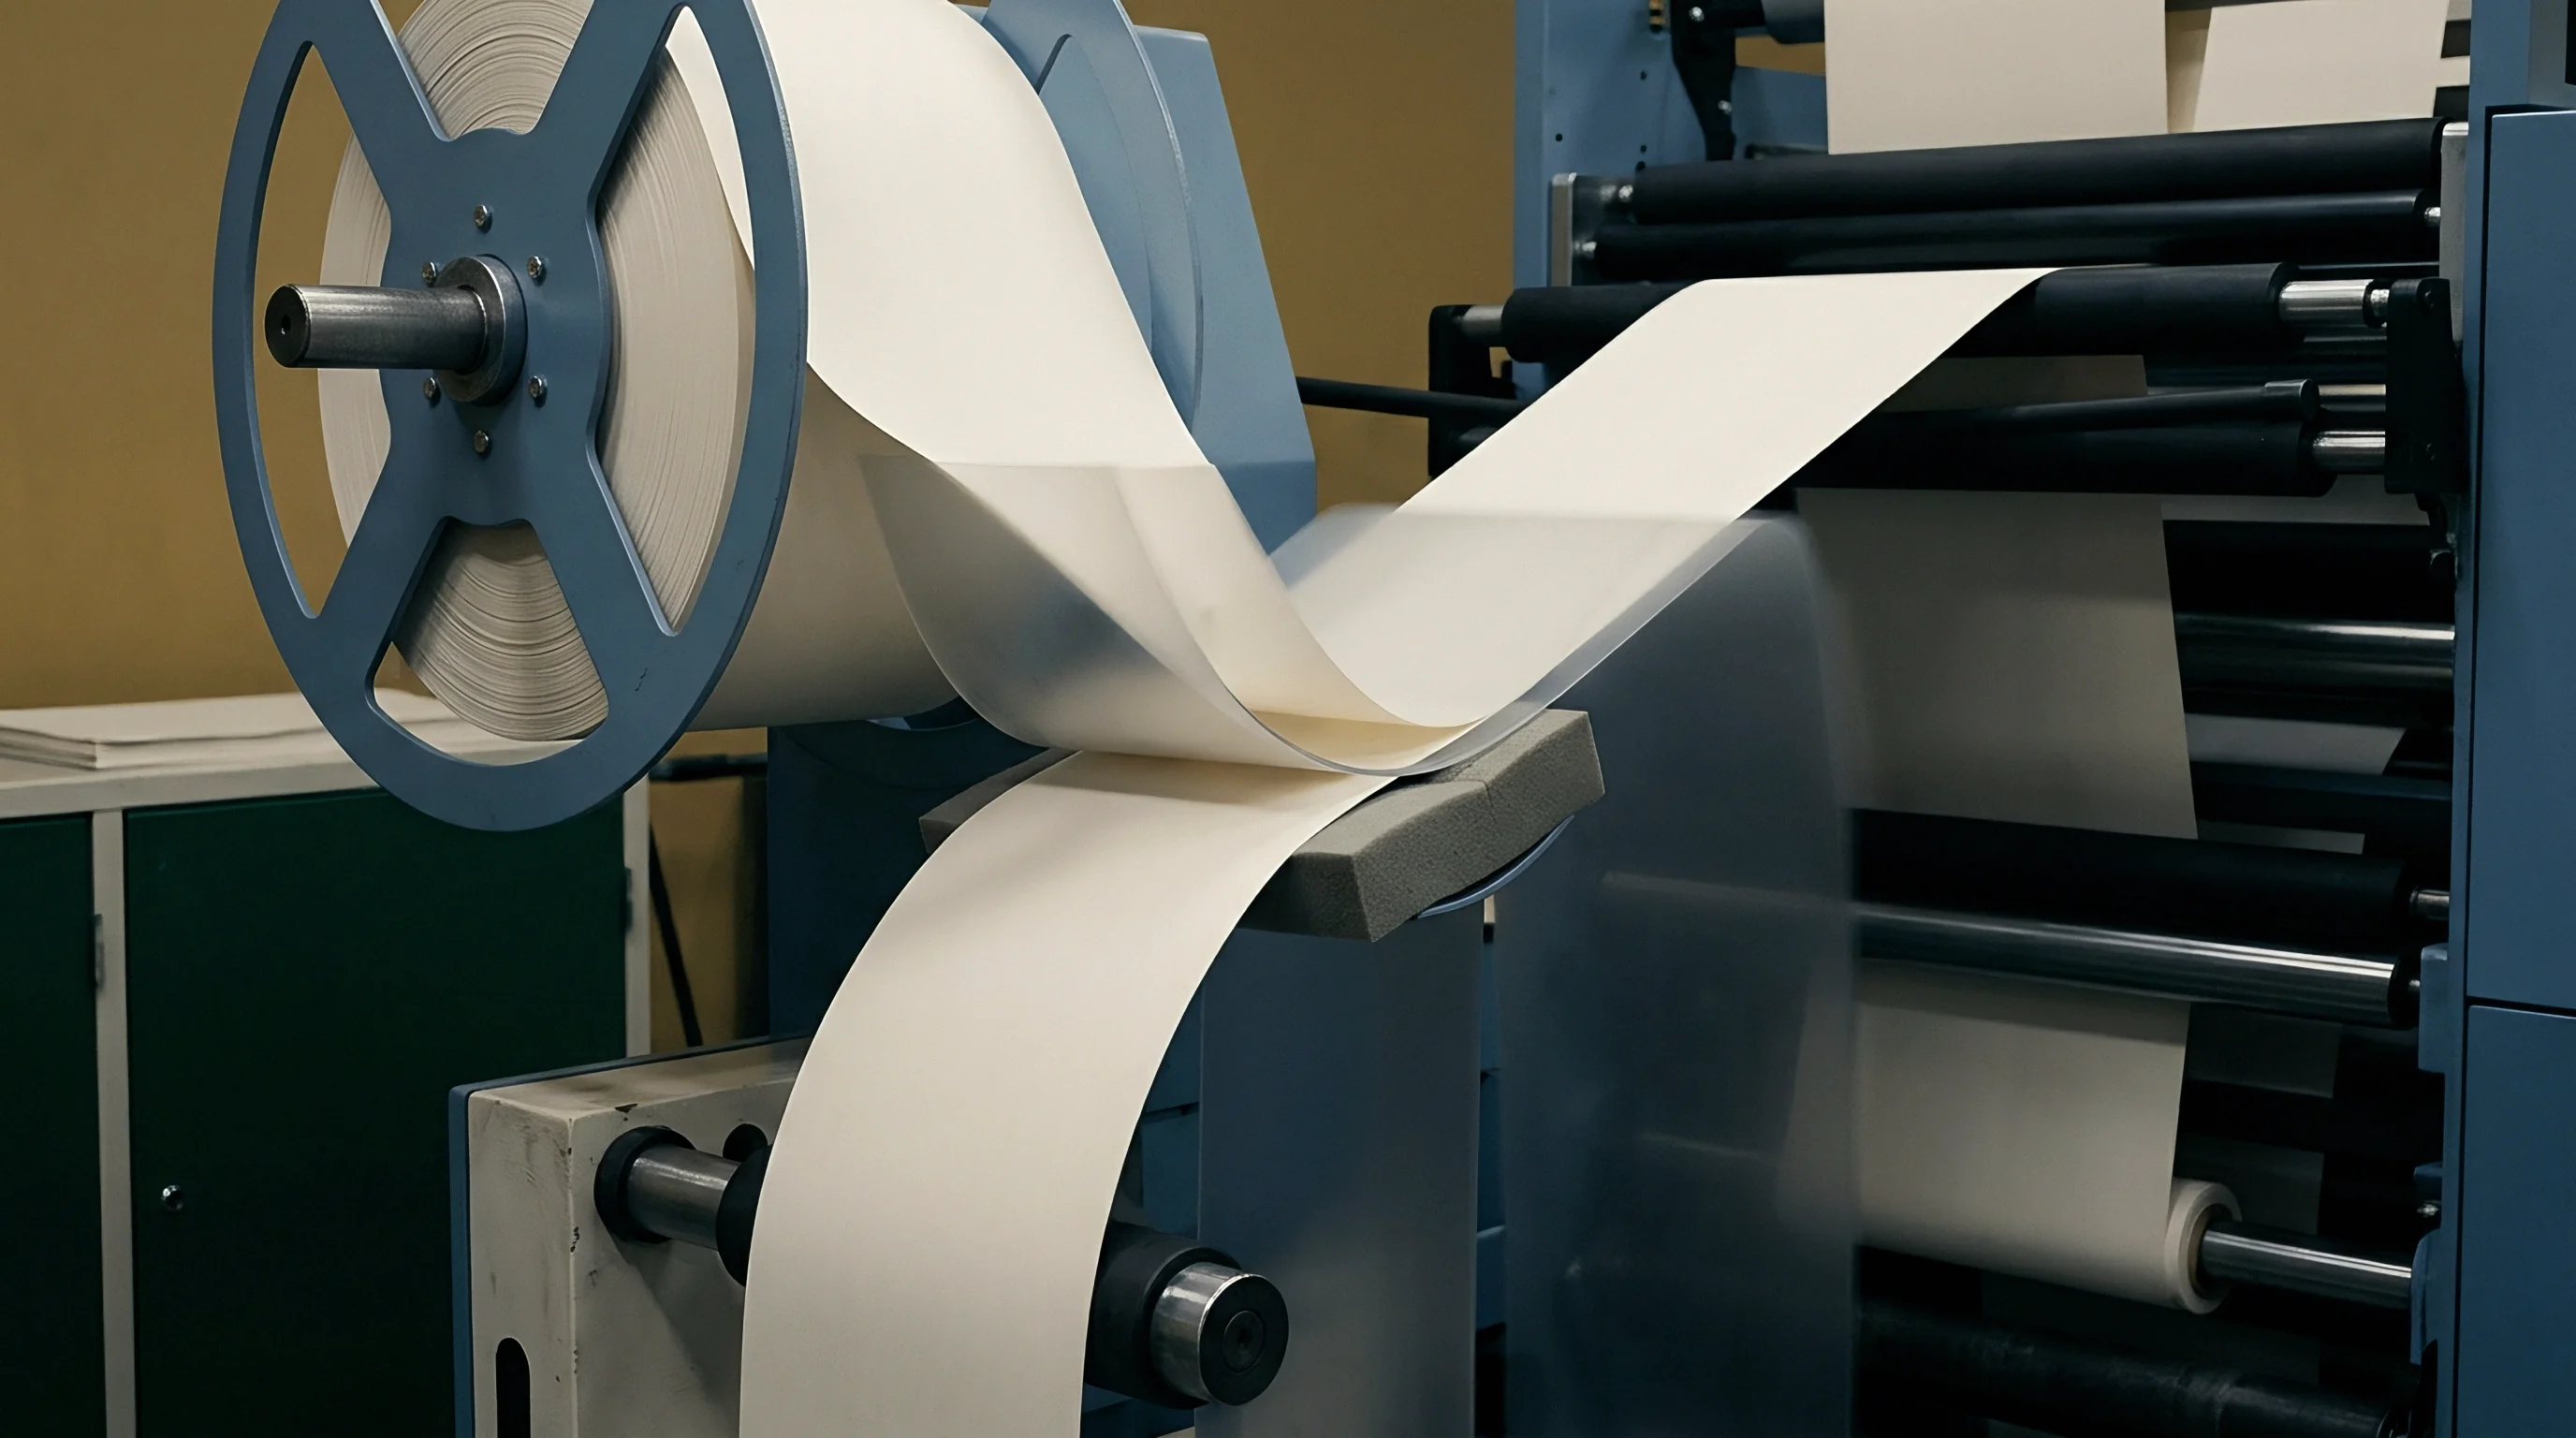
Non-contact surface inspection of running paperboard webs relies on active laser line projection paired with high-speed area scan cameras. Light projected across the web forms a continuous line that shifts laterally on the matrix array whenever surface elevation changes. Physical displacement of that light vector correlates directly to local board height, mapping a three-dimensional profile across the sheet width.
Specifying inline triangulation heads involves selecting camera angles and laser geometries matched to expected caliper, web flutter tolerance, and the required spatial sampling pitch.
The optical configuration sets the theoretical limit for lateral and vertical resolution. Direct reflections from calendered clay coatings produce intense specular peaks that saturate sensor pixels, whereas diffuse scattering from unbleached kraft fibers dulls peak contrast. Triangulation systems balance illumination intensity, camera exposure times, and lens apertures to preserve sub-pixel feature resolution at production speeds exceeding 400 meters per minute.
Geometrical Axis Alignment and Triangular Triad
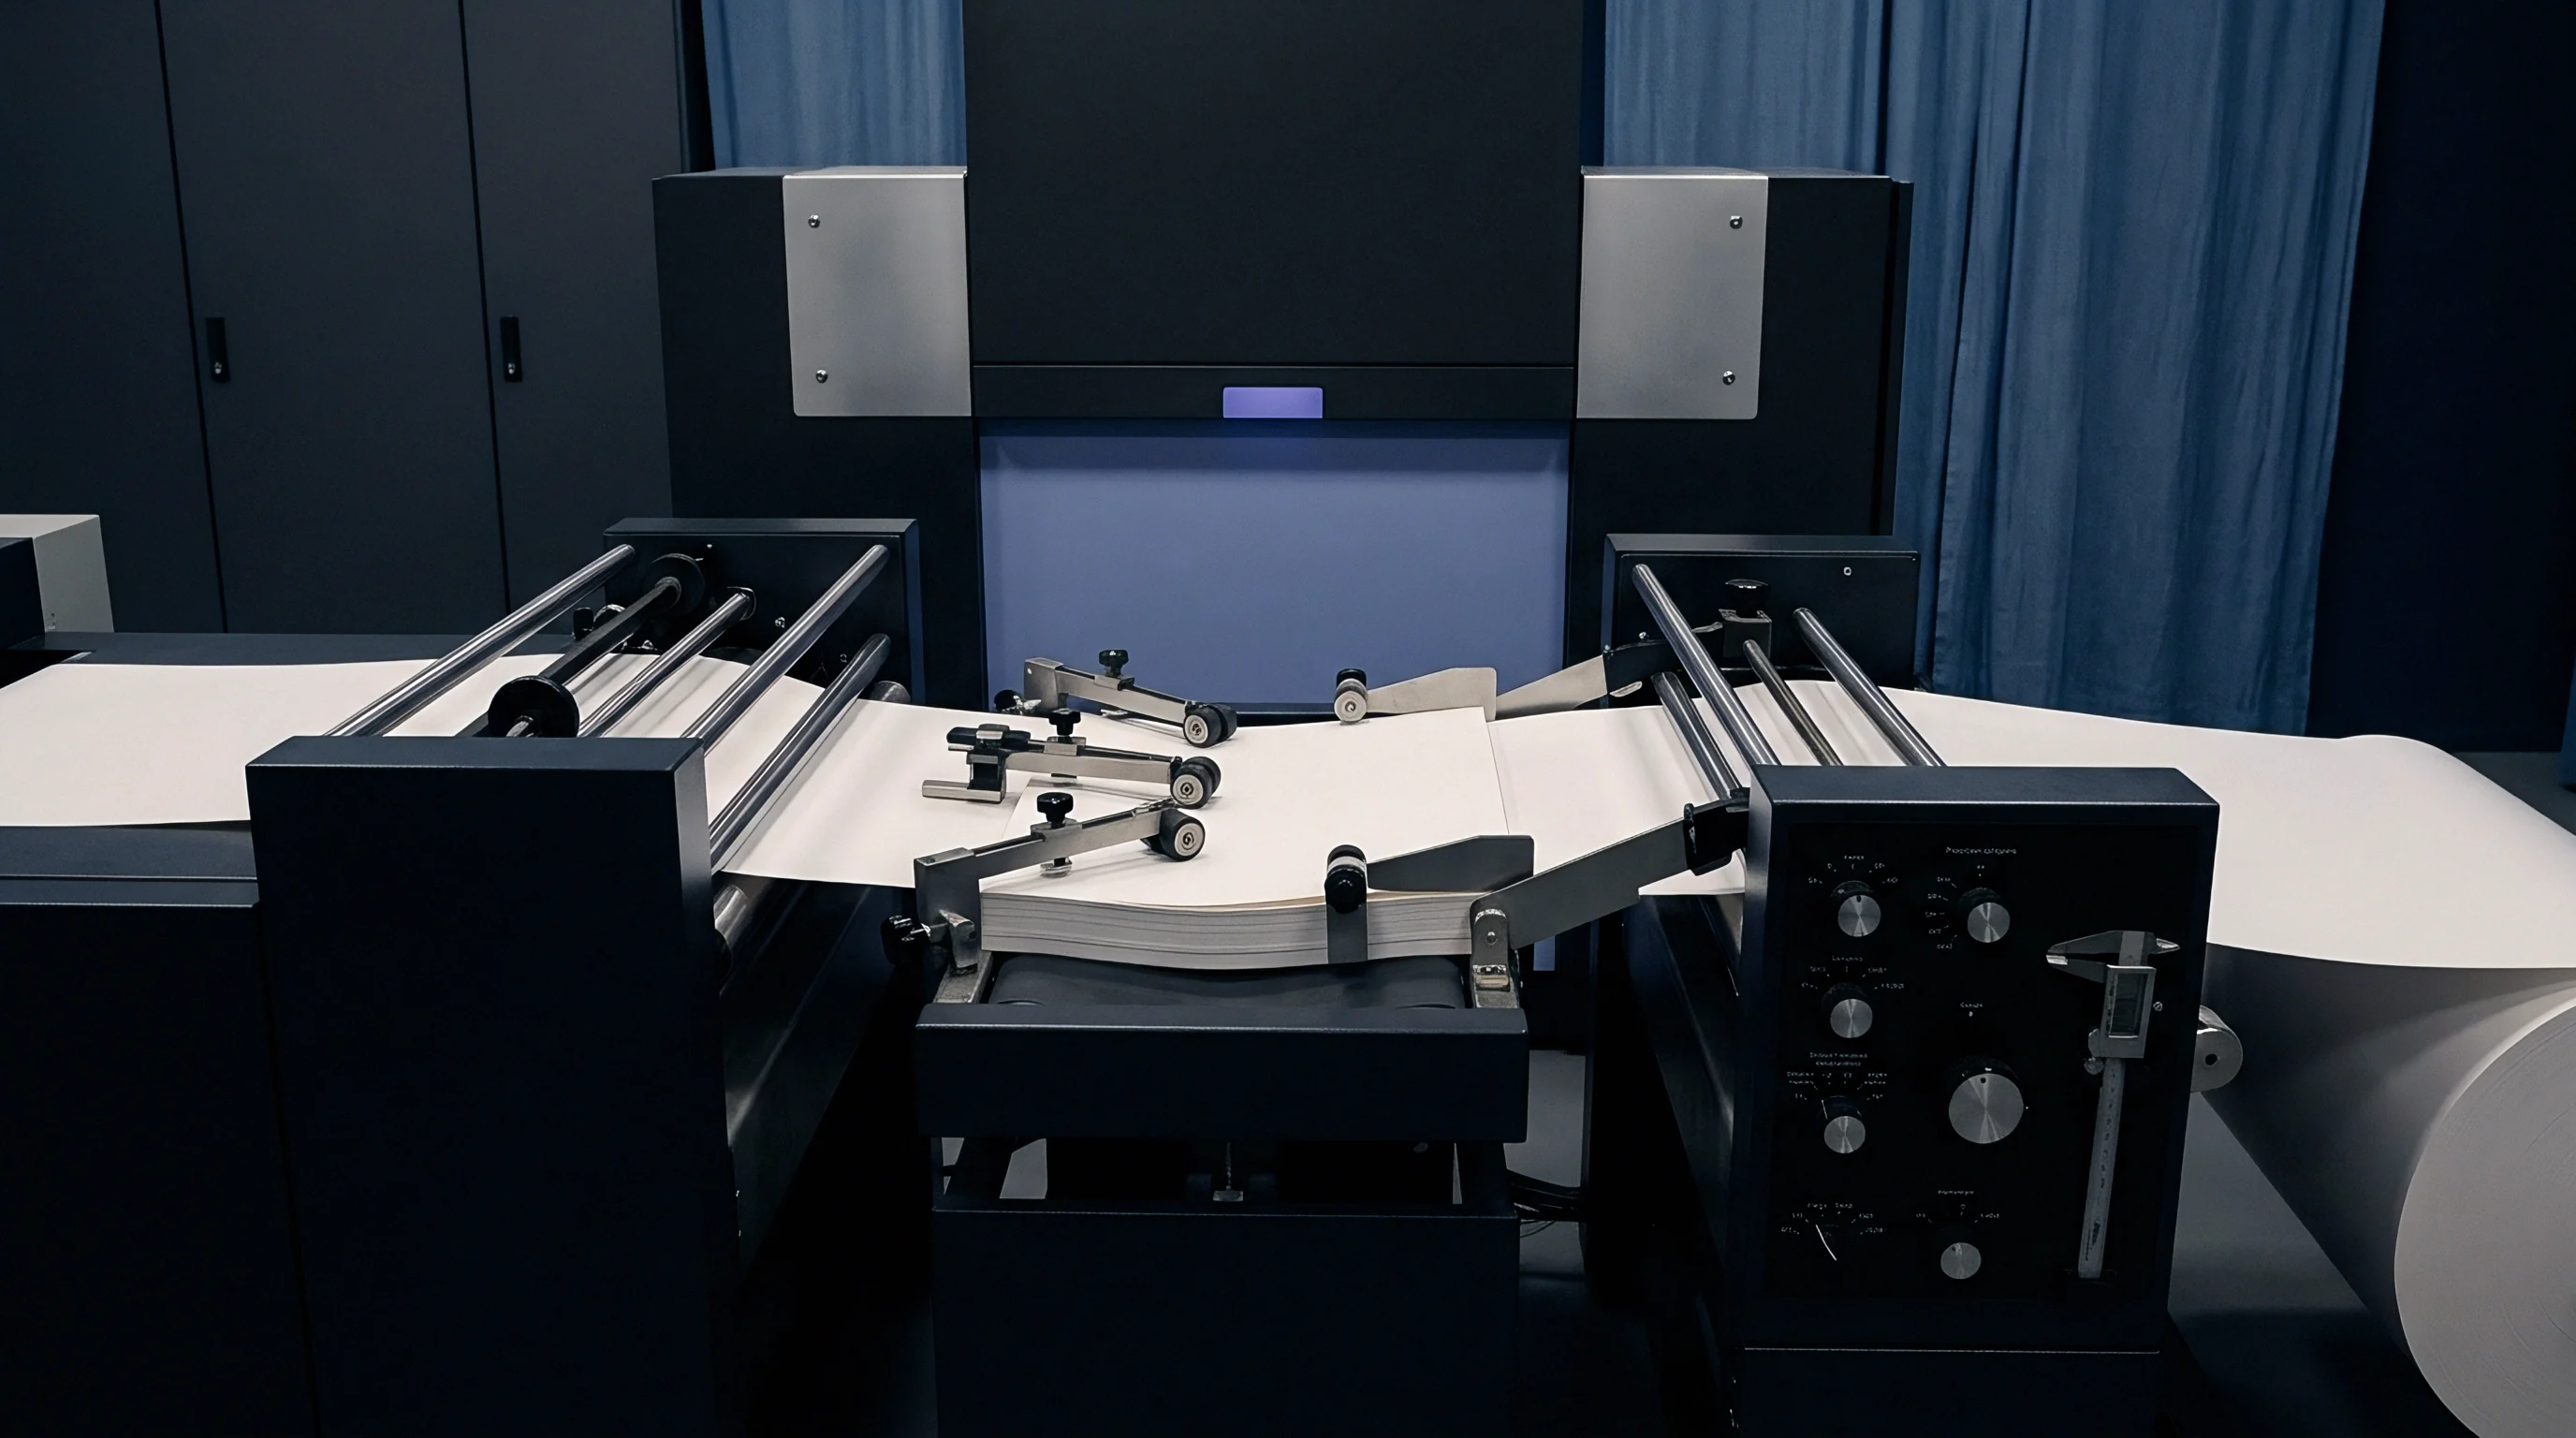
Spatial resolution in triangulation systems depends on the angular offset between the laser projection axis and the camera detection axis. Angles between 30 degrees and 45 degrees offer a practical compromise between vertical elevation sensitivity and shadow occlusion on rough paperboard surfaces. Smaller angles minimize shadow effects around steep surface pores or severe creasing folds, though they compress vertical displacement amplitude on the sensor.
Larger angles expand the vertical measurement scale across sensor pixels, increasing elevation precision at the expense of optical line of sight inside deep fissures.
Standoff distance between the optical sensor enclosure and the moving web dictates depth of field and transverse line length. Standard industrial setups fix the laser source and camera matrix at a working clearance ranging from 100 millimeters to 300 millimeters. Magnification ratios set by focal length determine physical pixel mapping.
A typical sensor matrix spanning 2048 pixels across a 50-millimeter field of view yields an inline lateral resolution of 24.4 micrometers per pixel. Vertical resolution reaches sub-micrometer levels through software center-of-gravity detection across the laser beam width.

Scheimpflug Schematics and Focal Plane Distortion
Tilting the camera orientation relative to the laser emission plane creates focus variation across the detector array. To maintain uniform focus across the entire measurement depth of field, the optical assembly conforms to the Scheimpflug condition. The image sensor plane, the camera lens principal plane, and the projected laser light sheet intersect along a single spatial line.
Following this geometry guarantees sharp optical focus across extreme elevation excursions caused by out-of-plane web flutter or high board caliper variations.
Lens distortion compensation matrices correct geometric warping inherent to wide-angle projection optics. As the laser line extends across wide board webs, optical magnification varies slightly from the center to the image edges. Calibration target grids recorded prior to operational mounting establish polynomial correction factors.
Real-time field-programmable gate arrays (FPGAs) within the sensor housing execute spatial interpolation calculations to normalize displacement measurements across every pixel column before outputting surface height arrays.
Wavelength Selection and Blue-Violet Diode Advantage
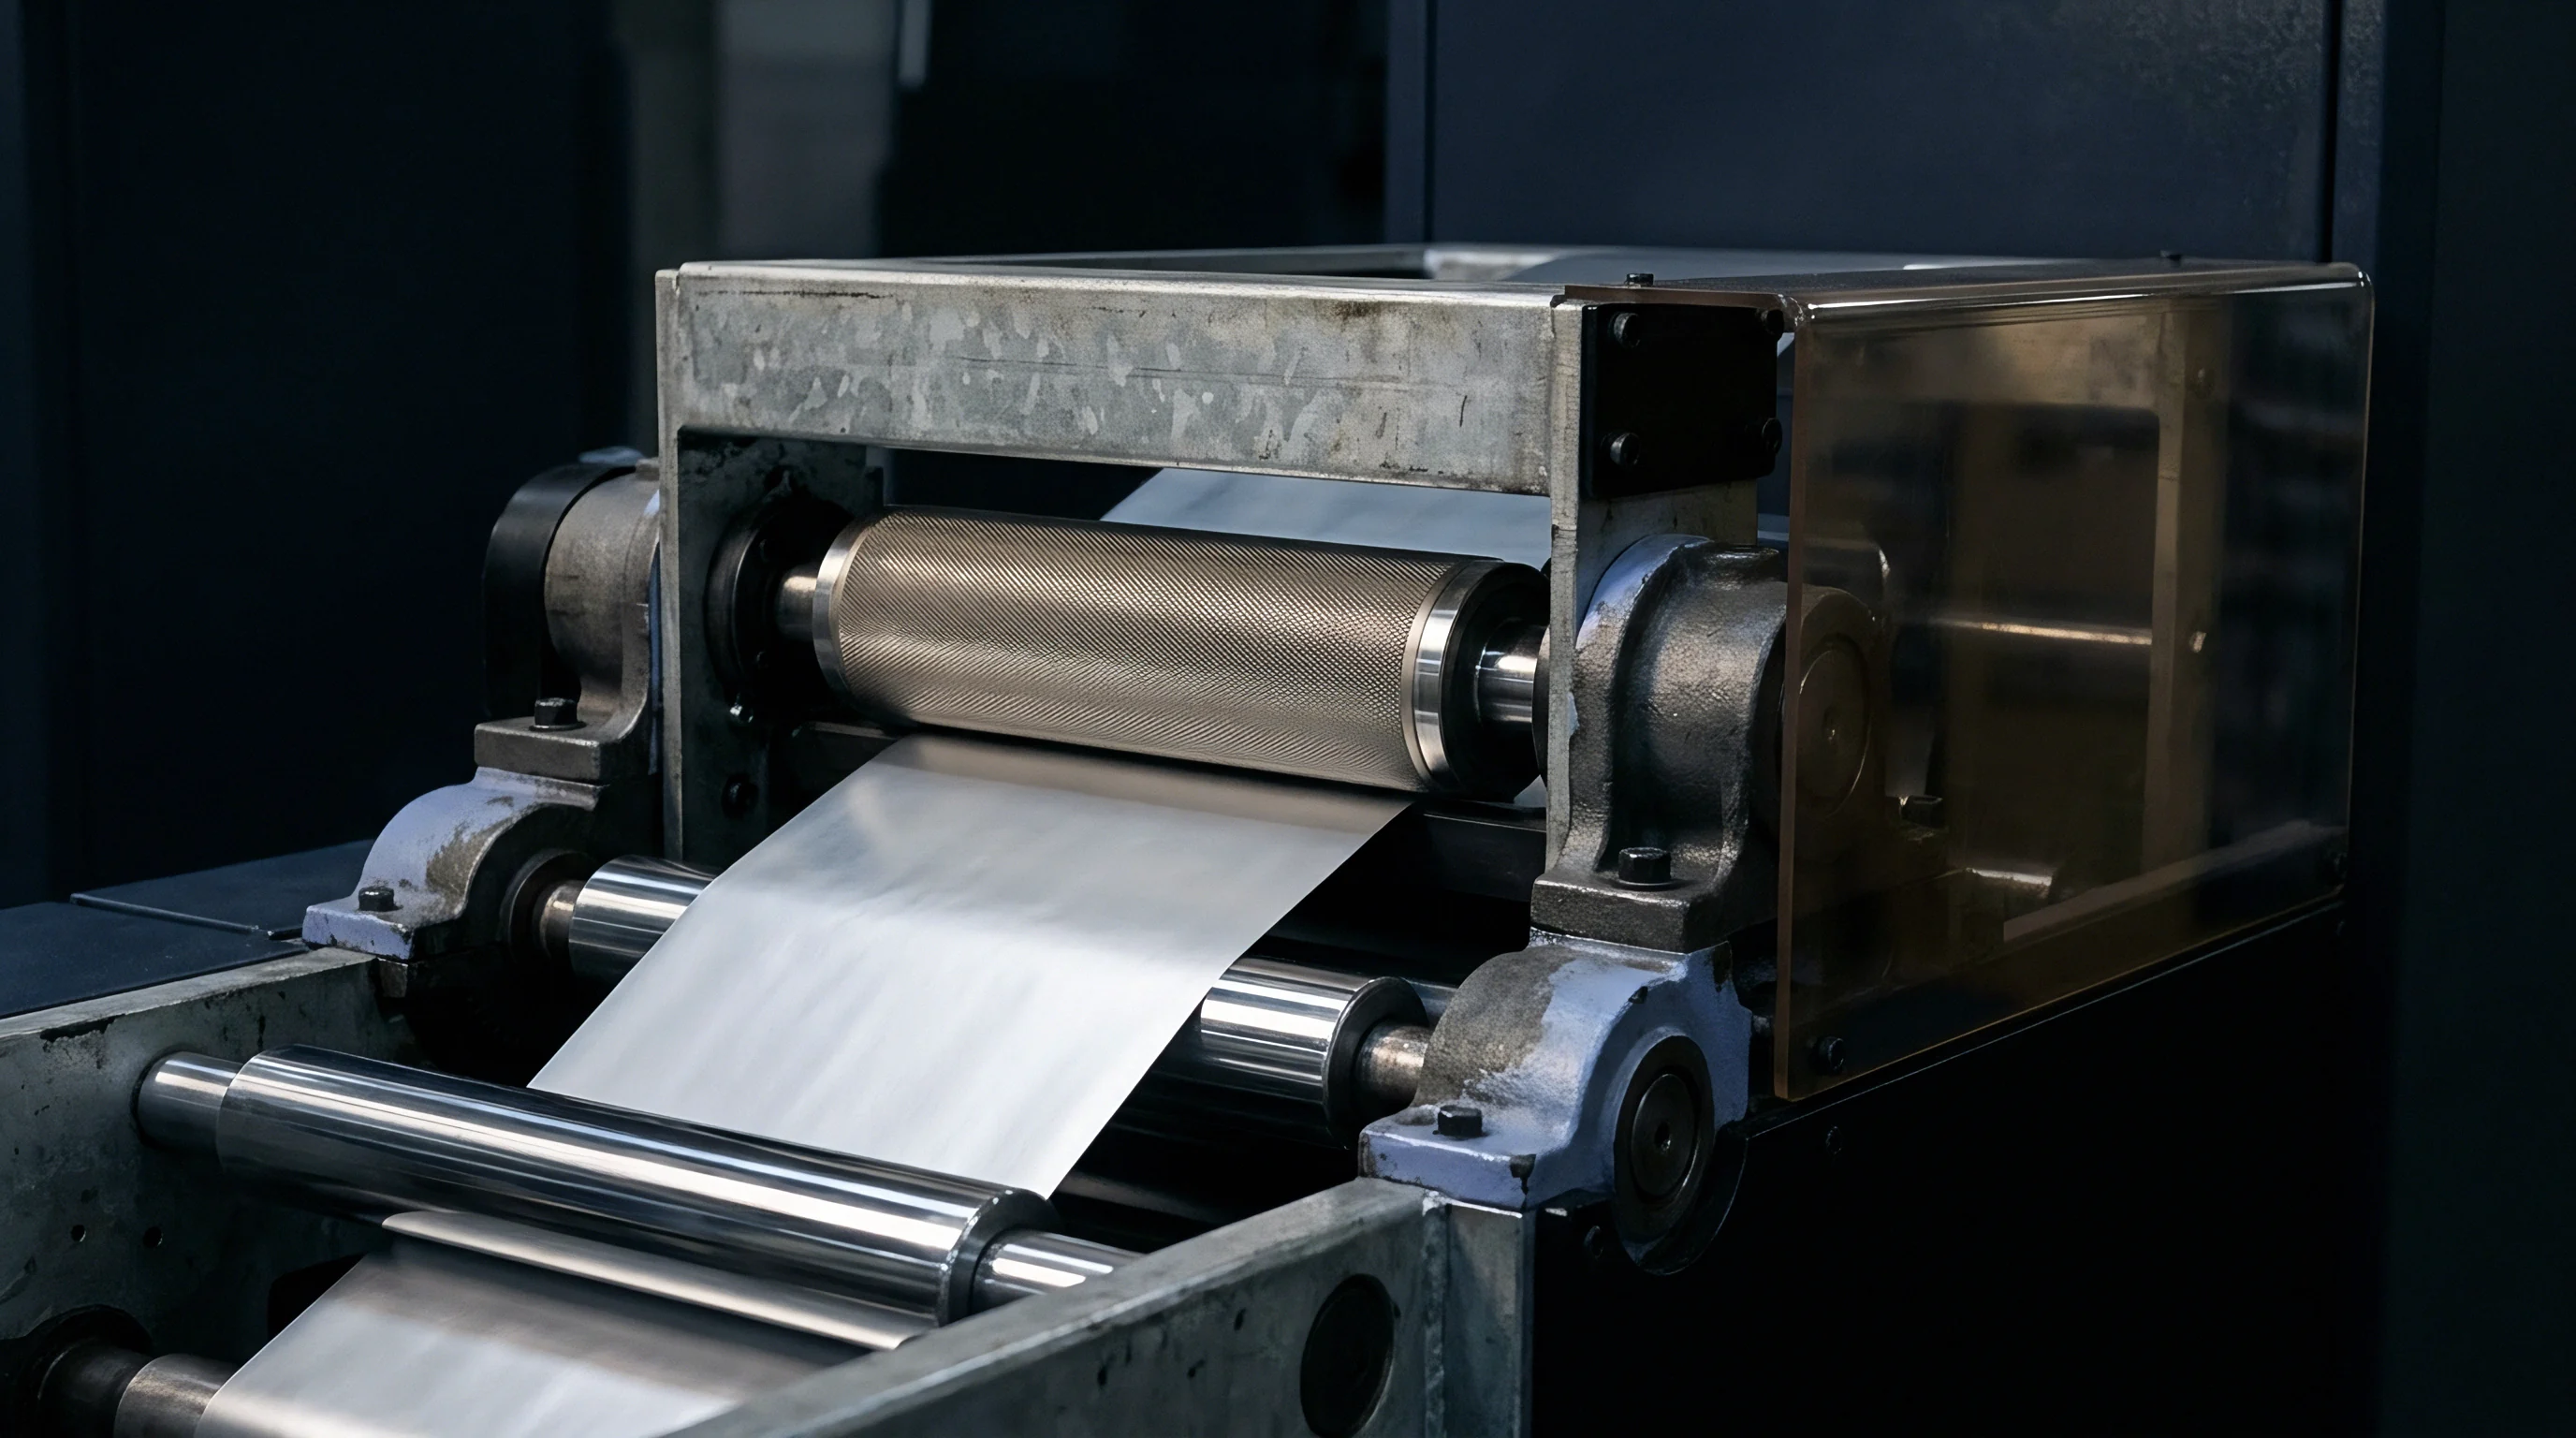
Light source selection heavily governs height measurement accuracy across fibrous paperboard networks. Conventional red laser diodes operating near 650 nanometers penetrate deep into the cellulose matrix, causing subsurface photon diffusion that broadens the detected line profile. Transitioning to blue-violet laser diodes operating at 405 nanometers reduces optical penetration depth into organic fibers and mineral coating binders.
Blue light scatters predominantly at the outer physical boundary of the sheet surface, sharpening the reflected line image on the CMOS matrix.
Laser power modulation balances exposure consistency across changing board grades. Solid bleached sulfate (SBS) boards exhibit high diffuse reflectance, requiring lower laser excitation power to avoid sensor saturation. Recycled folding boxboards (FBB) containing unbleached kraft fibers or grey unprinted pulp layers absorb significant incident optical energy, requiring higher laser driver currents or extended sensor integration times.
Continuous automatic gain control loops dynamically adjust laser output to maintain uniform peak signal-to-noise ratios across varying board furnishes.
| Parameter | 405 nm Blue Laser Setup | 650 nm Red Laser Setup | Operational Impact |
|---|---|---|---|
| Optical Penetration Depth (SBS) | 8 to 14 µm | 35 to 60 µm | Blue light isolates the true surface boundary without subsurface diffusion blur. |
| Triangulation Angle (thη) | 45 degrees | 30 degrees | Higher angles increase height sensitivity but increase shadow occlusion in deep pores. |
| Camera Integration Time | 20 to 50 µs | 15 to 40 µs | Shorter integration limits motion blur at web speeds up to 500 m/min. |
| Lateral Resolution (X-axis) | 12.5 µm/px | 25.0 µm/px | Finer pixel resolution catches narrow micro-compressions and surface pinholes. |
| Elevation Precision (Z-axis) | 0.4 µm | 1.2 µm | Blue optics combined with sub-pixel processing deliver sub-micron height detection. |
When configuring sensor heads for high-speed continuous board inspection, triangulation geometry establishes the physical limit of vertical resolution. Specular glare from highly calendered coated boards often disrupts line profile extraction algorithms. Dual-camera configurations viewing a single projected laser line from opposite angular vectors eliminate directional shadow errors and suppress single-angle specular glare blinding.
Combining dual intensity streams ensures continuous height acquisition across heavy blade-coated or film-press treated packaging stock.
Claiming that optical blurring from translucent fibers can be mathematically eliminated through sensor gain adjustments ignores the physical shift in photon emission origins beneath the coating layer.


Scattering
Cellulose networks act as translucent multi-scattering media under coherent illumination. Incident light photons penetrate the porous fiber structure, undergo multiple internal reflections at fiber-air interfaces, and re-emerge at spatial positions distant from the original impact point. This volumetric scattering phenomenon distorts the apparent position of the projected laser line on the sensor matrix, introducing systematic errors in elevation calculation.
Profilometry systems measuring continuous board webs must account for furnish optical density, filler content, and coating thickness to extract true physical surface topography.
Diffuse backscatter alters the laser intensity distribution recorded by sensor pixels. Instead of a narrow Gaussian intensity curve reflecting the physical beam profile, the camera observes an asymmetric, broadened intensity distribution. Standard peak detection algorithms misinterpret this broadened distribution as a true surface height shift, generating false topographic artifacts.
Quantifying light transport parameters within cellulose networks allows signal processing algorithms to isolate physical topography from optical material variation.

Subsurface Volumetric Backscatter in Cellulosic Fibres
Photon transport within paperboard is dictated by the absorption coefficient, the scattering coefficient, and the phase function of the constituent pulps. Unbleached softwood kraft pulps contain high residual lignin concentrations, yielding high light absorption that restricts photon path lengths. Bleached chemical pulps exhibit minimal optical absorption across visible wavelengths, permitting deeper photon penetration into the sheet body.
As photons wander through the open network of bleached fibers, light re-emerges tens of micrometers away from the laser line center, elevating the background noise floor of the optical sensor.
Comparing unbleached kraft pulps against bleached sulphate furnishes reveals optical penetration variations exceeding 40 microns under red laser illumination. This depth difference alters the perceived baseline height of the substrate. Highly refined fibers pack tightly, creating smaller inter-fiber voids that increase the scattering coefficient and shorten photon penetration depth.
Conversely, high-bulk mechanical pulps with bulky lignified fibers permit deeper optical entry, distorting peak detection accuracy. Continuous board measurement systems apply real-time baseline offset algorithms adjusted for furnish type and refining energy levels.
Peak Extraction Algorithms and Center of Gravity Drift
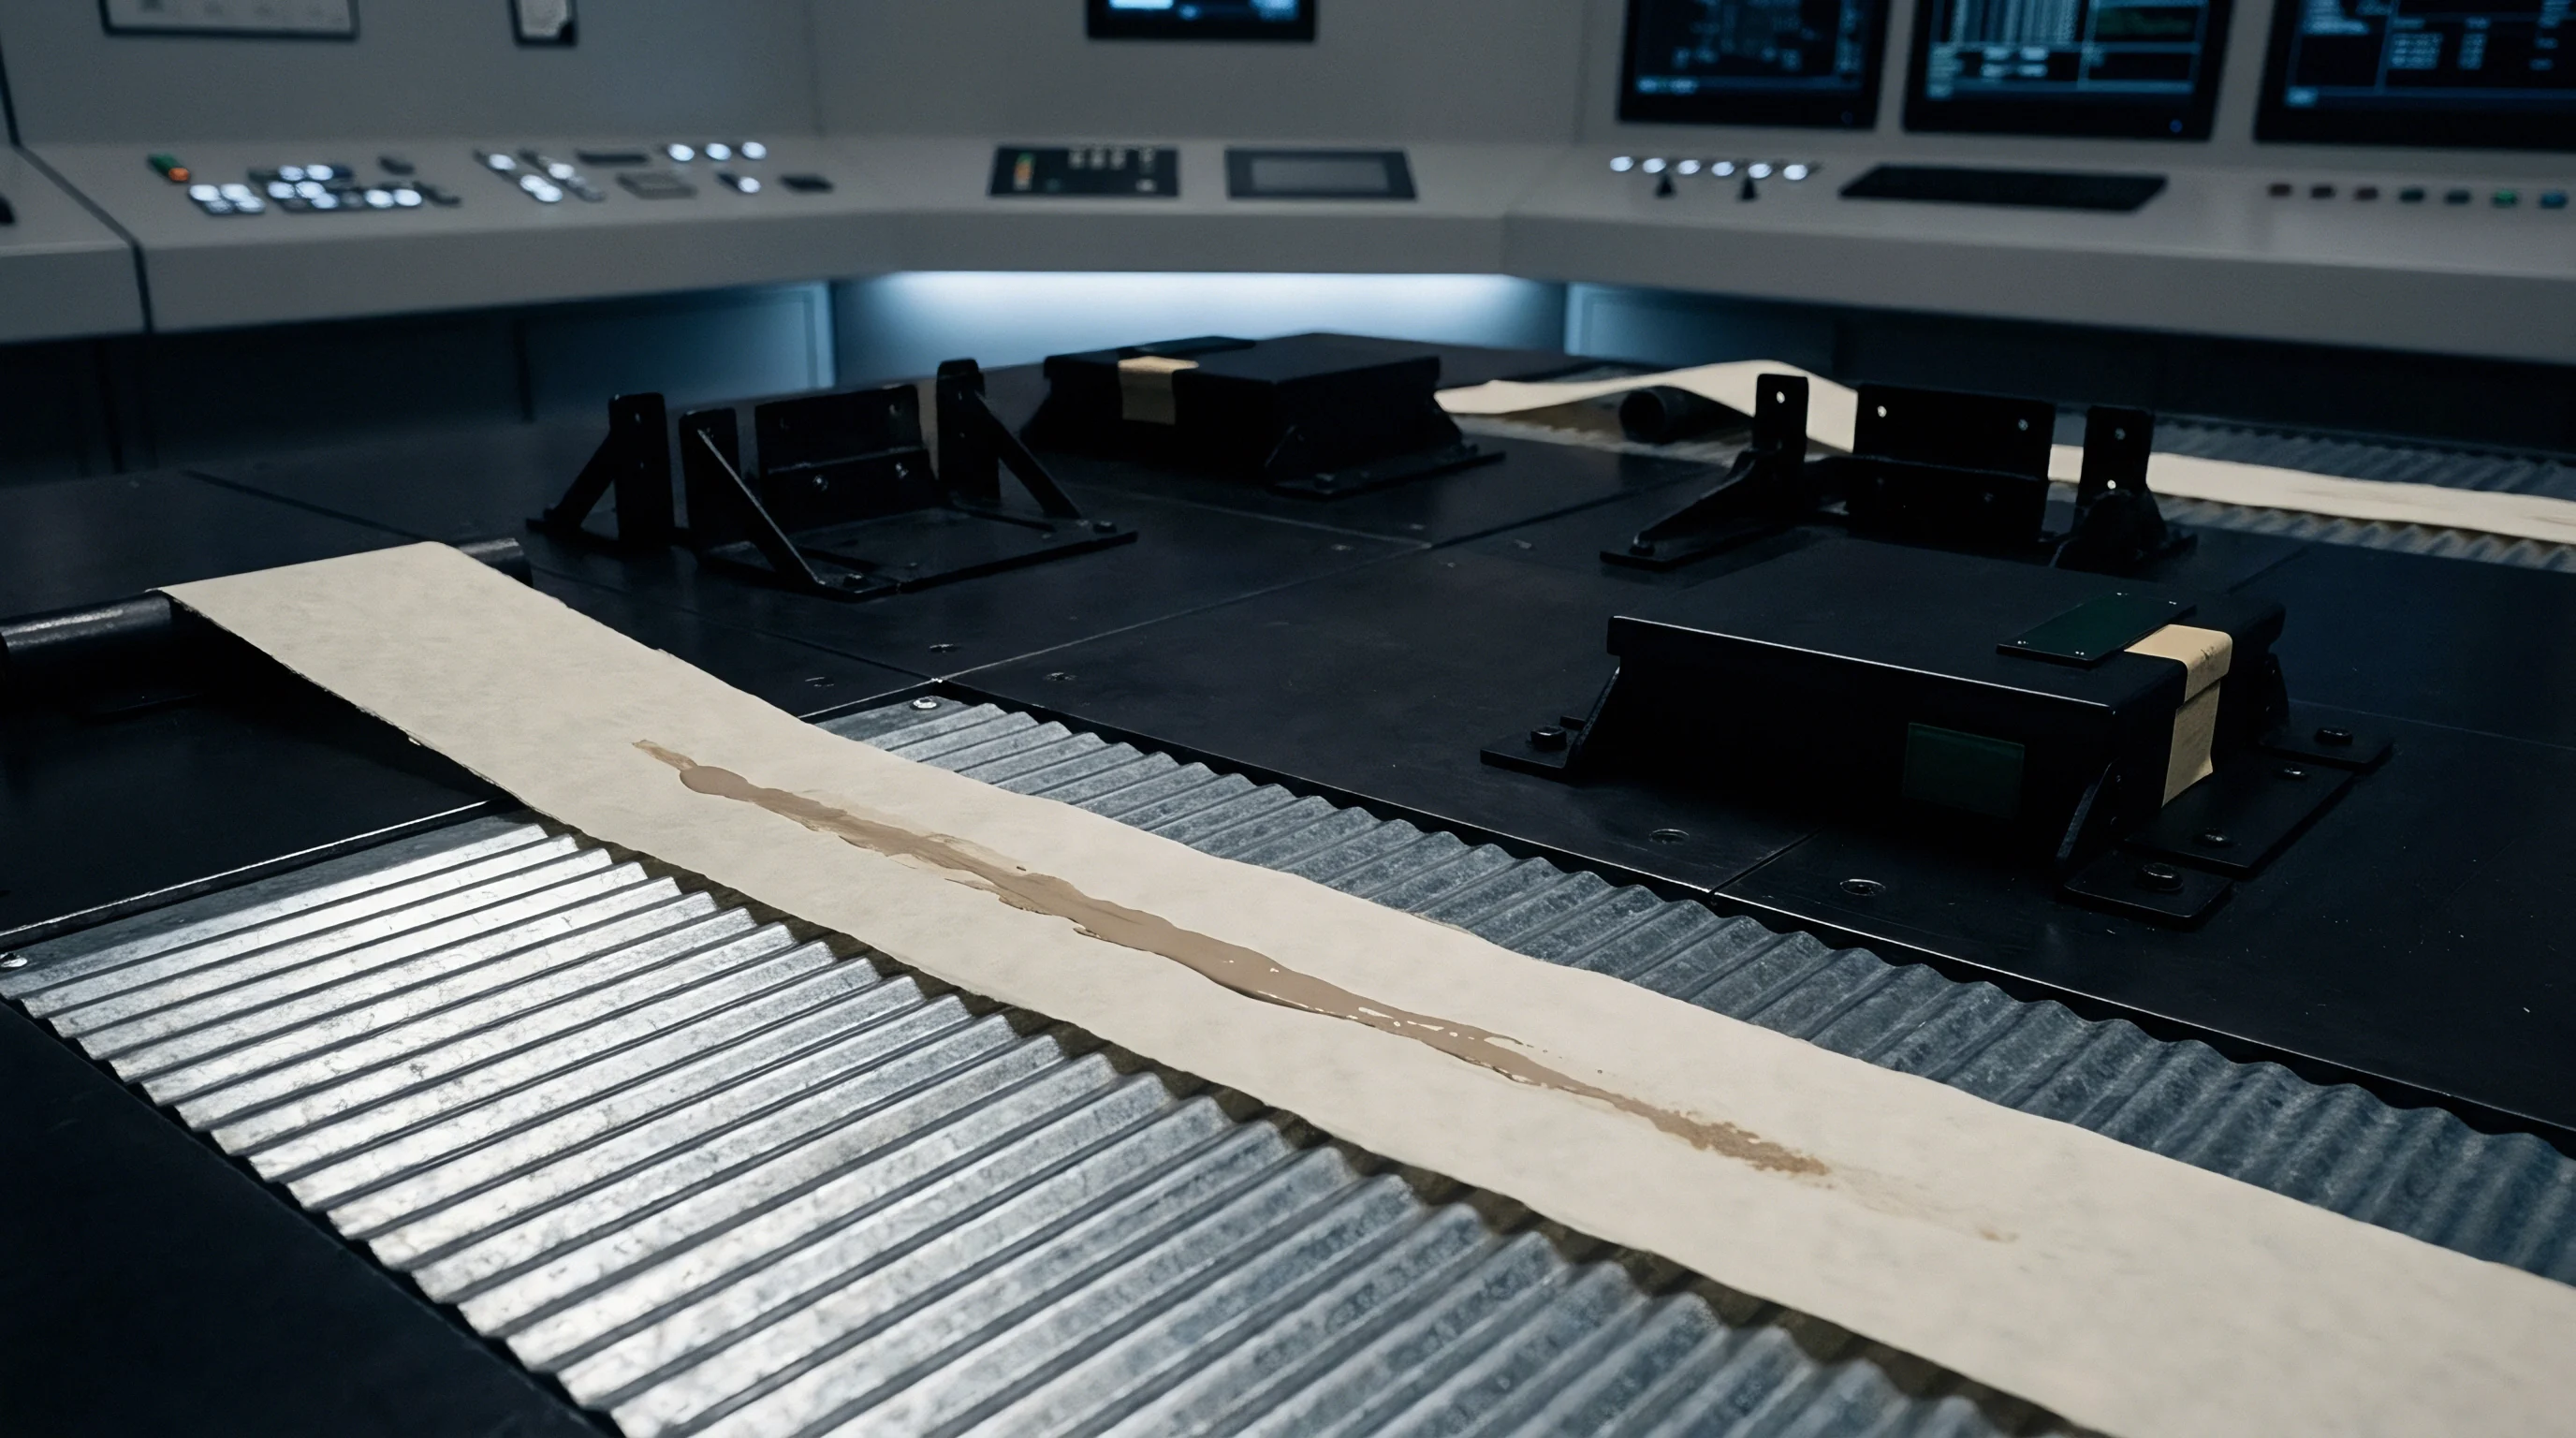
Extracting sub-pixel surface height profiles requires calculating the center of the projected laser line across sensor pixel columns. The standard Center of Gravity (COG) algorithm computes the intensity-weighted mean position of pixels exceeding a pre-set threshold. Though fast, COG algorithms are vulnerable to asymmetric line broadening caused by subsurface scattering.
When light diffuses unevenly into the sheet structure, the intensity centroid shifts toward the direction of photon transport, recording a false surface elevation change.
Advanced line-extraction methods employ Gaussian fitting, parabolic interpolation, or zero-crossing detection of the intensity gradient derivative. Gaussian fit algorithms isolate the primary specular reflection peak from the underlying diffuse scattering tail, isolating the true physical top surface location. Implementing full Gaussian curve fitting requires substantial computational bandwidth, often executed via dedicated graphics processing units or hardware-accelerated FPGAs embedded directly within sensor camera housings.
Processing rates must match sensor frame speeds up to 20 kilohertz to maintain spatial continuity along the web direction.
Optical penetration of 650 nm laser light into bleached sulphate board creates a false height offset of up to 18 micrometers compared to mechanical stylus contact measurements under ISO 534 conditioning.
The arithmetic governing optical peak displacement demonstrates the structural magnitude of scattering errors. Consider a red laser line of wavelength λ = 658 nm incident on a bleached folding boxboard substrate with an absorption coefficient μa = 0.05 mm-1 and a reduced scattering coefficient μs’ = 25.0 mm-1. The effective optical penetration depth δp is calculated as:
δp = frac1sqrt3 · μa · (μa + μs’)
Inserting the material parameters yields:
δp = frac1sqrt3 · 0.05 · (0.05 + 25.0) = frac1sqrt3.7575 ≈ 0.515 mm = 515 μ m
This deep photon migration creates a diffuse backscatter halo around the beam core. On a triangulation system angled at thη = 45circ with magnification m = 1.0, a subsurface photon re-emission mean path shift of Δ x = 20 μ m generates an apparent elevation error Δ z of:
Δ z = fracΔ xsin(thη) = frac20 μ msin(45circ) = 28.28 μ m
An undetected elevation offset of 28.28 micrometers exceeds the entire surface roughness range (Sz) of a typical triple-coated boxboard grade, rendering raw red laser profilometry uncorrected for scattering completely invalid for micro-topography evaluation.
Coating Formulation Effects on Laser Penetration Depth
Mineral coatings applied to paperboard substrates alter optical interaction at the surface boundary. Formulations based on ground calcium carbonate (GCC), precipitated calcium carbonate (PCC), kaolin clay, and titanium dioxide (TiO2) introduce distinct refractive index transitions that scatter light near the surface. TiO2 possesses a high refractive index (n ≈ 2.70), restricting light penetration to the uppermost coating layer.
High-opacity coatings effectively shield the underlying fibrous network from optical penetration, reducing line broadening effects on the sensor matrix.
Kaolin clay particles align parallel to the board surface during blade metering, producing an anisotropic scattering structure. Ground calcium carbonate features porous, irregular particle geometries that generate isotropic Rayleigh and Mie scattering. Coated boards combining fine GCC and clay pigment blends display consistent laser reflection profiles, provided the coating weight exceeds 12 grams per square meter per side.
Lower coating weights permit partial light transmission into raw fibers, causing localized variance in optical peak profiles across coated and uncoated surface regions.
Light scattering in cellulose fibers depends heavily on network structure and moisture, with tightly packed short fibers restricting photon spread. At the same time, specular glare can blind optical sensors, while accurate peak height measurement remains critical for setting the print gap.
Whether multi-wavelength illumination combining 405 nm and 785 nm light can decouple true surface relief from subsurface density gradients in highly calendered recycled furnishes remains unproven under continuous mill line speeds.

Web
Continuous paperboard production involves rapid web transport over support rollers, dryer cylinders, and calender stacks. In-line laser triangulation systems operate directly on the moving web, subjecting optical measurements to dynamic mechanical disturbances. Out-of-plane web flutter, machine vibration, roll runout, and tension-induced caliper fluctuations introduce severe low-frequency spatial noise.
Profilometers must separate structural web movement from true micro-topographical surface roughness through precise mechanical isolation, spatial encoding, and signal filtering.
Web speeds on modern board machines range from 200 to 800 meters per minute. High web velocity translates mechanical displacement into rapid temporal frequency shifts recorded by the optical sensor. Uncontrolled web displacement of 1.0 millimeter easily overpowers surface micro-texture variations ranging between 1.0 and 50.0 micrometers.
Maintaining stable spatial resolution demands strict synchronization between sensor exposure timing, line rate acquisition, and web drive rotary encoder pulses.
Out of Plane Mechanical Vibration and Flutter Deconvolution
Continuous paperboard webs act as flexible membranes suspended between machine guide rolls. Aerodynamic drag, boundary layer air currents, and mechanical roll imbalances induce vertical web movement known as web flutter. Flutter frequencies typically occupy the range between 2 Hz and 120 Hz, with displacement amplitudes reaching several millimeters.
Because laser triangulation sensors measure absolute vertical distance from a fixed frame, web flutter superimposes a massive low-frequency wave onto the raw topographical profile data.
Deconvoluting web flutter requires high-pass spatial filtering or differential sensor arrangements. Dual optical heads mounted directly opposing each other on opposite sides of the board web measure total sheet caliper while canceling out-of-plane displacement common to both sensors. When the web moves upward by a distance Δ z, the top sensor measures a decrease in distance -Δ z while the bottom sensor measures an equal increase +Δ z.
Summing both signals yields true localized sheet thickness, while subtracting them isolates web flutter amplitude for active mechanical damping feedback.
Contractual delivery specs referencing ISO 534 caliper tolerances become unenforceable if inline laser triangulation heads lack differential dual-sensor vibration cancellation across open web draws.
Encoder Synchronization and Spatial Domain Resampling
Variable web speed distorts spatial profile reconstruction if sensor data acquisition relies on internal temporal clock timers. Line rates fixed in time cause spatial oversampling when the machine slows down and spatial undersampling when the machine accelerates. To preserve uniform spatial sampling pitch along the machine direction (MD), optical camera frame triggers link directly to high-resolution optical quadrature encoders mounted on web-driven precision measuring rolls.
Encoder pulse multipliers trigger laser camera acquisitions at precise physical distance intervals, such as every 25 micrometers along the web. This spatial synchronization ensures that three-dimensional surface maps maintain true geometric proportions regardless of web speed variations during grade changes or reel turnarounds. Digital signal processors convert spatial point clouds into equidistant grid arrays through cubic spline interpolation, preparing raw elevation data for spatial spectral filtering.
Mechanical vibration distorts height calculations and changing web speeds alter spatial resolution, making sharp optical focus and routine calibration essential for stable profile measurements.
Positioning encoders directly on the web-driven friction roller rather than motor drives prevents mechanical slip artifacts from contaminating spatial measurements. Correct installation of spatial tracking hardware prevents longitudinal distortion in rendered topographic surface maps.
Executing accurate spatial alignment and web noise suppression involves a strict sequence of mechanical and electronic configuration steps:
- Mount the rigid C-frame sensor support bridge directly to foundation steel work isolated from machine floor frame vibrations.
- Install dual-laser triangulation sensor heads in absolute vertical alignment with a targeted optical axis tilt of less than 0.05 degrees.
- Position a high-resolution optical rotary encoder on a non-slip web contact roll immediately adjacent to the optical inspection zone.
- Calibrate the encoder pulse frequency to establish a precise longitudinal spatial trigger interval of 10.0 micrometers per pulse.
- Run a flat polished calibration cylinder through the optical gap to record baseline structural roll runout profiles across the transverse web width.
- Program real-time finite impulse response (FIR) spatial high-pass filters to attenuate spatial frequencies longer than 8.0 millimeters.
- Validate the differential thickness output using certified precision feeler gauge strips during static machine stops.
| Disturbance Source | Frequency / Wavelength Range | Amplitude Scale | Primary Filtering Method |
|---|---|---|---|
| Aerodynamic Web Flutter | 2 to 45 Hz (λ > 100 mm) | 0.5 to 3.0 mm | Differential dual-sensor head cancellation |
| Roll Eccentricity / Runout | 5 to 120 Hz (λ = 10 to 100 mm) | 20 to 150 µm | Real-time FIR high-pass spatial filter (λc = 8.0 mm) |
| Formation Flocculation | λ = 1.0 to 10 mm | 5 to 35 µm | Bandpass spatial decomposition (L-filter) |
| Surface Micro-Roughness | λ = 0.001 to 0.8 mm | 0.2 to 15 µm | Gaussian profile filter per ISO 25178-3 (S-filter) |
Failing to isolate structural roller runout from board thickness variations leads directly to premature sensor recalibration and false rejection of acceptable packaging reels.
Metrics
Converting raw three-dimensional point cloud data from laser triangulation into actionable paperboard quality metrics requires standardized mathematical processing. Conventional single-line stylus roughness parameters (Ra, Rz) fail to capture complex spatial surface features essential to ink transfer and barrier coating continuity. Areal surface texture parameters defined under ISO 25178 provide a comprehensive framework for quantifying paperboard topography, structural void volumes, and surface peak distributions across continuous webs.
Pneumatic air-leak roughness methods, such as Bendtsen (ISO 8791-2) and Parker Print-Surf (ISO 8791-4), measure total air leakage between a flat metal land ring and the paperboard surface under specified clamping pressures. While widely used for mill quality control, pneumatic methods aggregate surface roughness, porous compressibility, and structural air permeability into a single average value. Laser triangulation profilometry decouples physical geometric surface shape from board air permeability, enabling isolated measurement of surface topography.
Areal Topography Parameters under Standardized Filtering
ISO 25178 areal parameters characterize surface texture across three-dimensional spatial domains. The arithmetic mean height (Sa) quantifies overall surface roughness amplitude, while root mean square height (Sq) provides heightened statistical sensitivity to extreme peaks and valleys. Maximum height (Sz) measures the total vertical distance between the highest peak and lowest valley within the evaluation area.
For paperboard buyers, peak height extremes dictate print screen dot stability, while valley depths define coating fill volume requirements.
Functional surface properties rely heavily on skewness (Ssk) and kurtosis (Sku). Skewness measures profile symmetry around the mean plane. Negative skewness (Ssk 0) signifies a surface dominated by sharp peaks, indicative of uncalendered coarse recycled stock.
Kurtosis measures peak sharpness, where values above 3.0 (Sku > 3.0) highlight spiky topography prone to breaching thin extruder laminate films.
Gaussian spatial filters defined under ISO 25178-3 separate micro-texture from macro-wave waviness. The nested filter chain applies a short-wavelength filter (S-filter) to eliminate high-frequency electronic sensor noise, followed by a long-wavelength cutoff filter (L-filter) to remove structural sheet waviness. Standard cutoff selection (λc = 0.8 mm or 2.5 mm) isolates spatial features directly affecting flexographic ink film splitting and gravure cell ink release.

Correlation with Pneumatic Air-Leak Roughness Standards
Translating inline 3D profilometry metrics into legacy pneumatic air-leak parameters requires empirical correlation models calibrated to specific paperboard furnishes. Parker Print-Surf (PPS) measuring head clamping pressures compress structural surface fibers during test execution. Consequently, non-contact laser profilometry records higher uncompressed peak-to-valley distances than those reported by PPS instruments operating under 0.5, 1.0, or 2.0 MPa clamping forces.
Mathematical transformation models predict equivalent PPS values from laser-derived areal mean square height (Sq) and mean void volume (Vv). Under uncompressed conditions, open surface pores transmit significant airflow under pneumatic measuring lands. Integrating surface valley volume (Vvv) below the 80th percentile material ratio plane yields close linear correlation with PPS roughness across solid bleached sulfate and folding boxboard grades (r2 > 0.92).
Highly compressible recycled boards exhibit non-linear correlation due to elastic fiber deformation occurring exclusively under physical clamping loads.

Predicting Liquid Barrier Pinholing from Topographical Extremes
Extrusion coating polyolefins or bio-polymer barrier films onto paperboard requires continuous pinhole-free liquid containment. Severe surface valley depressions or protruding high-rigidity fibers breach thin polymer melt films, causing barrier failure in liquid packaging cartons. Inline laser profilometry detects extreme topographic anomalies prior to extrusion coating application, permitting dynamic adjustments in extruder die gap or melt curtain weight.
Extrusion barrier risk indexes combine maximum peak height (Sp) and maximum valley depth (Sv) within localized 10-millimeter spatial blocks. Surface valleys exceeding 1.5 times the nominal applied polymer film thickness trigger automated warnings to the coating line operator. Catching topographical defects inline prevents thousands of meters of defective coated board from entering converting streams.
| Paperboard Grade | PPS Roughness (1.0 MPa) | Laser Areal Roughness (Sa) | Laser Void Volume (Vvv) | Correlation Coefficient (r2) |
|---|---|---|---|---|
| Solid Bleached Sulfate (SBS) | 1.1 to 1.8 µm | 1.8 to 2.6 µm | 0.8 to 1.4 cm³/m² | 0.94 (Linear) |
| Folding Boxboard (FBB) | 1.8 to 2.8 µm | 2.9 to 4.2 µm | 1.6 to 2.8 cm³/m² | 0.91 (Linear) |
| Coated Unbleached Kraft (CUK) | 2.2 to 3.5 µm | 3.8 to 5.6 µm | 2.5 to 4.1 cm³/m² | 0.87 (Power Law) |
| Coated Recycled Board (CRB) | 3.0 to 4.8 µm | 5.2 to 8.1 µm | 4.0 to 7.2 cm³/m² | 0.82 (Polynom) |
Surface void volume measured under zero clamping pressure correlates directly to gravure print dot loss on unbleached kraft substrates.
Establishing cutoff wavelength thresholds based on the target ink film thickness of the converting line eliminates low-frequency web formation noise while preserving micro-topographical peaks that disrupt ink transfer.
System failure modes in inline optical profilometry stem from optical, mechanical, and computational constraints:
- Optical Saturation Blindness occurrence takes place when specular glare from high-gloss coating spots overwhelms sensor dynamic range, corrupting local height extraction calculations.
- Subsurface Photon Migration happens when coherent red laser light diffuses deep into bleached pulp fibers, distorting apparent surface baseline elevation profiles.
- Mechanical Flutter Contamination manifests when low-frequency web movement overpowers physical surface micro-roughness signals, demanding real-time differential sensor cancellation.
- Thermal Drift Distortion emerges when heat from machine dryer sections shifts sensor alignment structures, causing calibration drift across extended production runs.
- Transverse Encoder Slip arises when measuring wheel friction drops, generating spatial compression artifacts in machine-direction profile reconstruction.
Procuring and commissioning inline laser triangulation systems demands clear contractual verification guidelines:
- Optical Wavelength Specification mandates the installation of 405-nanometer blue-violet laser diodes to suppress fiber light penetration.
- Spatial Resolution Bounds establishes mandatory minimum transverse pixel sampling pitch of 20 micrometers and elevation resolution of 0.5 micrometers.
- Dynamic Flutter Suppression guarantees dual-sensor differential path processing capable of canceling 2.0-millimeter web displacement at 100 Hz.
- Standard Filter Compliance certifies software compliance with ISO 25178-3 Gaussian filter algorithms for spatial decomposition.
- Real-Time Output Latency sets maximum signal processing delay to under 50 milliseconds for downstream defect marking integration.
Standard delivery contracts incorporating ISO 25178-2 Clause 4.1.3 replace single-point pneumatic roughness limits with areal peak-to-valley height caps, shifting liability to mills when surface voids exceed printing ink film thickness.
Tonnage
Inline laser triangulation profilometry converts physical surface measurements into direct commercial leverage during paperboard procurement and converting operations. Paperboard stock is purchased by weight but converted by area, making bulk, caliper uniformities, and surface smoothness primary drivers of yield economics. Real-time surface topography monitoring allows mills to optimize coating formulation weights, refine calender nip pressures, and maintain tight caliper bands without over-specifying raw fiber content.
Converter floor spoilage drops significantly when mill reels arrive backed by complete continuous surface topography dossiers. Print defects caused by surface voids, rough spots, or coating streaks are identified during mill winder rewinding rather than during high-speed multi-color offset printing. Incorporating inline surface data into procurement specifications shifts quality control from destructive offline sample testing to complete reel-length verification.
Yield Optimization via Real-Time Caliper and Surface Monitoring
Board mills historically run target calipers above nominal specification minimums to avoid shipping out-of-spec thin stock. This safety margin consumes excess fiber, increasing grammage and raising raw material costs per thousand packaging blanks. Continuous dual-head laser triangulation profiling provides high-precision caliper tracking across the full web, enabling mill operators to shift average production caliper closer to the minimum contractual specification edge.
Lowering grammage by 3 percent while maintaining target caliper through optimized refining and bulking additives yields substantial raw material cost savings. For a mill producing 200,000 tonnes per annum of folding boxboard, a 3 percent fiber reduction preserves 6,000 tonnes of virgin pulp annually. Converter buyers benefit through increased sheet yields per tonne of delivered stock, lowering unit packaging costs across high-volume production runs.
Commercial Clauses for Real-Time Surface Quality Guarantees
Paperboard supply contracts traditionally specify roughness limits based on benchtop Parker Print-Surf or Bendtsen tests performed on one sample sheet per reel. A single physical sample represents less than 0.001 percent of the total paperboard surface area in a 5-tonne reel. Localized surface defects, calendar scabs, or blade streaks occurring between sample cuts escape laboratory detection, causing unexpected press downtime on converter floors.
Modern procurement contracts mandate continuous automated roll surface profiles supplied as digital reel maps. Technical specifications establish maximum allowable surface void volumes (Vvv), peak height caps (Sz), and spatial defect counts per 10,000 linear meters. Reels exhibiting surface parameters outside contract boundaries are automatically flagged for rejection or downgraded to lower-duty packaging applications prior to shipment, eliminating freight costs on non-conforming stock.
Sensor data rates bound operational line speeds, while coating weight and surface pore structure dictate optical absorption and resin uptake. Where air-leak instruments report only average flow across a contact ring, high-frequency optical measurements isolate true microtexture.
A substrate buyer who verifies surface topography through continuous inline measurement maintains stronger leverage during grade substitution discussions than a buyer relying solely on mill laboratory certificates.