Optical Triangulation versus Air Leak Roughness Testing in Boxboard Quality Control
Air leak testing measures functional board compressibility under print impression, while optical triangulation isolates non-contact geometrical surface defects.


Aperture
Air leak measurements quantify the volume of compressed gas escaping between a polished steel measuring land and a board sample. The geometry of the measuring head defines a static boundary ring against the fibrous surface. Fluid dynamics under pressure govern the flow rate, making the air escape volume a composite function of physical surface topography and internal pore structure.
Laser triangulation measures distance without physical surface engagement. A narrow coherent light line projected across the web projects a profile onto a digital sensor array, converting spatial photon displacement into discrete elevation coordinates.
Evaluating multi-ply boxboard requires isolating structural compressibility from true geometric surface height. Uncoated solid bleached board and double-coated folding boxboard present different surface boundaries to measuring instruments. When an air leak measuring land presses against a board surface, flexible surface fibers and compressible coating layers deform under mechanical load.
The measured roughness value reflects this compressed state rather than the undisturbed surface state. Laser optical sensors capture the undisturbed geometric envelope of the top liner, recording every peak, valley, and spatial ridge without altering the substrate thickness or closing surface voids.

Pneumatic Leakage Mechanics
Fluid flow through the boundary gap between a metallic measuring ring and a fibrous web follows the radial laminar flow equations for narrow channels. Parker Print-Surf testing forces air through an annular gap defined by a clamping land width of 51 micrometers and a defined clamping load. The volumetric flow rate increases with the cube of the average gap height according to Poiseuille flow relationships.
Small micro-roughness variations generate disproportionately large changes in measured flow rate. Air leaks laterally through open surface pores and sub-surface inter-fiber voids within the top liner, artificially inflating the apparent roughness figure on highly porous recycled substrates.
Optical Beam Geometries
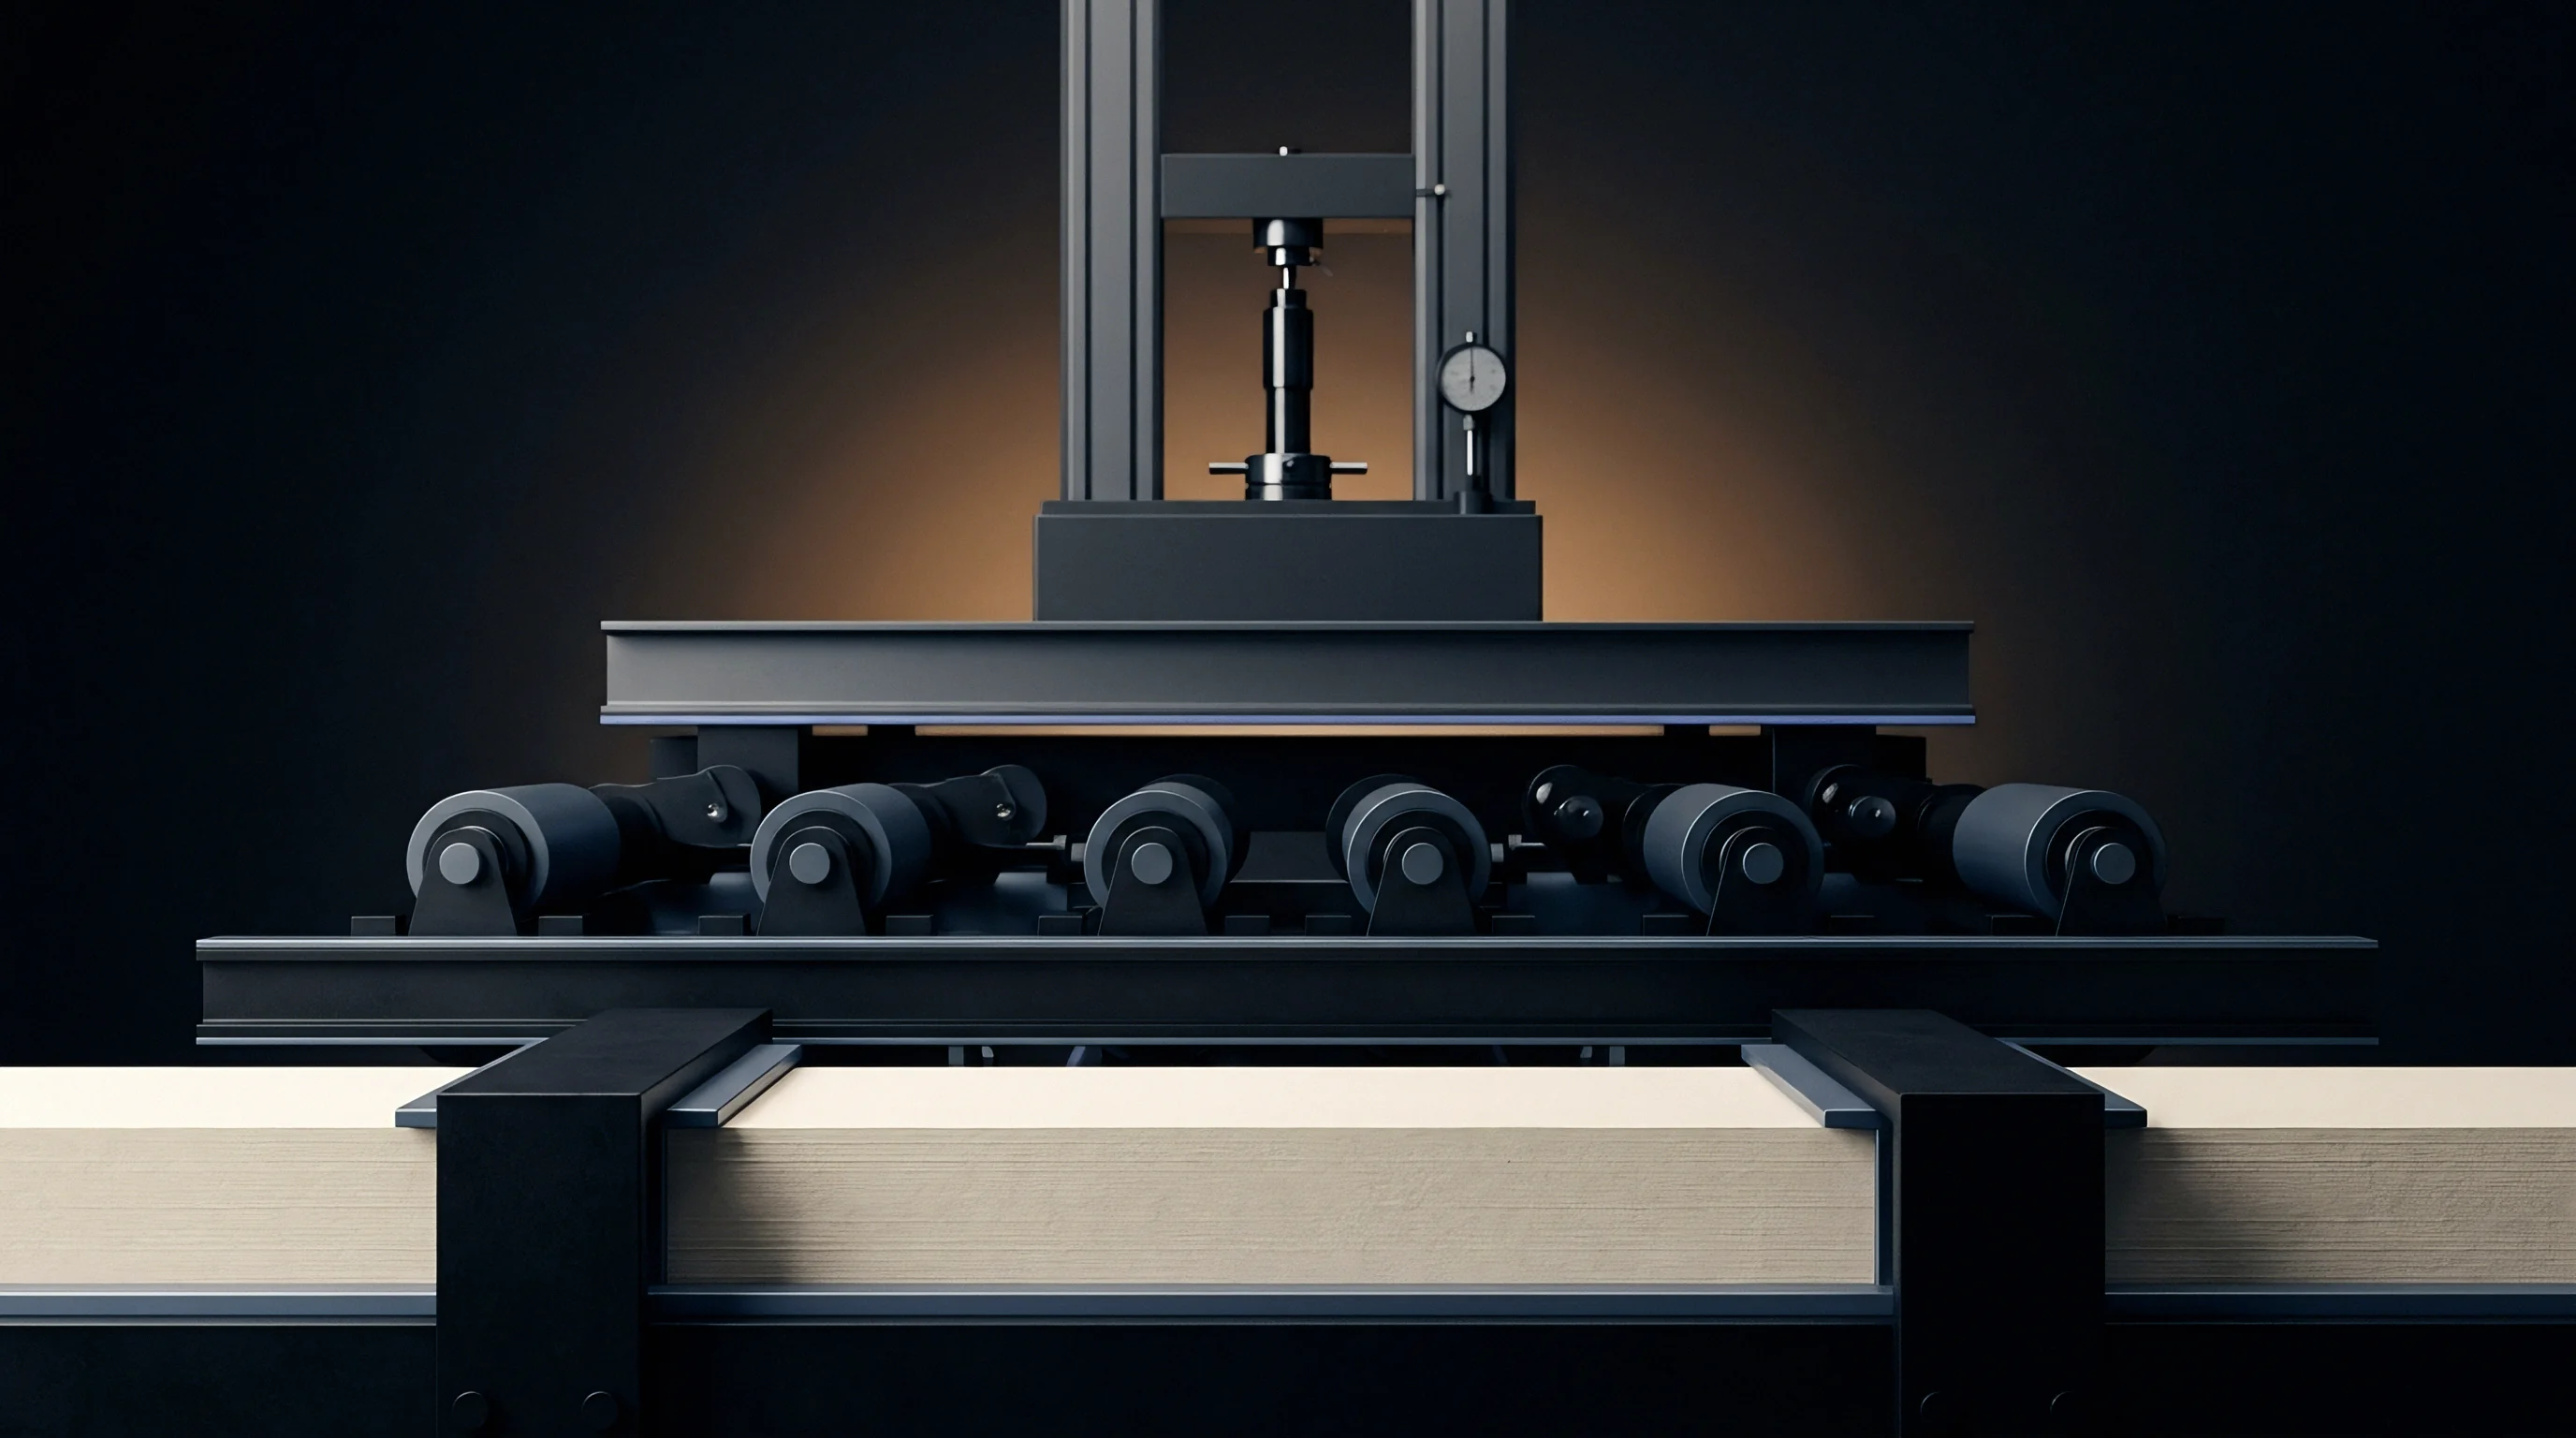
Non-contact measurement directs a focused coherent beam or broadband light spot onto the substrate at a defined incident angle. Displacement of the reflected beam image across a complementary metal-oxide-semiconductor sensor array directly yields localized height values (z) as a function of lateral position (x, y). Laser triangulation systems utilize line optics to profile thousands of spatial points concurrently across a web width.
Resolution limits depend on spot size, optical magnification, sensor pixel density, and speckle pattern noise generated by light scattering within translucent bleached hardwood pulp fibers.
Selecting an inappropriate assessment method for high-speed gravure or flexographic conversion leads to severe quality failures. Relying exclusively on optical topography misses sheet compressibility effects that mitigate roughness under printing impression cylinders, causing buyers to reject functional lots. Relying exclusively on air leak instruments masks localized single-point deep pits and micro-scratches that cause missing print dots and barrier coating pinholes, resulting in total packaging rejection on the fill line.


Topography
Surface height distributions across boxboard substrates reflect both raw furnish formation and post-calendering blade coating profiles. Standardized testing framework ISO 8791-4 defines Parker Print-Surf roughness (PPS) as the calculated mean air gap in micrometers between an annular land and the board sample. Standardized surface texture methodology ISO 25178 defines non-contact three-dimensional areal parameters, extending linear roughness metrics into spatial surface characterization.
Translating between air leak micrometer values and areal laser height parameters (Sa, Sz, Ssk, Svk) requires accounting for measurement scale, spatial filtering, and sample compression mechanics.
Surface Texture Parameters
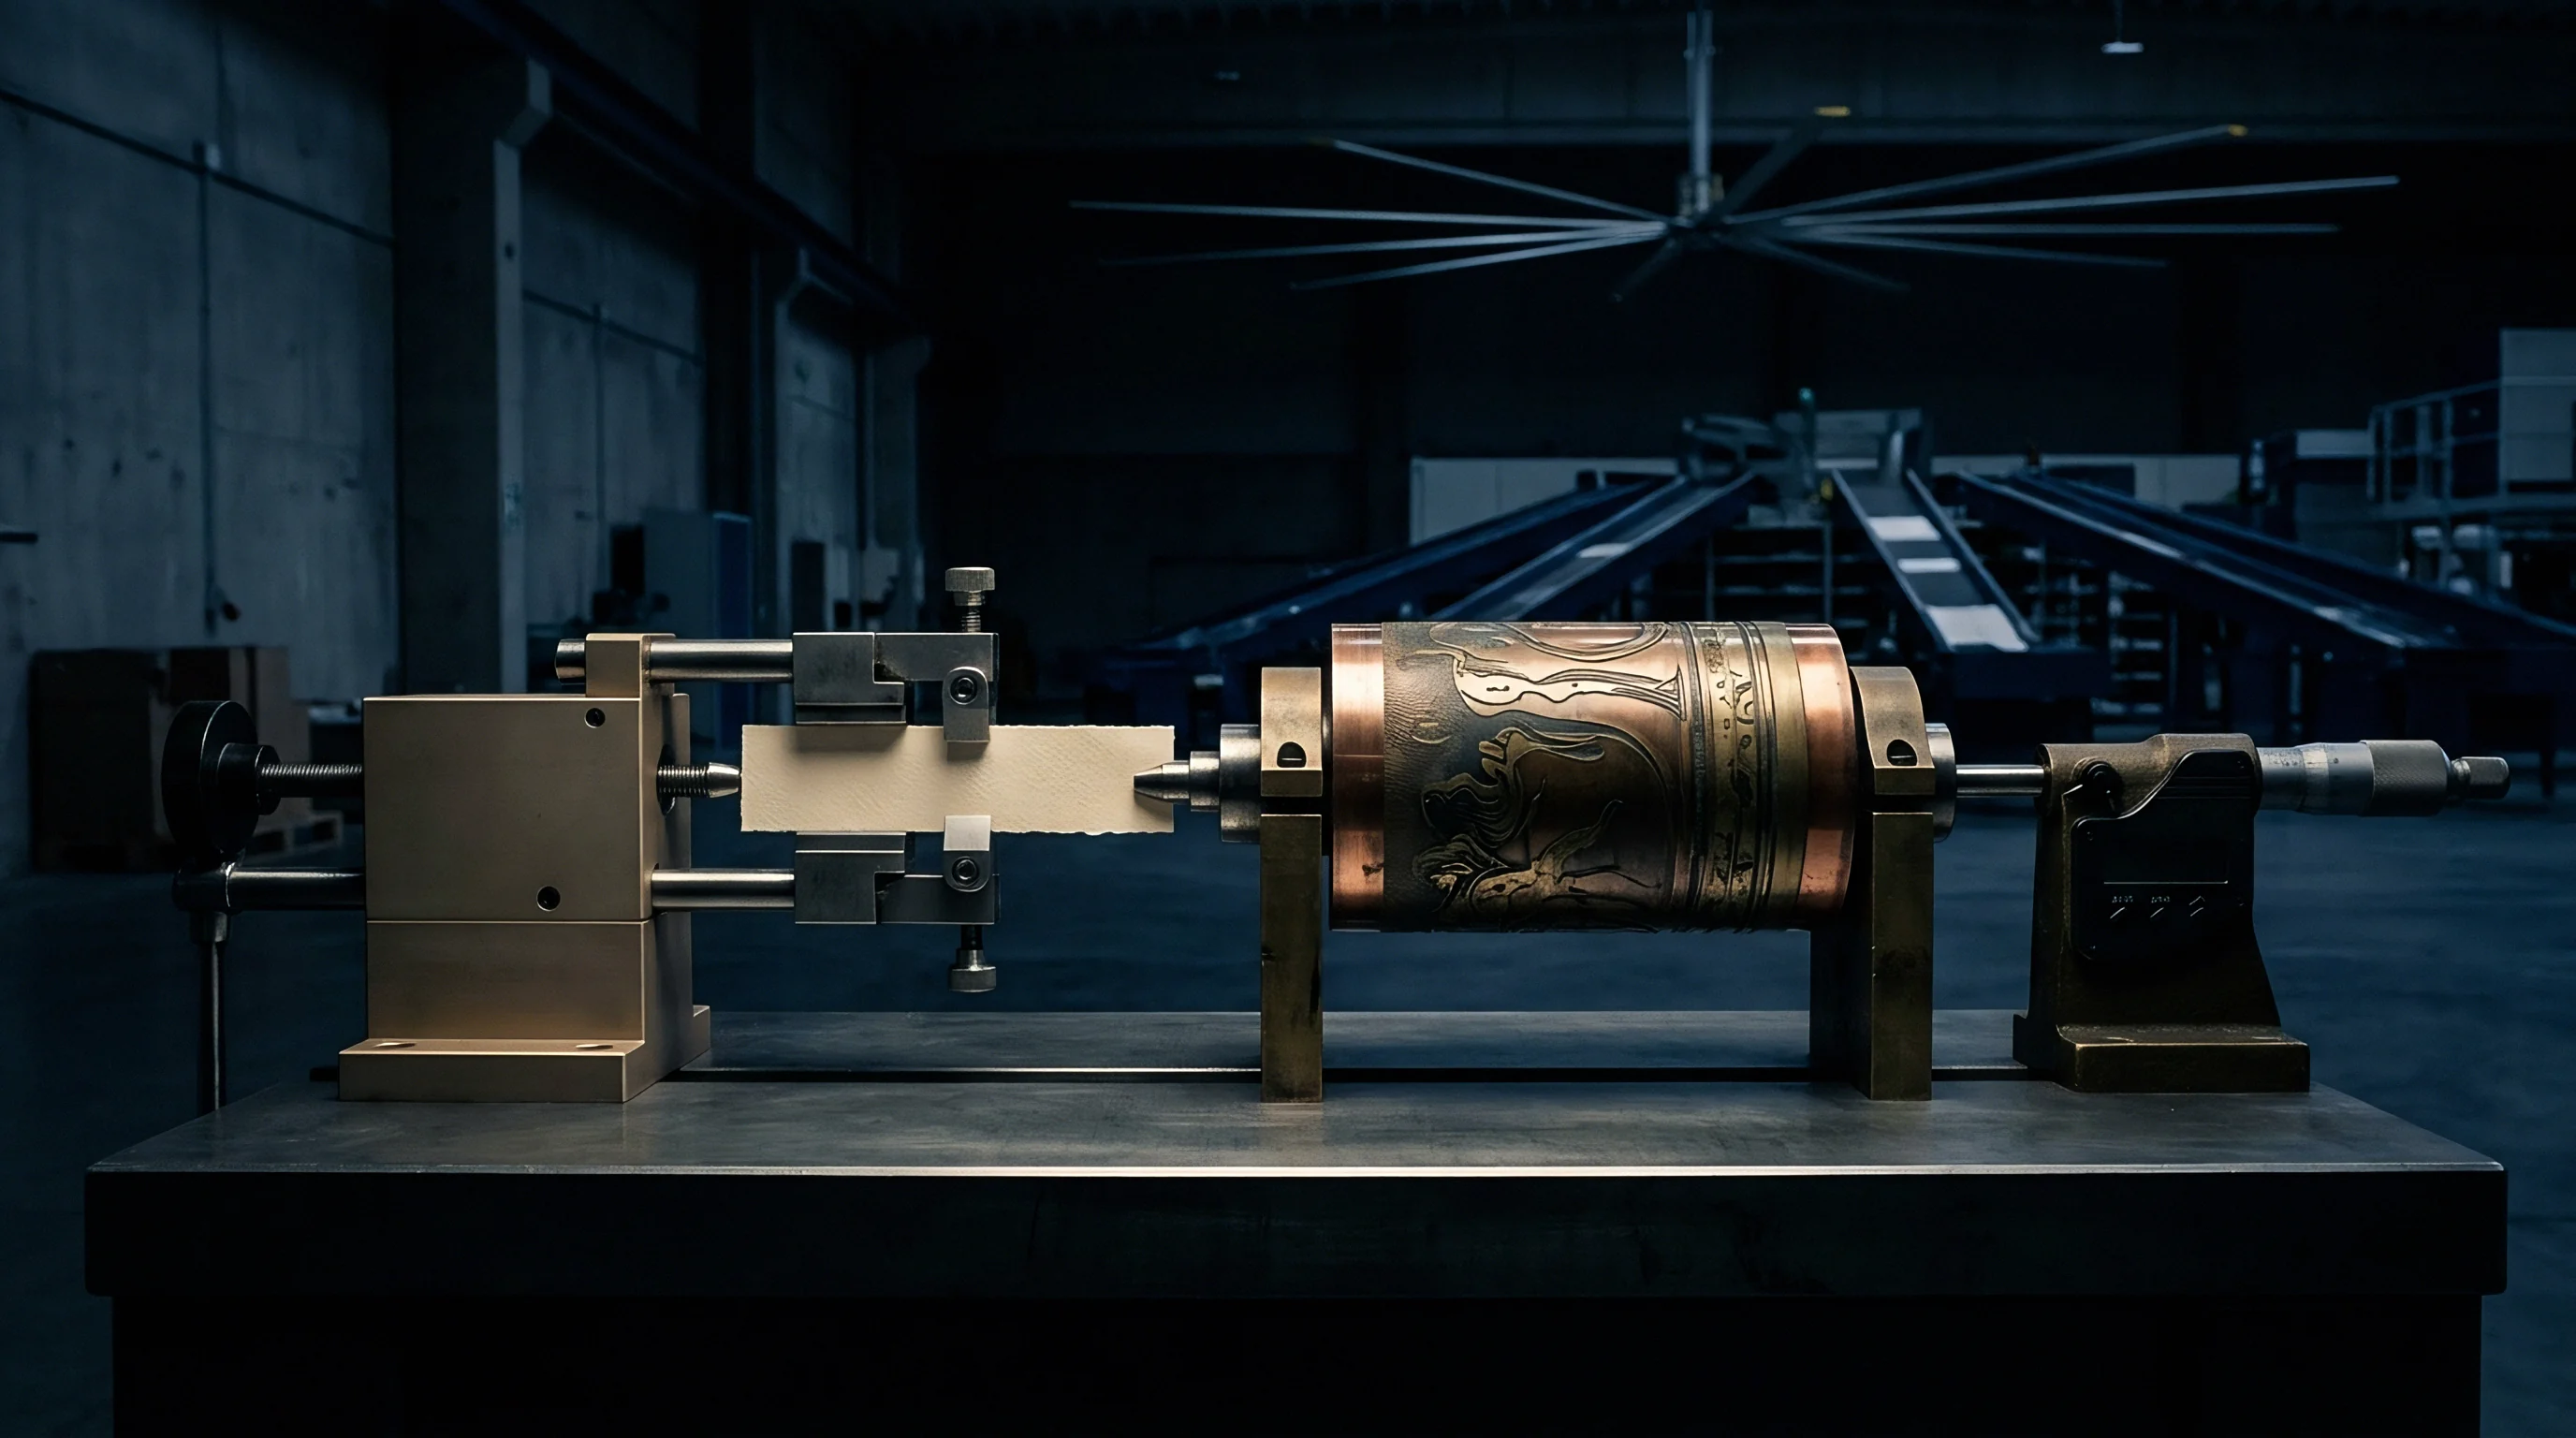
Stylus and laser profiling data convert three-dimensional spatial coordinates into standardized statistical indices under ISO 25178. Arithmetic mean height (Sa) averages surface absolute departures across a defined areal region, providing a global smoothness figure. Root mean square height (Sq) magnifies sensitivity to extreme surface peaks and deep dale valleys.
Skewness (Ssk) measures the asymmetry of the surface profile height distribution. Negative skewness indicates a flat plateau surface punctuated by deep porous valleys, typical of blade-coated folding boxboard. Positive skewness reflects a surface dominated by sharp protruding fiber peaks, characteristic of un-calendered recycled board liners.
| Assessment Method | Standard Reference | Contact Pressure | Spatial Resolution | Primary Output Metric |
|---|---|---|---|---|
| Parker Print-Surf (PPS) | ISO 8791-4 | 0.5 to 2.0 MPa | 51 μm land width | Mean roughness gap (μm) |
| Bendtsen Air Leak | ISO 8791-2 | 1.47 kPa head load | 0.15 mm land width | Airflow rate (mL/min) |
| Laser Line Triangulation | ISO 25178-2 | 0.0 kPa (Non-contact) | 10 to 25 μm spot size | Areal parameter (Sa, Sz in μm) |
| Chromatic Confocal Sensing | ISO 25178-602 | 0.0 kPa (Non-contact) | 1.0 to 3.0 μm optical spot | Topographic profile map (z(x,y)) |
| Test condition note: Air leak methods require standard conditioning under ISO 187 at 23 degrees Celsius and 50 percent relative humidity; soft synthetic backing pads used for PPS testing imitate resilient printing blankets. | ||||

Air Leak Scale Metrics
Parker Print-Surf values express an equivalent uniform mean air gap height measured in micrometers under defined clamping pressures. Bendtsen instruments quantify airflow volume in milliliters per minute escaping across a wider land surface at low pressure. The mathematical relationship between air leak roughness and true laser profile height shifts based on coating formulation and baseboard porosity.
Blade coater operations fill broad topographic valleys while leaving micro-porosity open, producing lower optical roughness figures than air leak readings suggest. Laser light scatters.
Parker Print-Surf measurements recorded at 1.0 MPa clamping pressure on 300 gsm folding boxboard yield average roughness values 0.45 micrometers lower on soft rubber backing compared to hard synthetic backing under identical conditioning at 23 degrees Celsius and 50 percent relative humidity.
Filtering algorithms establish the spatial boundaries separating high-frequency micro-roughness from long-wavelength web waviness. Optical triangulation software applies Gaussian filters with defined cut-off wavelengths (λc), typically set at 0.8 millimeters or 2.5 millimeters for paperboard quality control. Micro-roughness impacts ink dot trapping and gloss distribution, while long-wavelength waviness creates visual mottle and uneven varnish acceptance.
Air leak testing cannot separate spatial wavelengths, combining micro-roughness peaks and macro-waviness valleys into a single unrefined flow rate figure.
Substrate specifications drafted for packaging procurement define compliance boundaries through reference standards. A standard quality clause specifying board delivery requires that Parker Print-Surf roughness measured per ISO 8791-4 at 1.0 MPa soft backing pressure shall not exceed 1.20 micrometers across all reel positions, and any batch demonstrating a standard deviation greater than 0.08 micrometers across ten random reel positions shall be deemed non-conforming without requiring pressroom trial proof.

Clamp
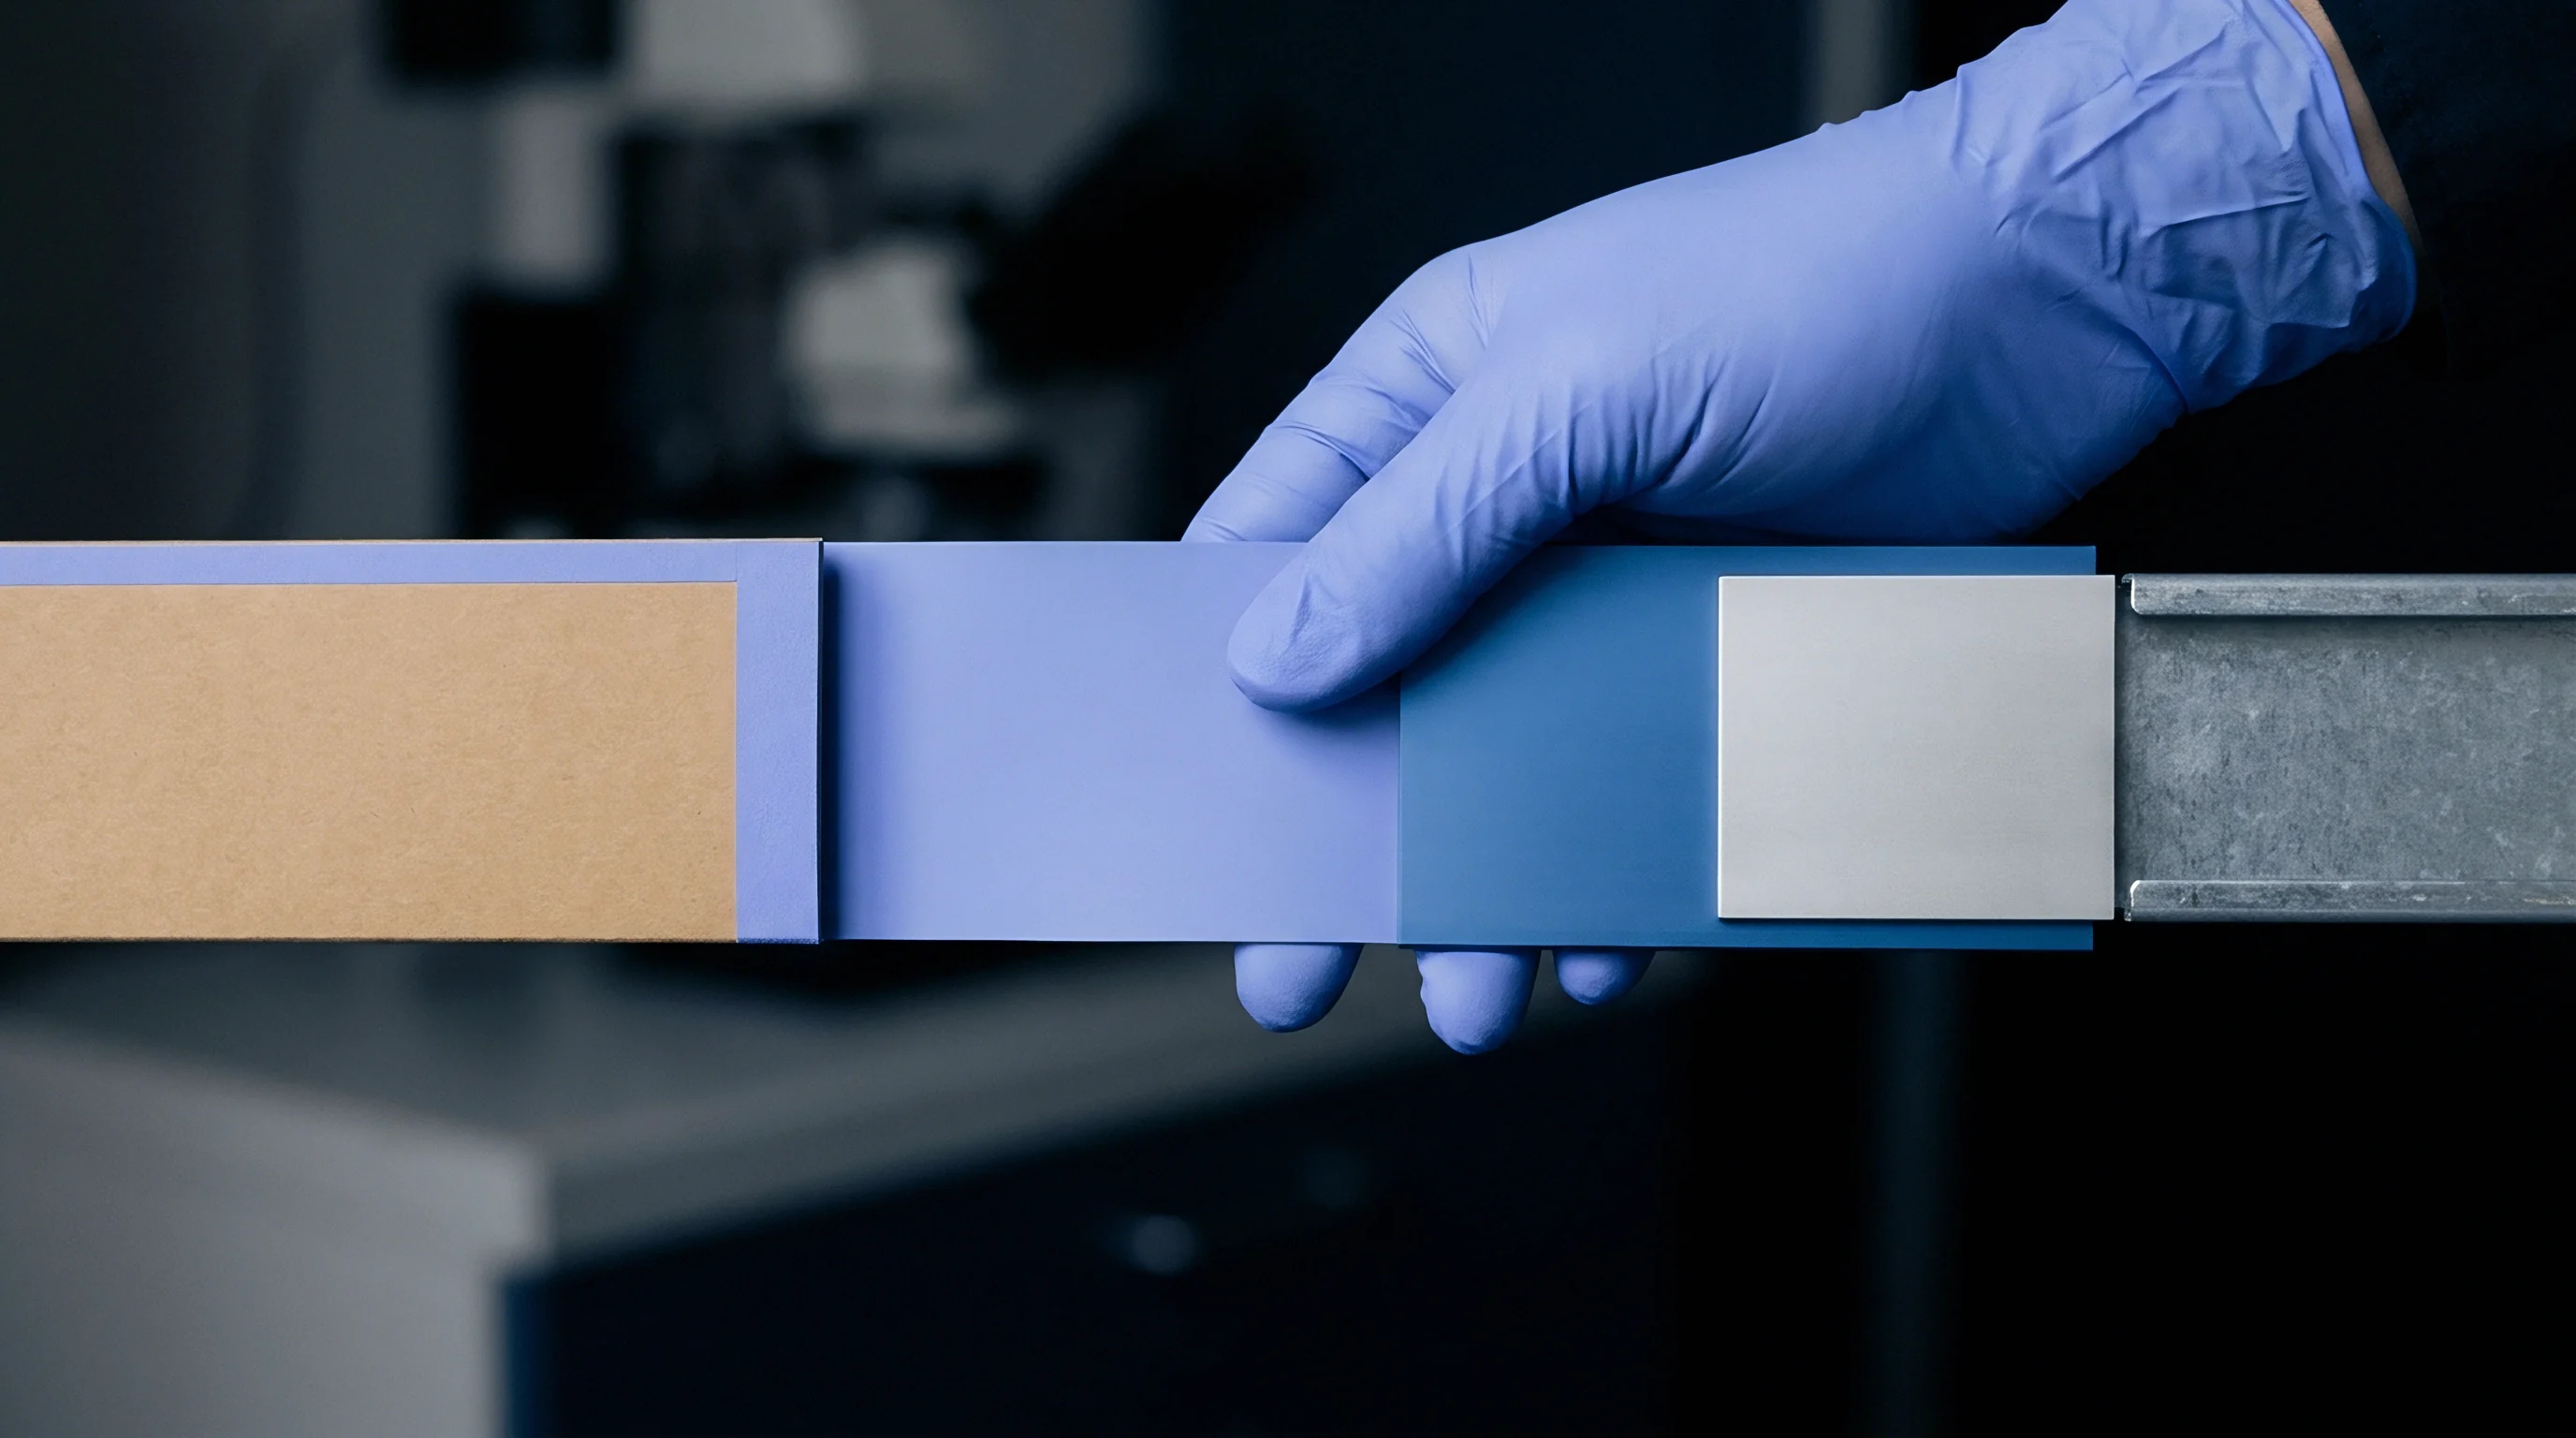
Mechanical load application during laboratory testing introduces structural deformation into multi-ply boxboard structures. Clamping heads in air leak instruments apply uniform pneumatic loads ranging from 0.5 MPa to 2.0 MPa against resilient rubber or rigid metal backings. Soft backings compress the board surface against the measuring land, simulating the mechanical compression occurring inside an offset or flexographic printing nip.
Laser triangulation systems bypass physical clamping entirely, scanning the free-standing board web under ambient mechanical tension without changing sheet caliper or distorting fiber networks.

Why Does Pneumatic Clamping Distort Recycled Multi-Ply Board?
Waste paper furnishes contain shortened, recycled cellulose fibers and elevated void volumes that collapse under localized compressive force. Multi-ply coated recycled board consists of mechanical pulp cores sand-wiched between recycled fiber layers and mineral coating films. Pneumatic pressure collapses the low-density inner ply core during test sequence execution, lowering the measured gap height at the measuring ring.
Caliper drops rapidly. The measured air leak roughness drops artificially on low-density bulky boards, obscuring real topographical roughness that emerges when printing nips operate under lighter impression forces.
Evaluating test instrument suitability requires examining specific mechanical failure modes during goods-in quality verification and mill line operations.
- Core Z-direction collapse occurs when pneumatic clamping pressure exceeds the internal bond strength of low-density recycled middle plies, altering caliper permanently along the measurement perimeter.
- Coating layer crushing occurs when high localized contact pressure fractures brittle calcium carbonate or clay coating matrix structures on folding boxboard surfaces.
- Lateral air channeling develops when air escapes through open edge cuts or sub-surface porous voids rather than passing over surface peaks under the measuring land.
- Optical speckle blooming arises when coherent laser radiation penetrates deeply into unpigmented bleached softwood fibers, causing false elevation spikes in digital terrain maps.
- Web flutter distortion manifests during inline high-speed laser scanning when tension variations deflect the board web outside the calibrated focal depth range of optical sensors.
Technical delivery specifications referencing ISO 8791-4 bind the supplier to a maximum allowable air leak roughness tolerance band, rendering off-spec lots rejectable at goods-in without requiring downstream print trial evidence.

Contact Compression versus Static Web Measurement
Discrepancies between bench test values and converted print quality frequently trace back to sheet resilience under physical impression loads. Fiber z-directional compressibility allows rough, un-calendered board liners to yield flat, printable surfaces under offset impression cylinders operating at 2.0 MPa nip pressure. Air leak testing at matching pneumatic loads captures this functional flattening directly.
Non-contact optical triangulation records the uncompressed, elevated profile of the free surface, identifying micro-topographic peaks that compress completely during printing operations. Roughness drops.
Mill technical sales departments routinely explain discrepancies between optical profiling maps and high air leak reject reports by claiming that non-contact laser measurement isolates irrelevant uncompressed topography while air leak instruments measure true functional sheet smoothability under realistic converting impression forces.

Printability
Substrate smoothness dictates the fidelity of liquid ink application and film transfer across lithographic, flexographic, and gravure converting operations. Incomplete contact between fluid ink films and boxboard surfaces causes dot gain variation, missing gravure dots, ink mottle, and flexographic haloing defects. Functional barrier coatings applied to food-service board demand defect-free, pinhole-free film continuity.
Achieving continuous coating films over variable surface topography requires selecting measurement systems that detect specific visual and structural surface anomalies before converting takes place.

Barrier Coating Uniformity and Pinhole Defect Mechanics
Functional aqueous dispersion coatings require continuous film integrity to prevent water vapor, grease, and mineral oil migration through the substrate. Coating blades meter liquid dispersion over top liner fibers, depositing wet film thicknesses between 8 and 15 micrometers. Isolated peaks in the baseboard topography protruding above the wet coat weight create thin spots and bare fibers, establishing liquid migration pathways.
Optical triangulation maps maximum peak heights (Sz) and deep dale volumes (Svk), identifying localized baseboard defects that cause barrier breakdown. Air leak instruments average flow across broad surface areas, failing to detect isolated high-amplitude fiber peaks that breach thin functional barrier layers.
A worked example demonstrates the qualification arithmetic for a 350 gsm coated folding boxboard specification intended for aqueous dispersion barrier coating. Assume a target dry coat weight of 10 grams per square meter, corresponding to a wet film thickness of 12.0 micrometers deposited by a trailing blade coater. Assume a mill batch exhibits a mean Parker Print-Surf roughness of 1.10 micrometers with a standard deviation of 0.05 micrometers, indicating compliant air leak parameters.
Non-contact optical profiling across a 50 millimeter square sample area reveals a mean surface roughness (Sa) of 0.85 micrometers, but records a maximum peak-to-valley height (Sz) of 18.5 micrometers caused by sparse coarse mechanical pulp shives in the under-liner. Because the maximum topographic peak height exceeds the 12.0 micrometer wet coating film thickness, barrier pinhole density reaches 45 defects per square meter despite flawless air leak test scores. Roughness measurement protocols relying solely on averaged air leak figures fail to prevent barrier coating rejection in this converting application.
Ink Transfer and Missing Dot Correlations
Gravure cells and flexographic photopolymer plates demand direct mechanical intimacy with the top liner surface to transfer fluid droplets consistently. High-speed rotogravure presses drop dots into board valleys. Missing dots occur when topographic depressions exceed the fluid bridge limit of ink droplets held within gravure cells.
Pores collapse under load.
| Converting Defect | Primary Mechanism | Air Leak Sensitivity | Optical Profiling Sensitivity | Critical Threshold Band |
|---|---|---|---|---|
| Gravure Speckle | Incomplete ink cell contact in profile dales | Moderate (PPS > 1.5,μm) | High (Svk > 2.2,μm) | Svk depth relative to ink film thickness |
| Flexo Haloing | Excess impression force on elevated peaks | Low (Averages profile out) | High (Sz > 12.0,μm) | Peak height variance across 10 mm length |
| Offset Varnish Mottle | Uneven liquid absorption across surface | Moderate (Air bypasses pores) | High (Ssk asymmetry) | Ssk > 0.5 skewness index shift |
| Barrier Pinholes | Substrate peaks piercing wet coating film | Low (Flow averages topography) | High (Sz and peak count) | Sz > wet coating film thickness |
Substrates exhibiting high spatial waviness accept gravure liquid ink evenly under heavy impression cylinders, whereas sharp micro-roughness peaks puncture the wet ink film regardless of print pressure.
Implementing rigorous quality verification on converting lines requires following a standardized verification sequence prior to approving mill production lots.
- Sample three full-width web strips across the front, center, and back positions of the delivered pallet shipment.
- Condition all samples inside a climate control chamber maintained at 23 degrees Celsius and 50 percent relative humidity for 24 hours per ISO 187.
- Execute ten Parker Print-Surf roughness measurements per sample strip at 1.0 MPa clamping pressure using soft synthetic backing pads.
- Scan a 20 millimeter by 20 millimeter areal region on each strip using a calibrated 3D chromatic confocal or laser triangulation profiler.
- Calculate ISO 25178 areal parameters Sa, Sz, and Svk using a 0.8 millimeter Gaussian filter cut-off setting.
- Cross-check Sz maximum peak heights against the specified wet coating thickness or printing ink film thickness.
- Reject any board lot where Sz values exceed 1.5 times the intended wet fluid film thickness regardless of compliant mean PPS air leak values.
Matching sheet surface properties to specific printing processes demands recognizing that compression nips flatten soft surfaces while rigid inks highlight hard unyielding peaks.
Arbitration
Material disputes between boxboard mills and packaging converters often center on conflicting surface smoothness measurements recorded across different instrument families. A mill quality department certifying board via offline Parker Print-Surf testing may release reels that fail high-speed online optical inspection at the packaging plant. Resolving these technical conflicts requires precise contract definitions that specify primary referee test methods, sample conditioning parameters, and clear mathematical conversion factors between air leak micrometers and areal optical parameters.
Inline Process Control and Laboratory Qualification
High-speed board machines running above five hundred meters per minute rely on instantaneous continuous web scanning to catch coating streaks and micro-calender drift. Inline laser line triangulation systems project beams across four-meter web widths, processing high-frame-rate elevation data to construct 3D surface maps continuously. Web tension varies.
These systems detect localized coating scratches, blade lines, and calendar spots in real time, enabling machine operators to adjust blade angle and nip loads immediately. Laboratory air leak instruments serve a different function, providing batch-level off-line qualification on cut samples to confirm baseline compliance before mill dispatch.
Inline laser triangulation catches transient coating scratches across machine webs that benchtop air leak instruments miss entirely during routine batch testing.

Commercial Specification Drafting and Defect Cost Allocation
Contracts governing board delivery specify upper and lower tolerance bands for surface roughness tied to specific test methods and conditioning environments. Switching a quality contract from Parker Print-Surf air leak specifications to 3D laser triangulation parameters changes the financial risk structure for both mill and buyer. Optical systems detect localized micro-defects that pass air leak flow thresholds, raising reject rates at goods-in if threshold parameters are set incorrectly.
Refusing to align measurement standards with actual converting mechanisms leads to unrecoverable claims when off-spec board causes press spoilage, lost production hours, and unfulfilled customer delivery schedules.
- Referee method designation defines whether ISO 8791-4 PPS or ISO 25178 optical profiling governs final lot acceptance during commercial delivery disputes.
- Conditioning environment enforcement obligates both buyer and mill laboratory to perform qualification testing at strict ISO 187 standard atmosphere to prevent moisture-induced surface roughening.
- Spatial defect frequency limits establish maximum permissible counts per square meter for discrete profile peaks (Sz) exceeding defined elevation thresholds.
- Data file retention requirements mandate keeping digital raw elevation maps for twelve months to enable retrospective defect origin analysis on converted packaging failures.
Procuring boxboard for demanding converting operations requires defining surface quality criteria through the physical reality of the application. High-volume solid bleached board running on offset presses benefits from traditional Parker Print-Surf testing, where pneumatic clamping load mimics press nip dynamics accurately. High-barrier food packaging board coated with thin dispersion films requires 3D optical triangulation to catch non-compressible isolated peaks that puncture coatings and destroy barrier performance.
Specifying both methods with clear functional boundaries protects capital expenditure and eliminates commercial disputes at the converting plant.