Mathematical Modeling of Mechanical Tone Value Increase across Recycled Testliner
Dynamic impression squeeze on porous recycled testliner forces lateral ink spread, requiring prepress Yule-Nielsen n-factor recalibration to prevent gain.
Topography
Surface roughness and pore structure on recycled testliner govern initial fluid spreading before liquid absorption begins. Recycled linerboard consists predominantly of old corrugated containers (OCC) that have undergone multiple repulping loops. Fiber shortening across successive recycling cycles reduces structural uniformity, creating high localized variation in surface height and pore diameter.
When liquid flexo or offset ink contacts the sheet, surface topography drives mechanical lateral flow. High Parker Print-Surf roughness values correlate directly with increased ink land area under mechanical impression force.
Pore volume distribution across the top ply determines whether ink vehicles drain vertically into the fibrous mat or spread horizontally along surface valleys. Testliner grades lacking a virgin kraft top layer exhibit high micro-void volume near the surface. Mechanical pressure forces fluid through these capillary voids laterally, enlarging the printed dot perimeter beyond the geometric footprint of the plate element.
Standard testing under ISO 8791-2 via Bendtsen air-leakage methods or ISO 8791-4 using Parker Print-Surf at 1.0 MPa clamping pressure quantifies this interface structure prior to ink contact.
| Substrate Grade | Grammage Range (g/m²) | PPS Roughness at 1.0 MPa (µm) | Bendtsen Roughness (mL/min) | Cobb 60 Absorption (g/m²) | Apparent Density (g/cm³) |
|---|---|---|---|---|---|
| Unbleached Kraftliner | 125 – 175 | 4.2 – 5.1 | 150 – 300 | 25 – 30 | 0.68 – 0.74 |
| Testliner 1 (Kraft Top) | 120 – 160 | 5.0 – 6.2 | 350 – 500 | 28 – 34 | 0.62 – 0.67 |
| Testliner 2 (100% Recycled) | 115 – 150 | 6.5 – 7.8 | 600 – 900 | 32 – 40 | 0.56 – 0.61 |
| Testliner 3 (Low Burst Recycled) | 100 – 140 | 7.9 – 9.5 | 950 – 1400 | 38 – 48 | 0.50 – 0.55 |
Substrate compressibility governs how top-ply cavities deform under dynamic press loads. Low-density recycled sheets collapse significantly under the impression cylinder. Surface peaks yield under pressure, forcing fluid sideways into uncompressed neighbor voids.
This mechanical displacement occurs within milliseconds of nip contact. Higher secondary fiber content increases sheet compliance, accelerating horizontal liquid displacement before radial ink absorption locks the pigment particles in place.
Recycled furnish with high ash content demands elevated impression force to achieve total ink coverage, accelerating plate wear while widening dot perimeters.
Fibre alignment in the machine direction creates anisotropic fluid drag across the surface. Mechanical tone value increase expands more aggressively along cross-machine paths where fiber density presents lower hydraulic resistance. Standard air-permeability measurements fail to capture this directional variance, leaving prepress engineers without directional compression factors during initial curve profile creation.
Which secondary fiber fractions generate the highest dynamic spreading velocities under low viscosity water-based flexographic inks remains partially unaccounted for in standard steady-state porous transport models.

Impression
Dynamic compression inside the printing nip converts static plate geometry into enlarged wet ink films. Flexographic photopolymer plates yield elastically when contacting the testliner face. Plate durometer hardness, backing tape resilience, and impression cylinder line pressure determine the physical contact area.
High impression forces squeeze wet ink outward toward the dot edges, generating a characteristic dark halo rim around each halftone element.

Nip Mechanics and Photopolymer Plate Deformation
Plate dots squash laterally under squeeze setting increments as low as 20 micrometers. On stiff virgin kraftliner, surface resistance limits plate deformation to the contact apex. On soft recycled testliner, sheet compression and plate dot squishing occur simultaneously.
The total contact area increases non-linearly with applied mechanical force. A photopolymer plate with a shore hardness of 65 Shore A exhibits substantial dot shoulders under elevated squeeze, pushing liquid ink out of the cell reservoirs and onto the surrounding non-image areas of the recycled paperboard.
Where Does Surface Elasticity Alter Mechanical Ink Spread?
Viscoelastic recovery of the recycled fiber network takes longer than the contact duration inside a high-speed packaging press nip. Operating speeds exceeding 250 meters per minute reduce dwell time to less than 5 milliseconds. The physical deformation of the sheet remains unrecovered while ink film splitting occurs at the exit side of the nip.
Surface fibers locked in a compressed state during ink transfer absorb liquid rapidly along the horizontal plane before spring-back occurs. Ink viscosity drops under high shear rates inside the nip, driving lateral hydraulic flow across low-density valleys in the recycled substrate profile.
- Mount a 1.14 mm photopolymer plate with solid and halftone target patches onto a flexographic plate cylinder using medium-density compressible mounting tape.
- Condition the testliner samples under ISO 187 parameters at 23 °C and 50 percent relative humidity for 24 hours.
- Set press speed to target production rate and record static doctor blade chamber pressure and ink viscosity using a Zahn Cup 2 standard.
- Increase impression squeeze in 10-micrometer increments from zero contact until complete solid ink coverage achieves target optical density.
- Capture micro-photographs of 10 percent, 50 percent, and 80 percent halftone patches immediately post-discharge to measure geometric dot edge displacement.
- Calculate mechanical area expansion by subtracting prepress file dot percentages from measured physical dot areas.
Over-impression causes ink starvation in halftone centers while building thick ink ridges along perimeters. This edge accumulation alters both mechanical tone value increase and subsequent drying kinetics. Softer photopolymer formulations cushion impact on rough recycled surfaces, yet wider contact land areas result in predictable midtone gain increases across low-grammage testliner grades.
A soft mounting tape dampens shock loads from coarse testliner surfaces, preserving dot shape under high impression force.


Formulation
Mathematical representation of total tone value increase requires separating physical dot enlargement from optical light scattering inside the paper bulk. The classical Murray-Davies equation computes apparent dot area based purely on surface reflectance measurements. It integrates both physical spread and optical trapping into a single unrefined metric.
Calculating physical mechanical spread alone demands subtracting optical gain models from total measured reflectance values.
The Murray-Davies relationship calculates halftone dot area based on measured optical densities:
A_total = (1 – 10^(-D_t)) / (1 – 10^(-D_s))
In this equation, A_total represents the total tone value, D_t represents the optical density of the halftone patch, and D_s represents the optical density of the solid print patch. On recycled testliner, internal light scattering within short secondary fibers exaggerates optical density drops. This effect causes the standard Murray-Davies calculation to overstate the physical size of the printed dot.

The Yule-Nielsen Correction and Substrate Optical Factors
To isolate mechanical gain from optical effects, the Yule-Nielsen modification introduces an empirical exponent, the n-factor, accounting for light penetration into the substrate:
A_physical = (1 – 10^(-D_t / n)) / (1 – 10^(-D_s / n))
The n-factor varies with substrate translucency, fiber length, and filler content. Uncoated recycled testliner exhibits high light scattering coefficients due to micro-voids between shortened secondary fibers. Standard virgin coated boards use n-factors between 1.5 and 2.0.
Recycled testliner requires n-factors ranging from 2.2 to 3.5 depending on ash content and surface sizing intensity. Setting an inaccurate n-factor causes prepress systems to miscalculate true physical dot growth, leading to incorrect compensation curve parameters.
At 50 percent nominal halftone dot area, mechanical tone value increase on 140 g/m² Testliner 3 reaches 18.4 percent under 0.35 MPa nip pressure at 23 °C and 50 percent relative humidity.

Analytical Derivation of the Mechanical Expansion Term
A physical model isolating pure mechanical squeeze expansion on compressible paperboard incorporates dynamic ink viscosity, nip pressure, plate dot geometry, and substrate surface micro-roughness. Physical dot radius expansion follows a modified hydrodynamic squeeze-flow formulation:
R_final = R_0 + delta_R_mech
delta_R_mech = ^(1/4)
Here, R_0 is the initial geometric dot radius on the printing plate, F_nip is the line pressure applied in the nip, h_0 is the wet ink film thickness before compression, mu is the dynamic shear viscosity of the ink at press operational temperatures, v_line is the web line speed, and Ra is the average surface roughness parameter of the recycled testliner. Physical dot area expansion percentage then follows geometric expansion geometry:
A_mech = ((R_0 + delta_R_mech)^2 / R_0^2) A_nominal
Consider a practical print trial on 135 g/m² Testliner 2 running a 50 percent nominal midtone patch on a flexographic line. The initial plate dot radius R_0 measures 45 micrometers for a 133 lines-per-inch screen frequency. The wet ink film thickness h_0 equals 2.5 micrometers, operating dynamic ink viscosity mu sits at 0.08 Pascal-seconds under shear, line speed v_line runs at 3.0 meters per second, impression line force F_nip equals 250 Newtons per meter, and substrate PPS surface roughness Ra measures 6.8 micrometers.
Calculating the mechanical expansion term delta_R_mech:
delta_R_mech = ^(1/4)
delta_R_mech = ^(1/4)
delta_R_mech = ^(1/4) = 0.00399 meters = 3.99 micrometers
The expanded physical dot radius R_final equals 45 + 3.99 = 48.99 micrometers. The resulting physical dot area A_mech calculates as:
A_mech = ((48.99)^2 / (45)^2) 50 = (2400.02 / 2025) 50 = 59.26 percent
In this operational scenario, pure mechanical squeeze accounts for 9.26 percent of absolute dot gain. If spectrophotometer readings show a raw Murray-Davies tone value of 72.0 percent, the remaining 12.74 percent gain stems entirely from optical photon trapping within the porous recycled fiber mat. Mislabelling optical trapping as physical dot enlargement prompts prepress operators to over-truncate screen highlight dots, causing image break-up, harsh tonal vignettes, and loss of shadow detail in finished packaging prints.
Drift
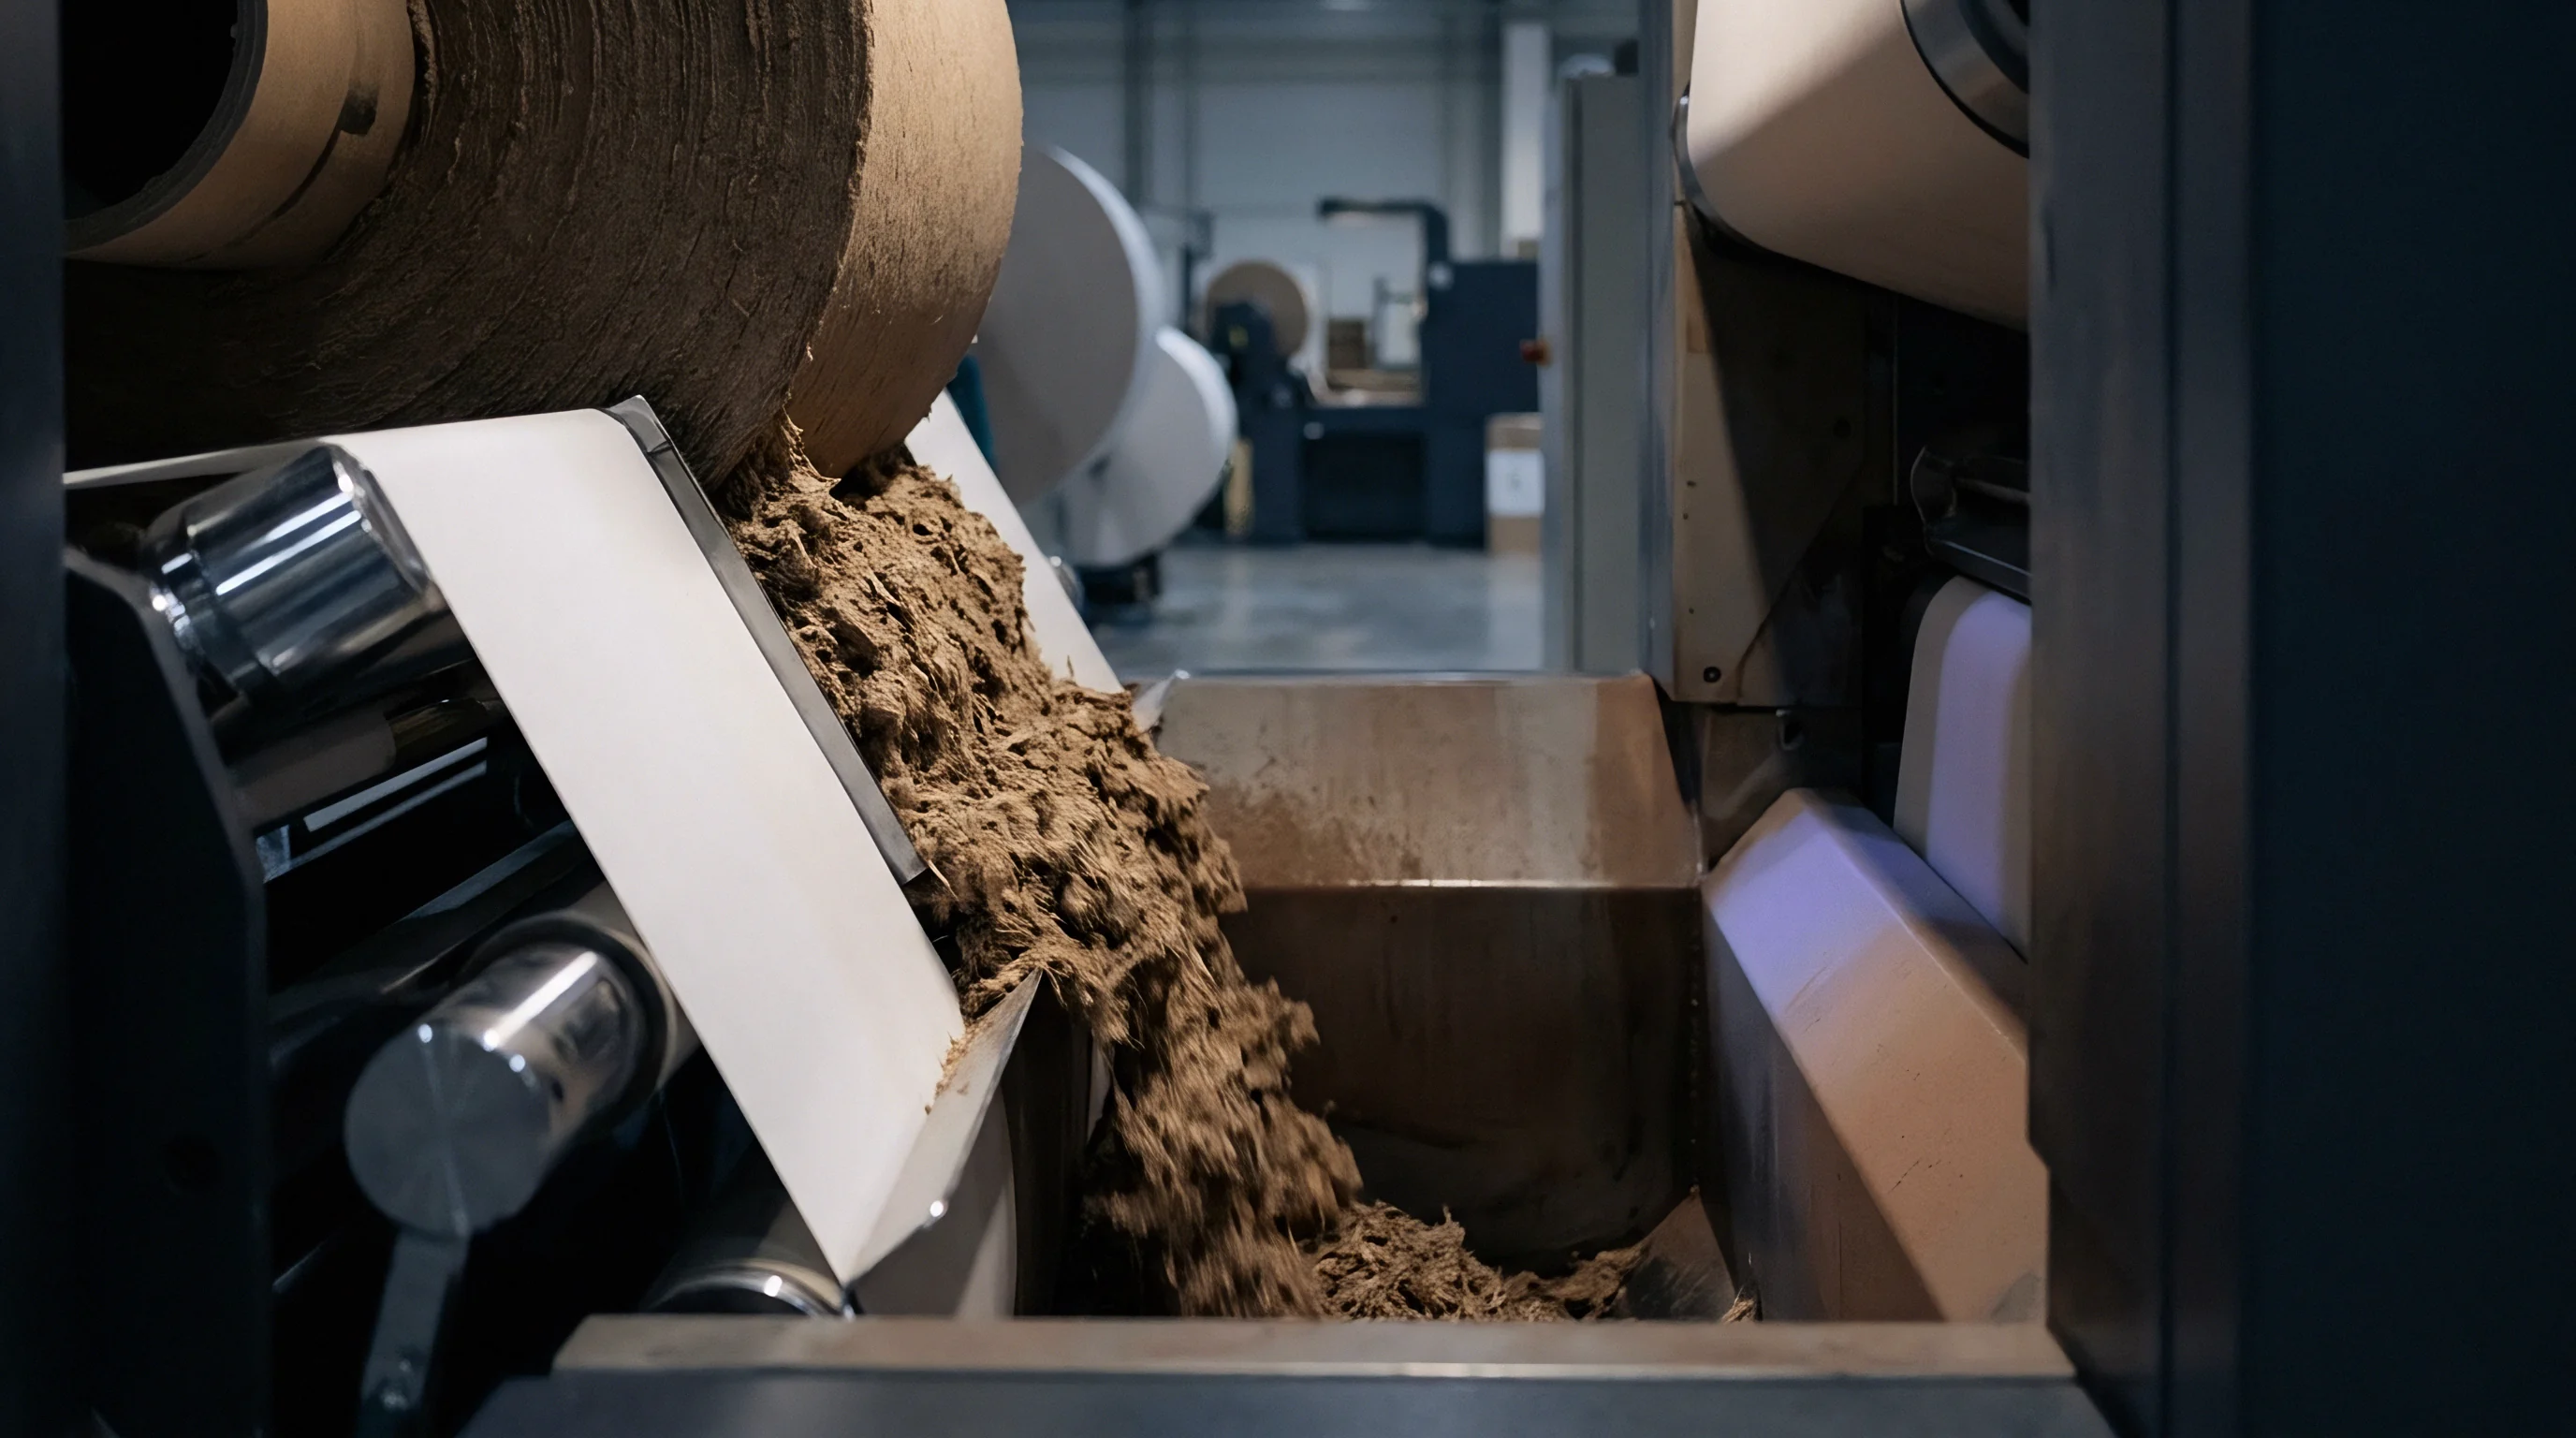
Consistency in mechanical dot gain requires uniform paper structure across the entire reel width and length. Recycled testliner mills face variable furnish feeds from municipal recovery streams. Uncontrolled fluctuations in secondary fiber origin cause significant drift in sheet caliper, Cobb sizing values, and tensile compressibility.
When substrate compressibility changes mid-run, fixed press mechanical squeeze settings yield changing tone value increase profiles.
Fibre Shortening and Moisture Infiltration Dynamics
Repulping cycles strip natural hemicellulose coatings from wood fibers, reducing internal hydrogen bonding capabilities. Recycled furnish mills add cationic starches and mineral fillers like calcium carbonate to maintain burst strength targets without adding weight. High filler loading increases surface compressibility while reducing fluid holdout.
Moisture content shifts across unconditioned storage areas alter sheet elasticity instantly upon unrolling.
Absolute moisture variations as small as 1.5 percent shift the elastic modulus of recycled testliner by up to 12 percent. A wetter sheet compresses further under identical impression cylinder nip gaps, increasing mechanical dot squeeze. As the paper web pulls moisture from humid ambient plant air, dot perimeters creep outward, altering tint values across sensitive solid-tone brand backgrounds.
| Physical Property Shift | Testliner 2 Variance | Testliner 3 Variance | Impact on 50% Dot Gain | Primary Failure Mode |
|---|---|---|---|---|
| Caliper Increase (+15 µm) | +3.2% to +4.5% | +4.1% to +6.0% | +2.8% Absolute Gain | Midtone Bridging |
| Moisture Pickup (+2.0%) | +1.8% to +2.5% | +2.6% to +3.8% | +1.9% Absolute Gain | Shadow Plugging |
| Cobb 60 Rise (+10 g/m²) | +5.0% to +8.0% | +8.0% to +12.0% | +1.2% Absolute Gain | Ink Sink / Low Density |
| Ash Content Rise (+4.0%) | +2.0% to +3.5% | +3.5% to +5.2% | +2.1% Absolute Gain | Mottle & Plate Filling |

Failure Modes Driven by Substrate Non-Uniformity
Uncontrolled mechanical dot growth directly triggers distinct print defects on corrugated converting lines:
- Midtone Bridging occurs when individual halftone dots expand until their perimeters merge, causing non-linear tonal jumps between 40 percent and 60 percent screen values.
- Shadow Plugging arises when mechanical squeeze forces wet ink across shadow screen voids, turning 80 percent halftone patches into solid, unreadable ink blocks.
- Edge Haloing develops when excessive impression squeeze creates heavy ink ridges along dot borders, producing distinct light centers and dark rims visible under optical magnification.
- Color Shift Trapping emerges when high mechanical gain on early print stations changes second-down ink trapping ratios, causing hue angle errors across secondary green and orange print overlaps.
Mill technical support frequently attributes tone value variations to press operator impression adjustments rather than raw furnish variance.


Calibration
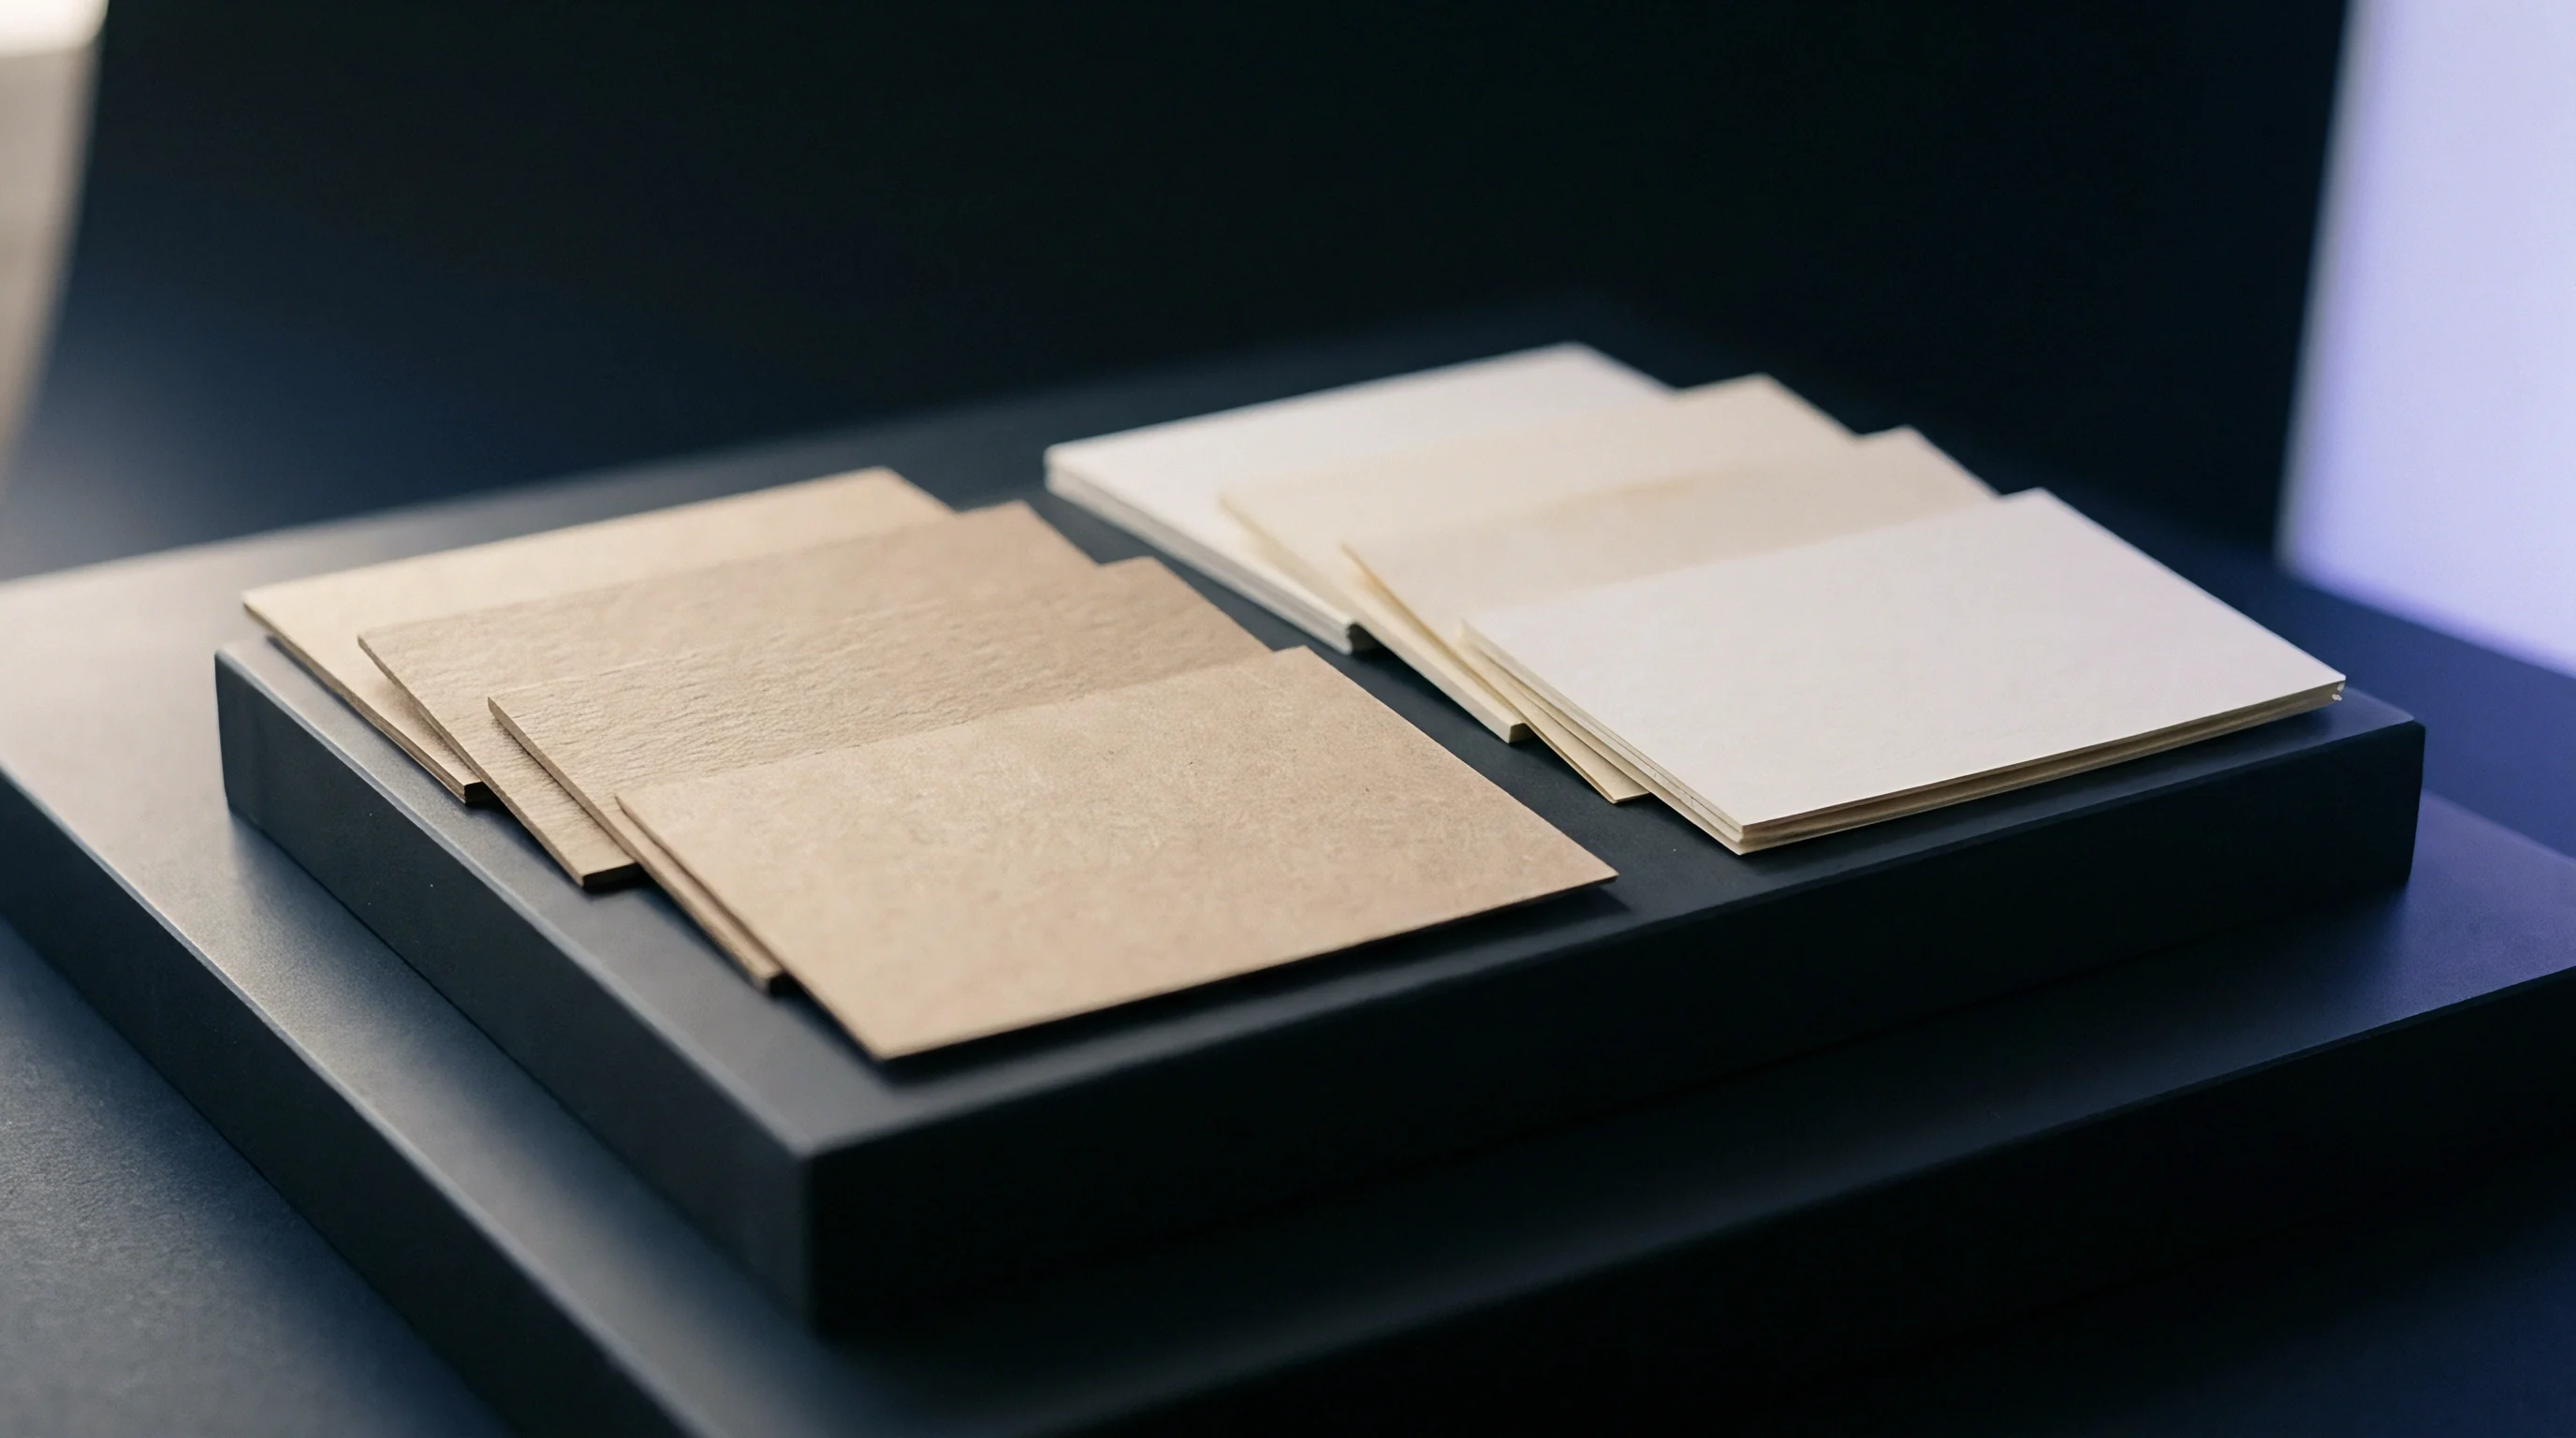
Compensating for mechanical tone value increase on recycled testliner demands targeted prepress compensation curves rather than generic standard profiles. Standard flexographic printing curves built for virgin kraftliner underestimate mechanical ink spread on porous secondary fiber surfaces. Matching target visual densities on recycled board requires generating dedicated RIP (Raster Image Processor) transfer curves mapped directly to the physical behavior of specific paperboard grades.
ISO Standards and Target Band Specifications
ISO 12647-6 defines tone value increase targets and tolerances for flexographic printing on corrugated packaging materials. Substrates are categorized by surface finish and liner composition. Target curves for uncoated recycled board mandate higher nominal dot gains than coated white top sheets.
A nominal 50 percent screen on brown testliner routinely yields target tone values between 68 percent and 74 percent under standard production conditions.
Applying standard offset or smooth flexo curves to recycled testliner creates harsh highlights and clipped shadow details. Prepress engineers must truncate input tone values inside the RIP software to ensure printed dots expand into correct target geometries on press. High mechanical gain environments require cutback curves that reduce a 50 percent image file dot down to 32 percent on the photopolymer plate face.
- Furnish Classification requires assigning incoming paper stock to precise density and surface roughness bands before applying prepress curves.
- Fingerprint Execution involves running calibrated test targets under standardized ink viscosity, chamber pressure, and web speed conditions.
- Optical Separation demands using valid Yule-Nielsen n-factors during densitometric calibration to isolate pure mechanical spread.
- Curve Application mandates loading discrete highlight, midtone, and shadow compensation curves into the prepress plate-making workflow.
- Batch Tolerancing requires verifying printed control strips against target bands before releasing high-volume packaging runs.
Under ISO 12647-6, acceptable tone value variation across a press run must remain within a plus or minus 4 percent tolerance band for midtones, or the lot faces formal quality rejection under standard buyer purchasing terms.
ISO 12647-6 specifies an acceptable tone value increase tolerance band of plus or minus 4 percent for flexographic printing on corrugated board substrates, beyond which batch recalibration becomes mandatory.
A purchase order carrying a strict ISO 12647-6 compliance clause allows packaging buyers to reject delivered corrugated cartons whenever spectrophotometer audits reveal uncompensated midtone gain exceeding target limits.

Toll
Uncompensated mechanical tone value increase damages converting economics by driving up liquid ink consumption and forcing press slowdowns. High dot gain forces operators to increase overall ink volume to hit shadow target densities, overloading porous recycled top sheets with excess water or solvent. Over-inking reduces line running speeds due to drying deck capacity limits, increasing cost per thousand finished corrugated boxes.

Ink Consumption Arithmetic and Run Economics
Wet ink film transfer scales directly with total printed area expansion. A nominal 40 percent screen halftone patch expanding mechanically to 62 percent consumes 55 percent more wet ink per square meter than a calibrated, compensated halftone profile. Across long production runs on corrugated folder-gluers, this extra ink volume drives up variable raw material costs significantly.
| Parameter Metric | Compensated Profile | Uncompensated (Moderate Gain) | Uncompensated (Severe Gain) |
|---|---|---|---|
| Mean 50% Midtone Printed Area | 68.0% | 76.5% | 84.0% |
| Wet Ink Transfer Rate (g/m²) | 4.20 | 5.15 | 6.10 |
| Total Ink Weight Used (kg) | 420.0 | 515.0 | 610.0 |
| Ink Cost at 4.50/kg () | 1,890.00 | 2,317.50 | 2,745.00 |
| Dryer Energy Load (kWh) | 1,250 | 1,580 | 1,920 |
| Max Press Speed (m/min) | 280 | 220 | 170 |
Higher wet ink coverage forces converters to lower press line speeds to ensure complete drying before die-cutting and stacking operations. Running a corrugated press at 170 meters per minute instead of its rated 280 meters per minute increases fixed machine hour overhead allocations per unit. Lower line speeds reduce plant capacity and erode operating margins across high-volume recycled packaging jobs.
Uncompensated mechanical dot gain increases wet ink film transfer across midtones, extending drying times and driving up energy consumption in hot-air dryers.
Material waste accumulates quickly during press setup when operators adjust impression squeeze manually to correct tonal errors caused by uncalibrated prepress curves. Scrap sheets generated while attempting to balance density and gain parameters add direct cost to every production run. Implementing physical dot gain models inside prepress workflows eliminates manual press tweaking, stabilizing substrate conversion costs across recycled linerboard grades.