Statistical Process Control Fundamentals in Packaging Substrate Converting
Statistical process control in substrate converting relies on sub-grouping across machine direction variance and isolating non-normal barrier defects.


Baseline
Paperboard and flexible polymer webs carry inherent physical variations from fiber refining and resin extrusion. Statistical process control structures this background variability, separating normal operational noise from assignable faults. In high-speed roll-to-roll converting, raw material properties directly dictate line runnability, barrier integrity, and downstream print fidelity.
Applying SPC across these lines creates a real-time buffer against off-spec material reaching lamination or box-making operations.
Machine-direction fiber orientation, cross-direction moisture profiles, and caliper variance govern web behavior under tension. When substrate properties drift, tension control systems compensate by modulating brake torque or nip pressure ~ adjustments that inadvertently alter coat weight distribution, adhesive laydown, and ink absorption. Continuous statistical monitoring tracks these variables before physical defects appear in the finished packaging material.

Substrate Variability in Continuous Converting Lines
Raw stock arrives at the converting plant with both cross-machine and machine-direction variations. Fiber alignment during wet-end paperboard forming creates anisotropic strength profiles that alter bending stiffness and creep resistance. Similarly, polymer extrusions exhibit gauge bands along the bubble or slot die profile, producing thickness peaks and valleys across the roll width.
Process stability depends on understanding how incoming material variations interact with converting equipment. Unmonitored web thickness fluctuations, for instance, cause localized nip pressure shifts at gravure coating heads. Elevated nip pressure forces fluid into substrate voids, reducing surface coat weight and compromising barrier performance.
These variations show up through several primary mechanisms across web processing operations:
- Grammage Fluctuation alters heat transfer rates during thermal lamination, causing incomplete polymer adhesion along light-weight fiber lanes.
- Moisture Gradients create differential web expansion across slitting stations, producing edge wave, web curl, and reel telescoping during rewind operations.
- Caliper Variance generates uneven nip pressure profiles in coating stations, inducing cross-direction coat weight variations that degrade barrier performance.
- Tensile Strength Drops trigger web breaks at high line speeds, introducing thermal shock in drying ovens during re-threading cycles.

Common Cause versus Special Cause Mechanics
Random fluctuations in moisture or fiber orientation are inherent to paper and film manufacturing. Common cause variation represents this baseline noise on a stable converting line operating within its intended environmental and mechanical limits. Adjusting machine settings in response to common cause noise actually increases process variance ~ a mistake known as process tampering.
Special cause variation stems from distinct, identifiable issues outside ordinary process bounds. Doctor blade wear, thermal expansion in lamination rollers, batch-to-batch polymer viscosity shifts, and bearing wear produce non-random patterns in test data. Statistical process control isolates these signals using control limits calculated directly from baseline line capability.
Distinguishing baseline noise from assignable faults requires sampling protocols tied directly to roll geometry, particularly since hygroscopic substrates respond continually to ambient humidity.
Testing conditioned paperboard samples at twenty-three degrees Celsius and fifty percent relative humidity yields a baseline caliper variability standard deviation of two point four microns across a single mill jumbo reel.
When a control chart signals an out-of-control point, operators trace the shift to specific machine components or substrate lots. Unchecked special causes quickly lead to commercial scrap, whereas tracking gradual parameter drift allows maintenance teams to intervene during scheduled reel changes without disrupting line efficiency.
Quantifying how cross-direction web tension profiles interact with localized coat weight deposition remains an ongoing challenge on high-speed lamination platforms, where it is still uncertain whether real-time tension mapping can completely eliminate micro-void formation in thin-barrier substrates.

Gauge
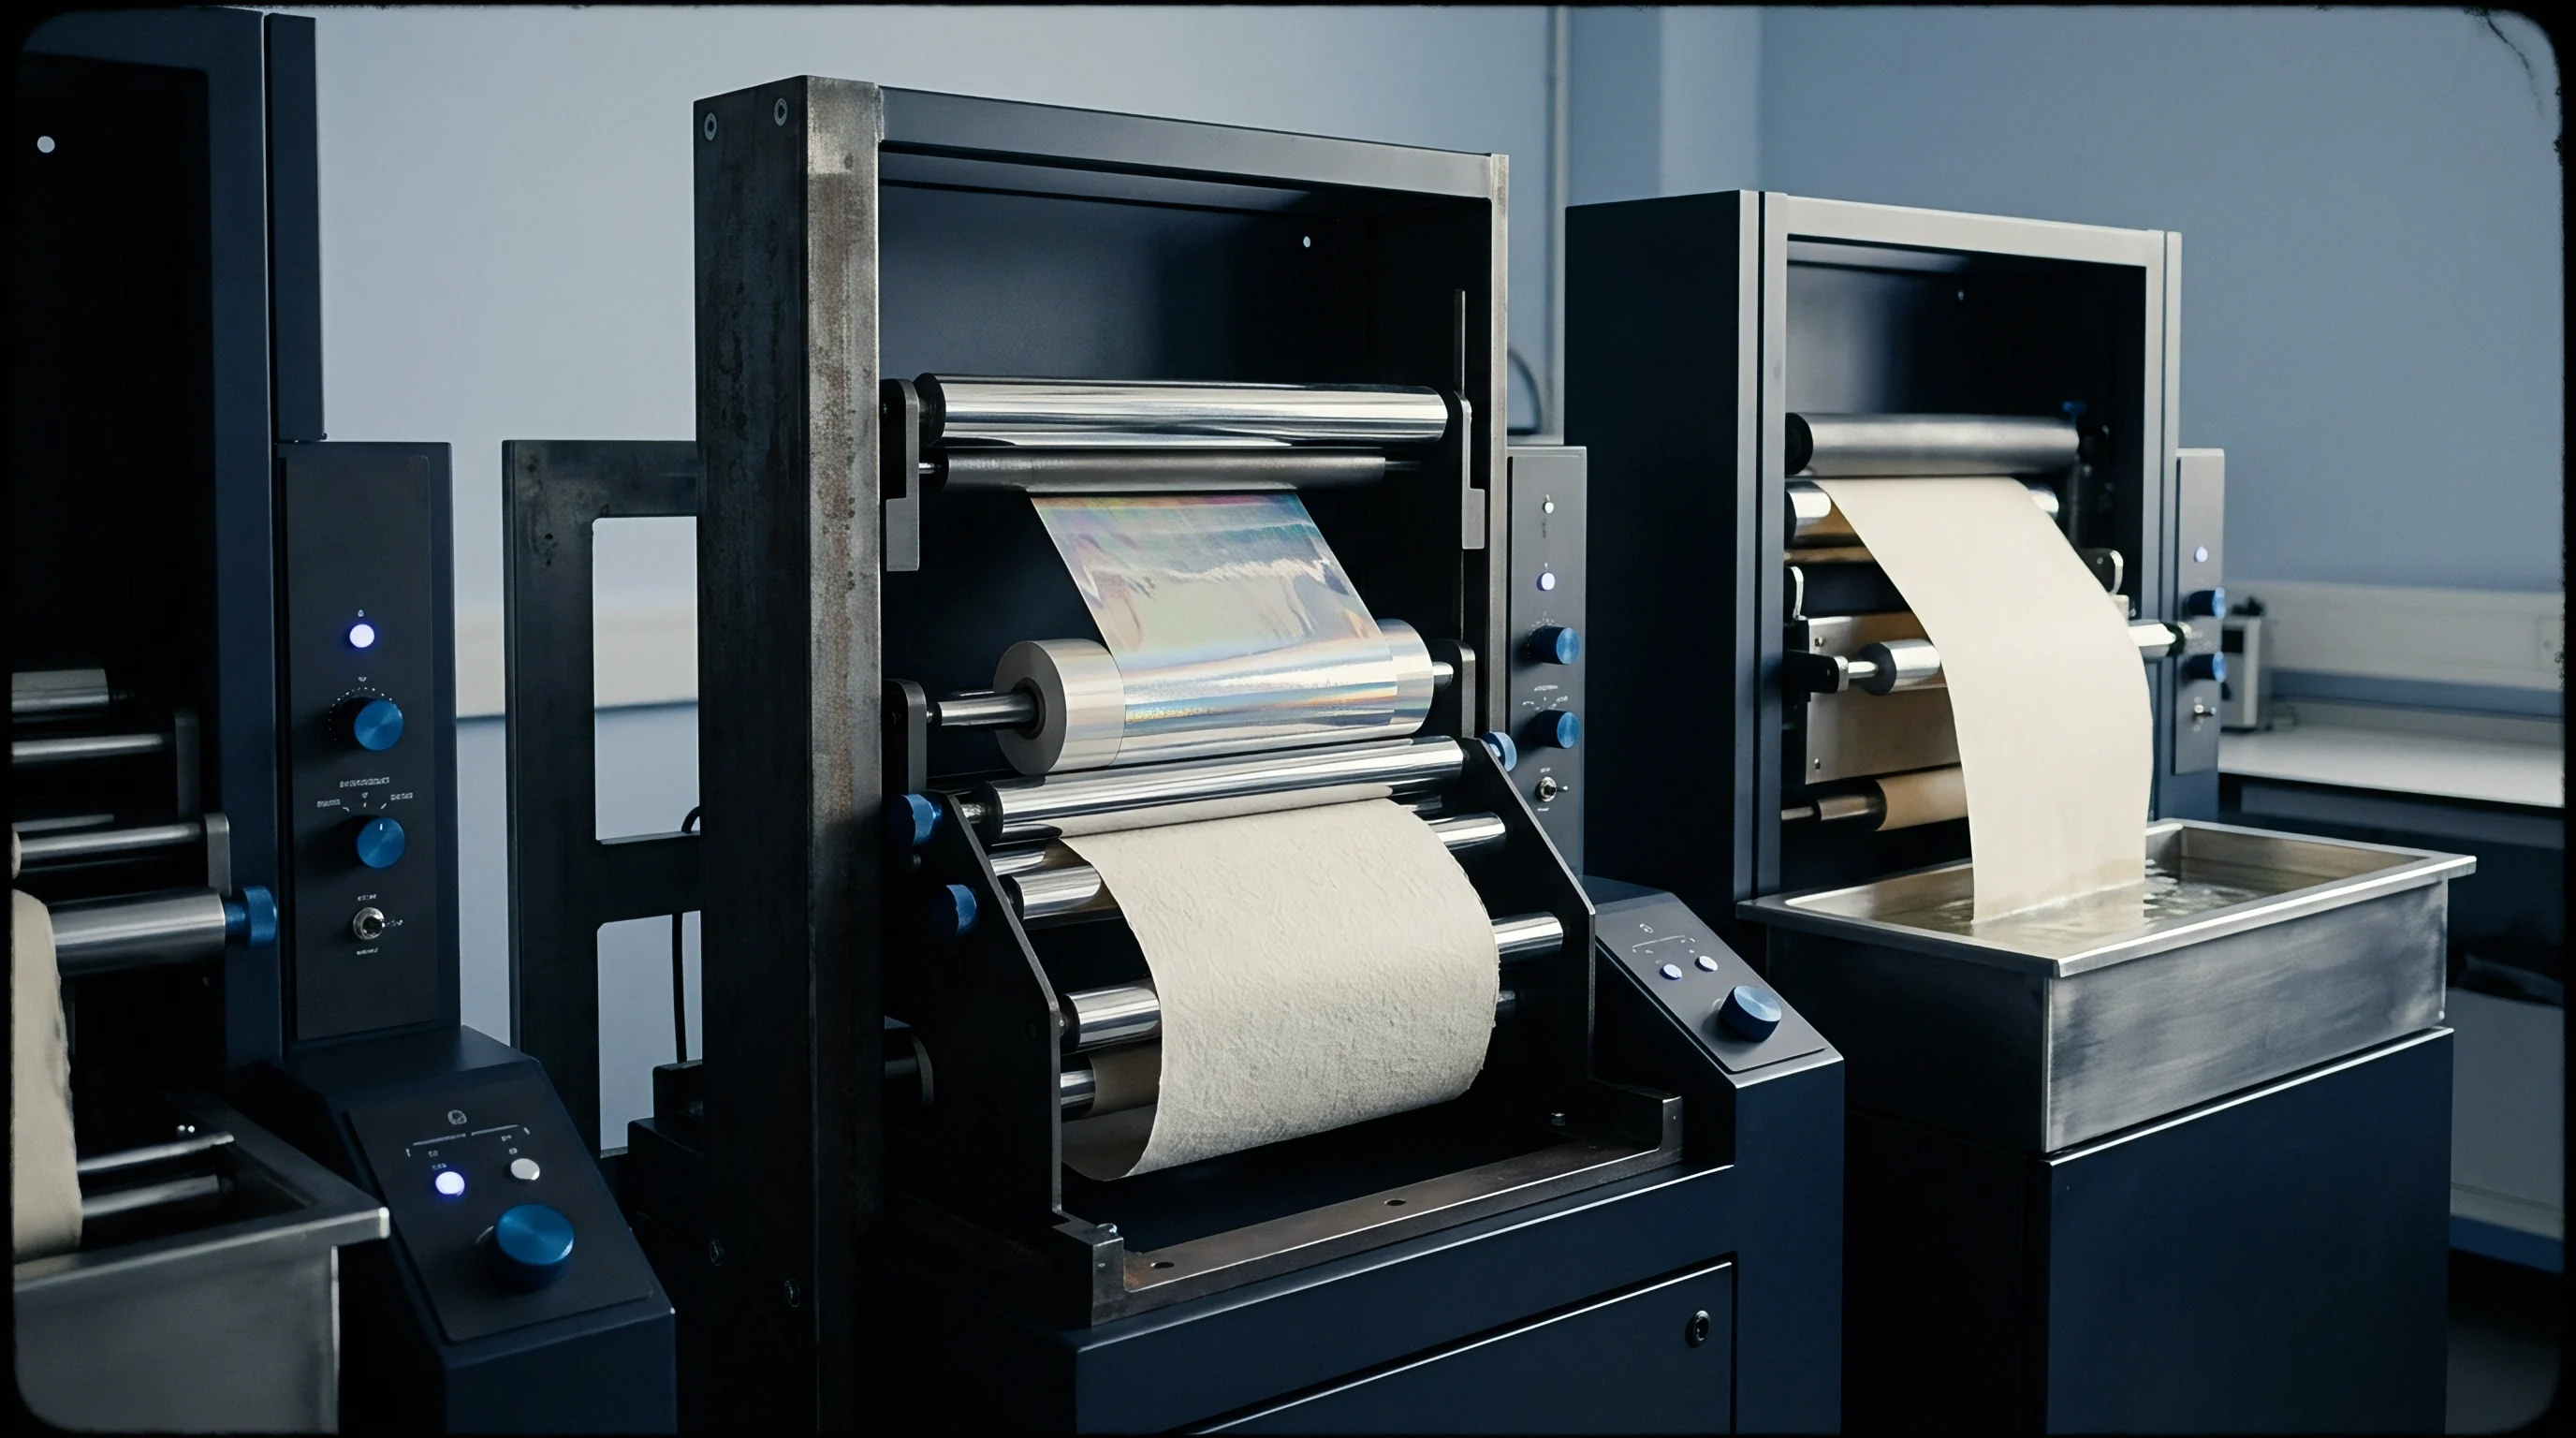
In-line and lab measurement devices introduce their own variance into production quality records. Measurement System Analysis evaluates instrument bias, linearity, stability, repeatability, and reproducibility before control charts are put into service. In substrate converting, measurement noise frequently masks genuine process shifts or triggers false alarms that lead to unnecessary adjustments.
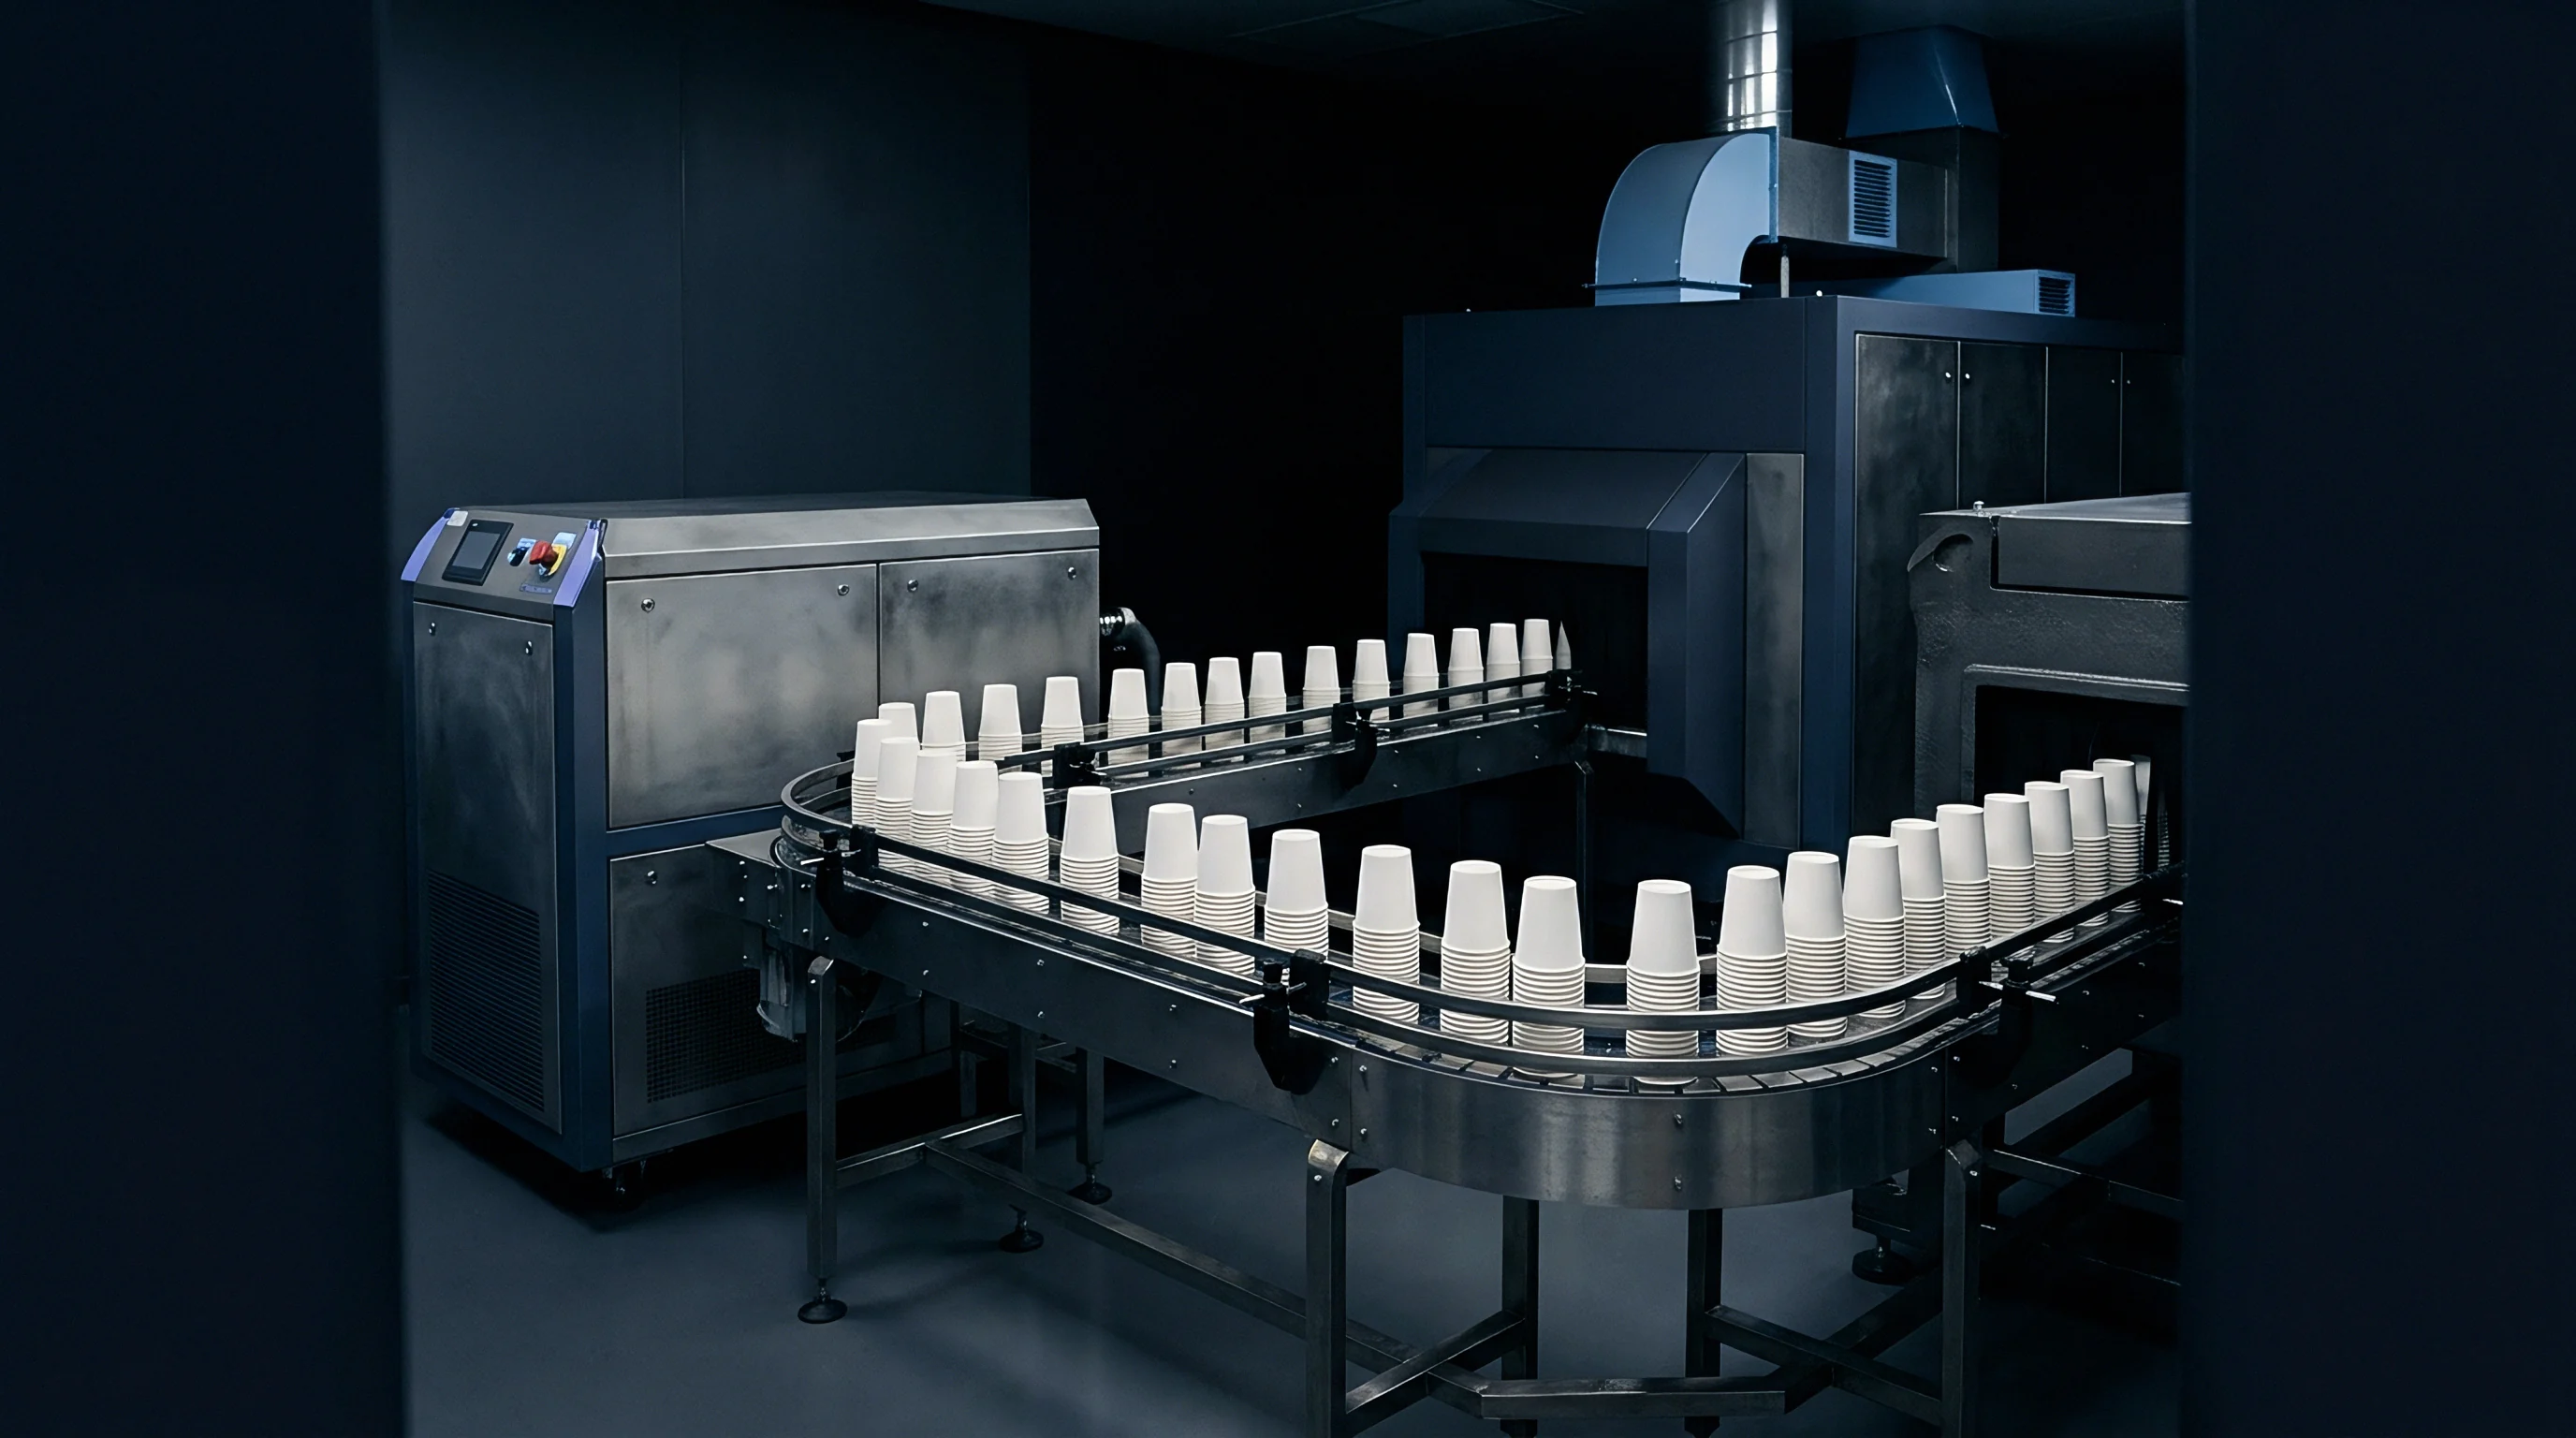
Testing methods in converting split into destructive off-line testing and non-destructive in-line sensing. Off-line methods require cutting samples from master roll tails or slit coils, making measurements vulnerable to sample preparation errors and operator technique. Continuous in-line sensors ~ such as beta-gauge transmission heads, infrared moisture detectors, and laser calipers ~ avoid sample destruction but contend with calibration drift and web flutter noise.
Evaluating Destructive and Non Destructive Substrate Metrics
Tests for paperboard tear strength or foil pinhole density render the sample unusable for subsequent converting steps. Because a destructive test cannot be repeated on the exact same spot on the web, estimating measurement repeatability depends on assuming that adjacent samples cut along the machine direction are homogenous.
Non-destructive in-line sensors monitor moving webs at line speeds exceeding six hundred meters per minute. At these speeds, web flutter alters the gap between sensor optics and the substrate, introducing noise into optical density and coat weight readings. Periodic off-line lab verification checks sensor calibration against reference standards, establishing the statistical confidence intervals required for automated line adjustments.
Partitioning Variance in Web Measurement Systems
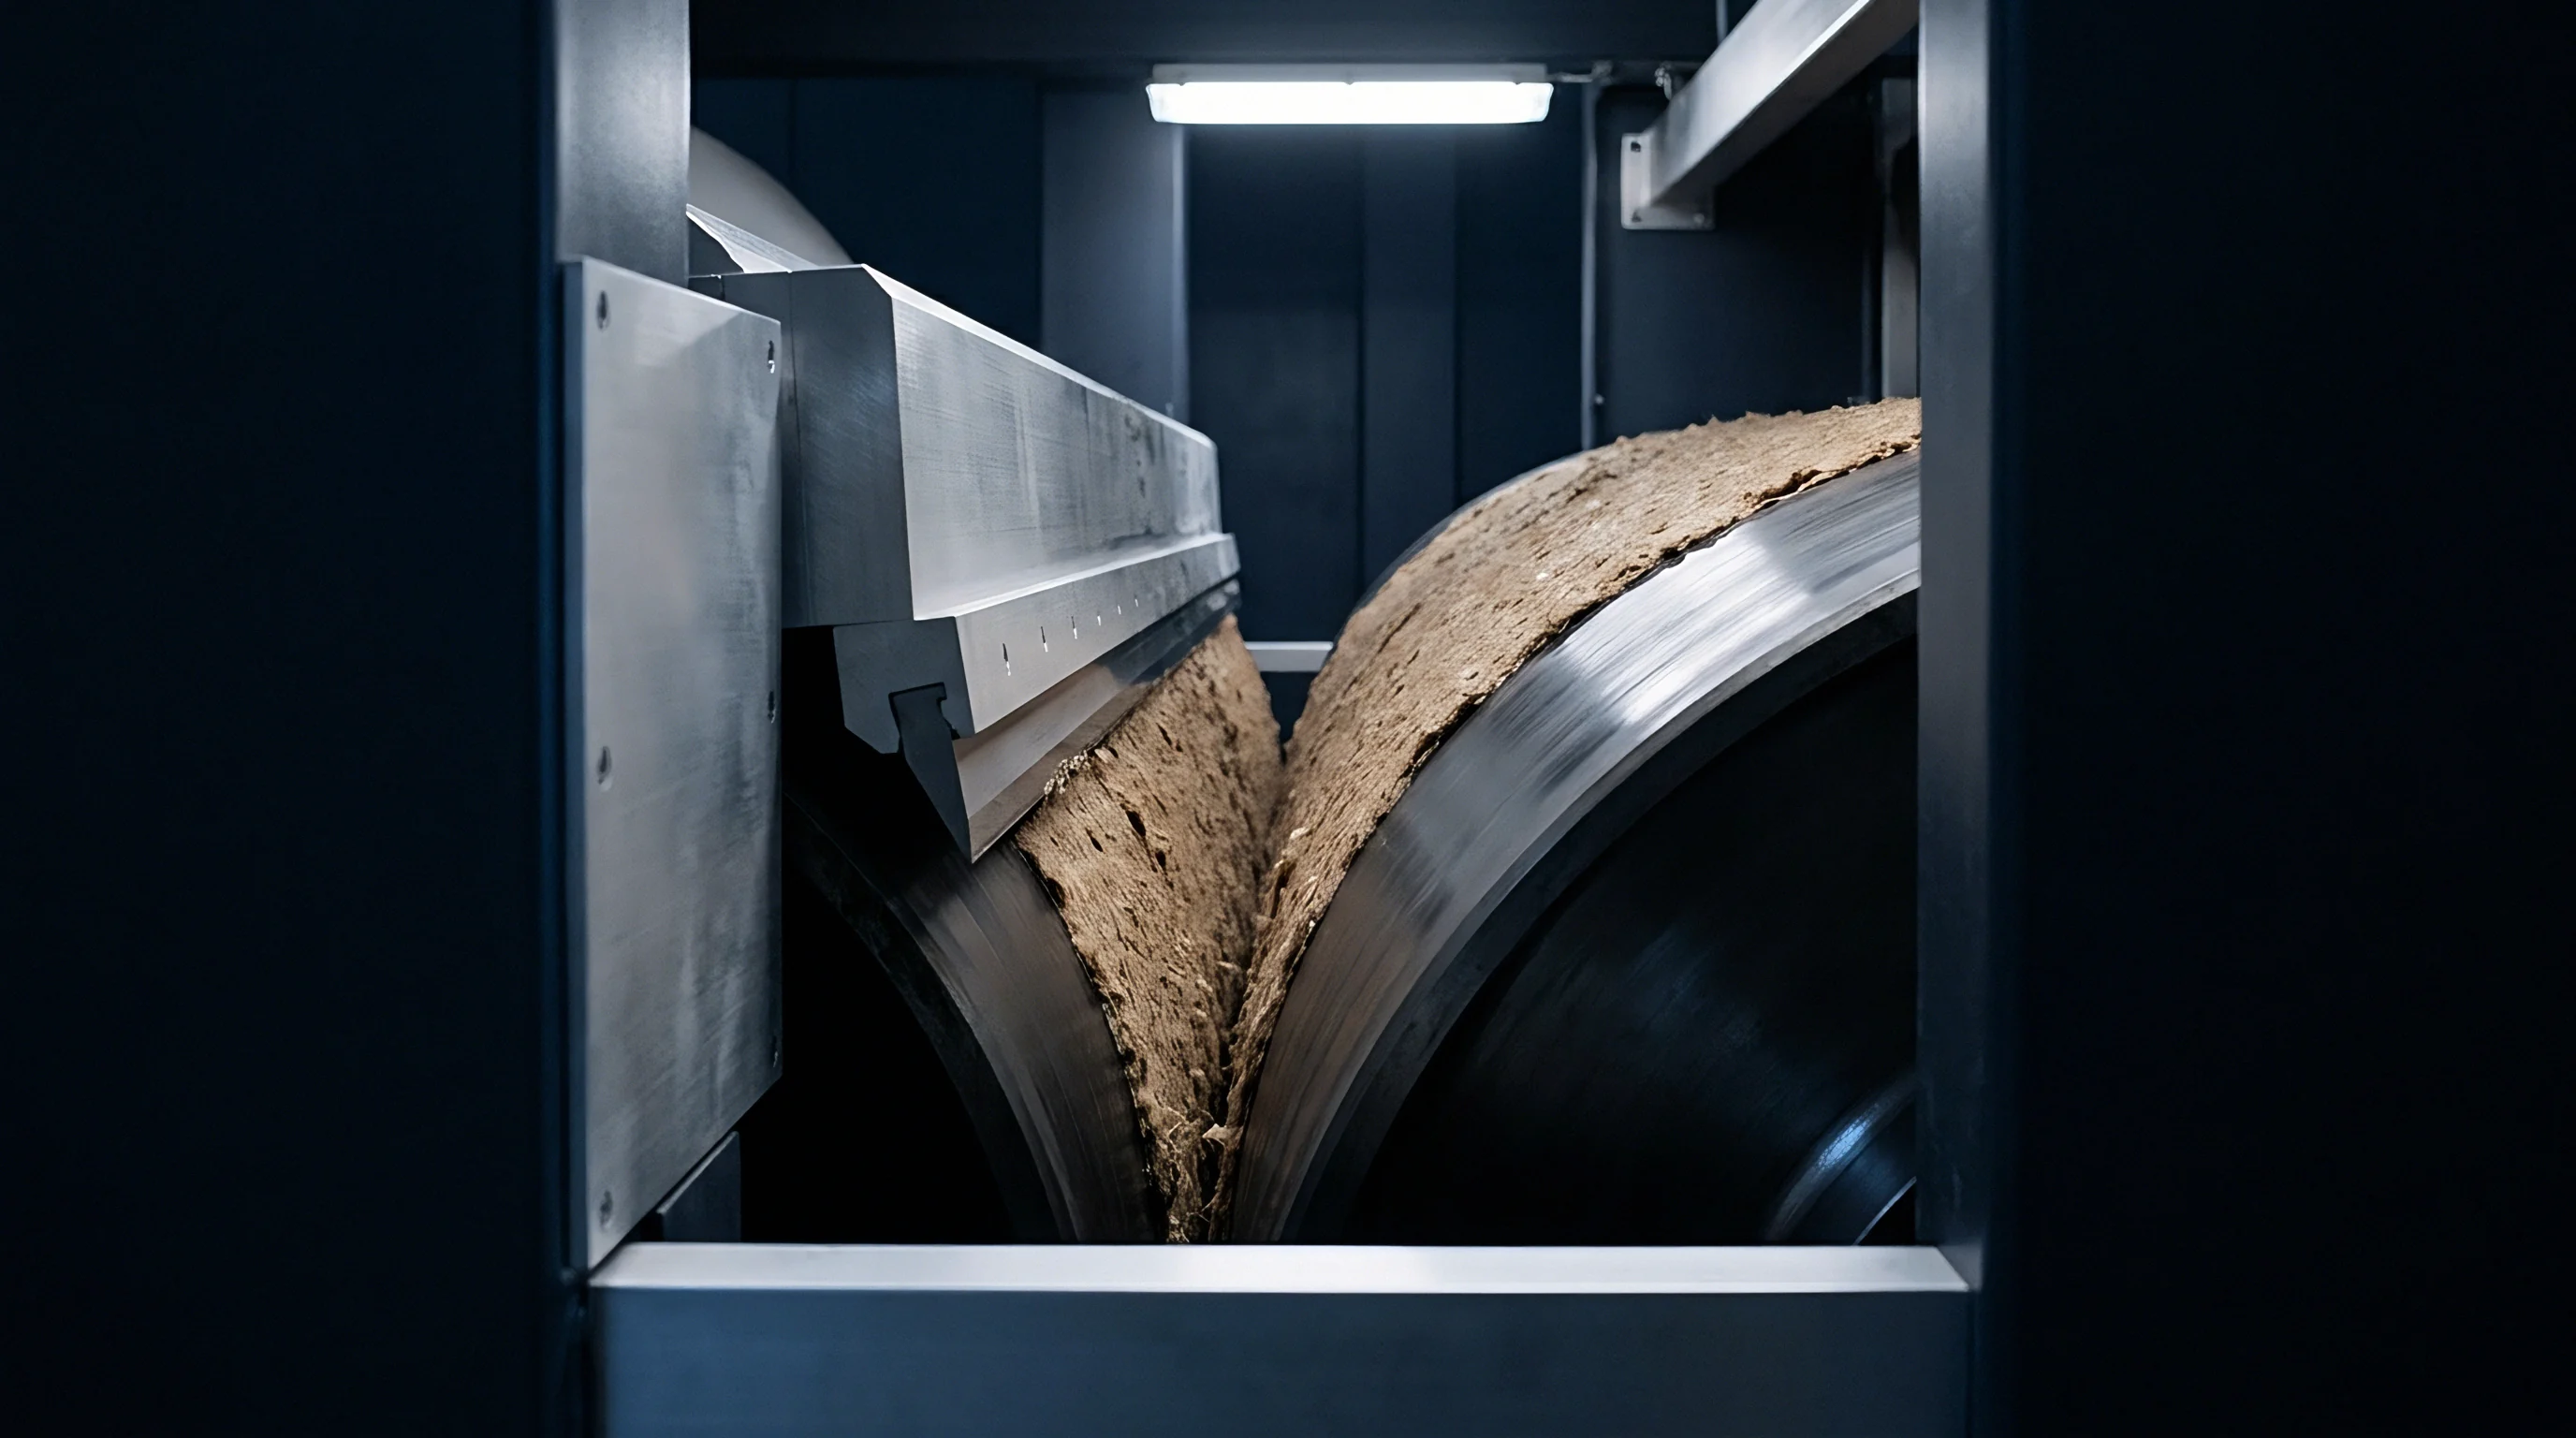
Analytical methods such as ANOVA isolate operator error from gauge instability. Gage Repeatability and Reproducibility studies break down total observed variance into process variance, equipment repeatability variance, and operator reproducibility variance. For critical packaging attributes, total measurement system variance should consume less than ten percent of the overall tolerance band.
Measuring coat weight on extrusion-laminated barrier board shows why structured measurement studies are necessary. Inconsistent sample cutters leave edge burrs that bias gravimetric weigh-strip-weigh calculations, while uncalibrated lab balances distort the baseline data used to establish control limits.
| Test Parameter | Test Method | Sample Type | Repeatability (%EV) | Reproducibility (%AV) | Gage R&R (%GRR) | Number of Distinct Categories (ndc) |
|---|---|---|---|---|---|---|
| ISO 535 Off-Line | Destructive Coupon | 6.2 | 8.4 | 10.4 | 11 | |
| In-Line Beta Gauge | Continuous Web | 3.1 | 1.2 | 3.3 | 28 | |
| ISO 534 Micrometer | Off-Line Strip | 4.5 | 5.8 | 7.3 | 15 | |
| Light Table Optical | Destructive Sheet | 12.8 | 14.1 | 19.1 | 6 |
High repeatability errors in pinhole density testing typically stem from light source degradation and differences in visual acuity among operators. Reducing this reproducibility error generally requires installing automated vision inspection hardware directly on the slitting frame.
When measurement system variation exceeds thirty percent of total observed variation, process capability calculations become unreliable. Instrument calibration and cutter maintenance are therefore essential prerequisites to running any meaningful statistical quality control program.
An inaccurate gauge renders every downstream capability calculation meaningless, no matter how carefully control limits were calculated.

Chart
Control charts track key parameters over time to detect process shifts during web runs. They establish boundaries based on historical line performance, setting upper and lower limits three standard deviations from the grand mean. Selecting the right chart structure depends on sampling frequency, subgroup size, and the physical configuration of the converting line.
Subgrouping strategy is the primary design choice when setting up statistical controls for converting. Individual-Moving Range charts work well for single-point continuous data like master roll average coat weight or single-lane thickness readings. Subgroup charts, such as X-bar/R or X-bar/S, evaluate cross-machine profiles by treating simultaneous measurements across the web width as a rational subgroup.
Does Web Speed Alter Control Chart Subgrouping?
Accelerating a lamination line from two hundred to four hundred meters per minute doubles the length of web passing through the nip during a given sampling interval. If an operator pulls lab samples every thirty minutes, the linear distance between sampled sections doubles, reducing sensitivity to short-term process oscillations.
Subgrouping must account for line velocity and web transport dynamics. High-speed continuous operations combine time-based variation in the machine direction with spatial variation across the roll width. Treating cross-web lanes as rational subgroups helps isolate cross-direction profile shifts from machine-direction speed or temperature changes.
Per ISO 22514-2 guidelines, establishing statistical control limits on web converting equipment requires a minimum of twenty-five consecutive stable subgroups drawn from a single continuous production run.
Making process adjustments on multi-lane slitter rewinders requires tracking individual lane positions. A persistent high reading in lane three points to localized doctor blade wear or gravure cell clogging, whereas a simultaneous drift across all lanes indicates resin viscosity changes in the supply tank.
- Select five sampling positions evenly spaced across the active web width to form a rational cross-direction subgroup.
- Extract test coupons at every master roll change or every sixty minutes during continuous reel-fed production.
- Measure target coat weight on each coupon using calibrated gravimetric or spectroscopic off-line test methods.
- Calculate subgroup average value X-bar and subgroup range value R for each sampling event.
- Plot values sequentially on dual control charts containing upper and lower control limits derived from initial baseline run statistics.
- Apply Western Electric pattern rules to identify non-random run patterns, multi-point trends, or control limit breaches.
Autocorrelation Dynamics in Roll to Roll Converting
Consecutive readings along a continuous paper or polymer web share physical traits because material properties change gradually. High-frequency in-line sensors log data points every few milliseconds, creating heavily autocorrelated time series. Standard control chart formulas assume independent, identically distributed data; when applied to autocorrelated readings, they artificially narrow variance estimates and trigger frequent false alarms.
Handling autocorrelated data requires time-series modeling or widening the sampling intervals. Exponentially Weighted Moving Average charts smooth continuous sensor streams, picking up small, persistent shifts without overreacting to high-frequency noise. Alternatively, statistical software can filter out process lag, leaving uncorrelated residuals that fit standard control rules.
Tracing autocorrelation patterns along continuous web lanes confirms that process corrections target real machine drift rather than transient oscillations. Ignoring autocorrelation leads to constant, unnecessary operator interventions, which increases line downtime and causes premature wear on coating actuators.
Failing to account for autocorrelation when monitoring continuous web thickness forces operators into constant die adjustments, ultimately widening cross-machine variance bands by over fifty percent.


Skew
Physical boundaries at zero prevent parameters like pinhole frequency or water vapor transmission rate from forming symmetric bell curves. Quality attributes bounded by zero or capped by material limits produce skewed probability distributions. Applying standard normal capability calculations to non-normal converting data distorts performance indices, either overstating line capability or creating artificial rejection risks.
Process capability compares process spread against engineering specification limits. The index Cp measures potential capability based solely on process spread, whereas Cpk adjusts for process centering relative to upper and lower specifications. Performance indices, Pp and Ppk, capture long-term performance, accounting for batch-to-batch substrate shifts and ambient plant conditions.
Capability Indices under Bounded Barrier Performance Data
Standard capability equations assume a Gaussian distribution. When measuring barrier film oxygen transmission rates, however, data clusters near zero with a long tail extending toward higher permeability levels. This non-normal behavior violates standard Cpk assumptions and invalidates predicted defect rates per million parts.
Coat weight distributions shift under real operating conditions. Bounded defect data requires fitting routines before capability metrics can be calculated; Weibull, lognormal, and gamma distributions accurately model these continuous barrier substrate properties.
| Substrate Attribute | Distribution Shape | Specification Limits | Standard Cpk | Non-Normal Ppk | Actual Defect Rate (PPM) |
|---|---|---|---|---|---|
Applying standard capability formulas to Weibull-distributed pinhole data overstates true line performance. Relying on inflated capability figures leads converters to accept high-risk packaging orders without adjusting baseline machine settings to meet the required barrier specs.

Transformation Models for Zero Bounded Defect Densities
Mathematical transformations convert skewed datasets into near-Gaussian distributions before capability ratios are calculated. The Box-Cox power transformation, for example, transforms skewed readings using parameters derived from maximum likelihood estimation.
Applying statistical transformations to zero-bounded attributes provides far more realistic risk estimates for production planning:
- Box-Cox Transformation stabilizes variance across exponential data streams, enabling valid Cpk calculation on non-normal barrier metrics.
- Log-Normal Fitting models solvent retention decay curves, isolating high-concentration tail risks in flexible packaging webs.
- Weibull Analysis predicts flex-crack failure frequencies under continuous web fatigue testing, establishing accurate mechanical operational thresholds.
- Johnson Transformation fits bounded multi-modal distributions resulting from dual-extrusion lamination systems.
Substrate suppliers often present capability reports based on normal distribution assumptions regardless of actual data shape, masking underlying process variation.
In non-Gaussian distributions, calculating process capability through percentile-based equivalent z-scores prevents artificial inflation of process performance metrics on zero-bounded barrier attributes.
Reporting a Cpk of two point zero on pinhole frequency without disclosing data non-normality masks tail-end defect risks that emerge later during high-speed liquid filling operations.
Even when a substrate meets statistical limits on paper, a coating distribution skewed toward the lower specification edge can trigger barrier failure under humid transit conditions.

Containment
When a control chart signals an out-of-control condition, formal procedures must isolate affected master rolls before slitting. An Out-of-Control Action Plan provides step-by-step instructions for operators when limits are breached. Immediate containment prevents defective substrate sections from being slit, laminated, or shipped to customers.
Effective containment depends on clear traceability linking slit coils back to master roll positions. Because line speed changes during reel swaps create localized gauge variations, these sections must be flagged, logged, or removed at the slitter frame. Thorough documentation provides the evidence required to validate batch quarantines during customer or regulatory audits.

Out of Control Action Execution in Web Processing
Operators follow decision trees when web tension or coat weight drifts beyond calculated control limits. The immediate response is to tag the active web section using automated flags, tabbers, or spray markers, linking the flagged material to spatial length counters on the operator interface.
If production continues while investigating a root cause, downstream processing steps must be isolated. If an out-of-control signal stems from a mechanical failure, operators stop the line immediately to prevent generating additional non-conforming inventory.
Reviewing quarantine logs during commercial or customs clearance disputes verifies whether flagged master rolls were fully excluded from export shipments. Documenting containment integrity prevents broad lot rejections by inspectors or retail buyers.
Roll Mapping and Quarantine Traceability Documentation
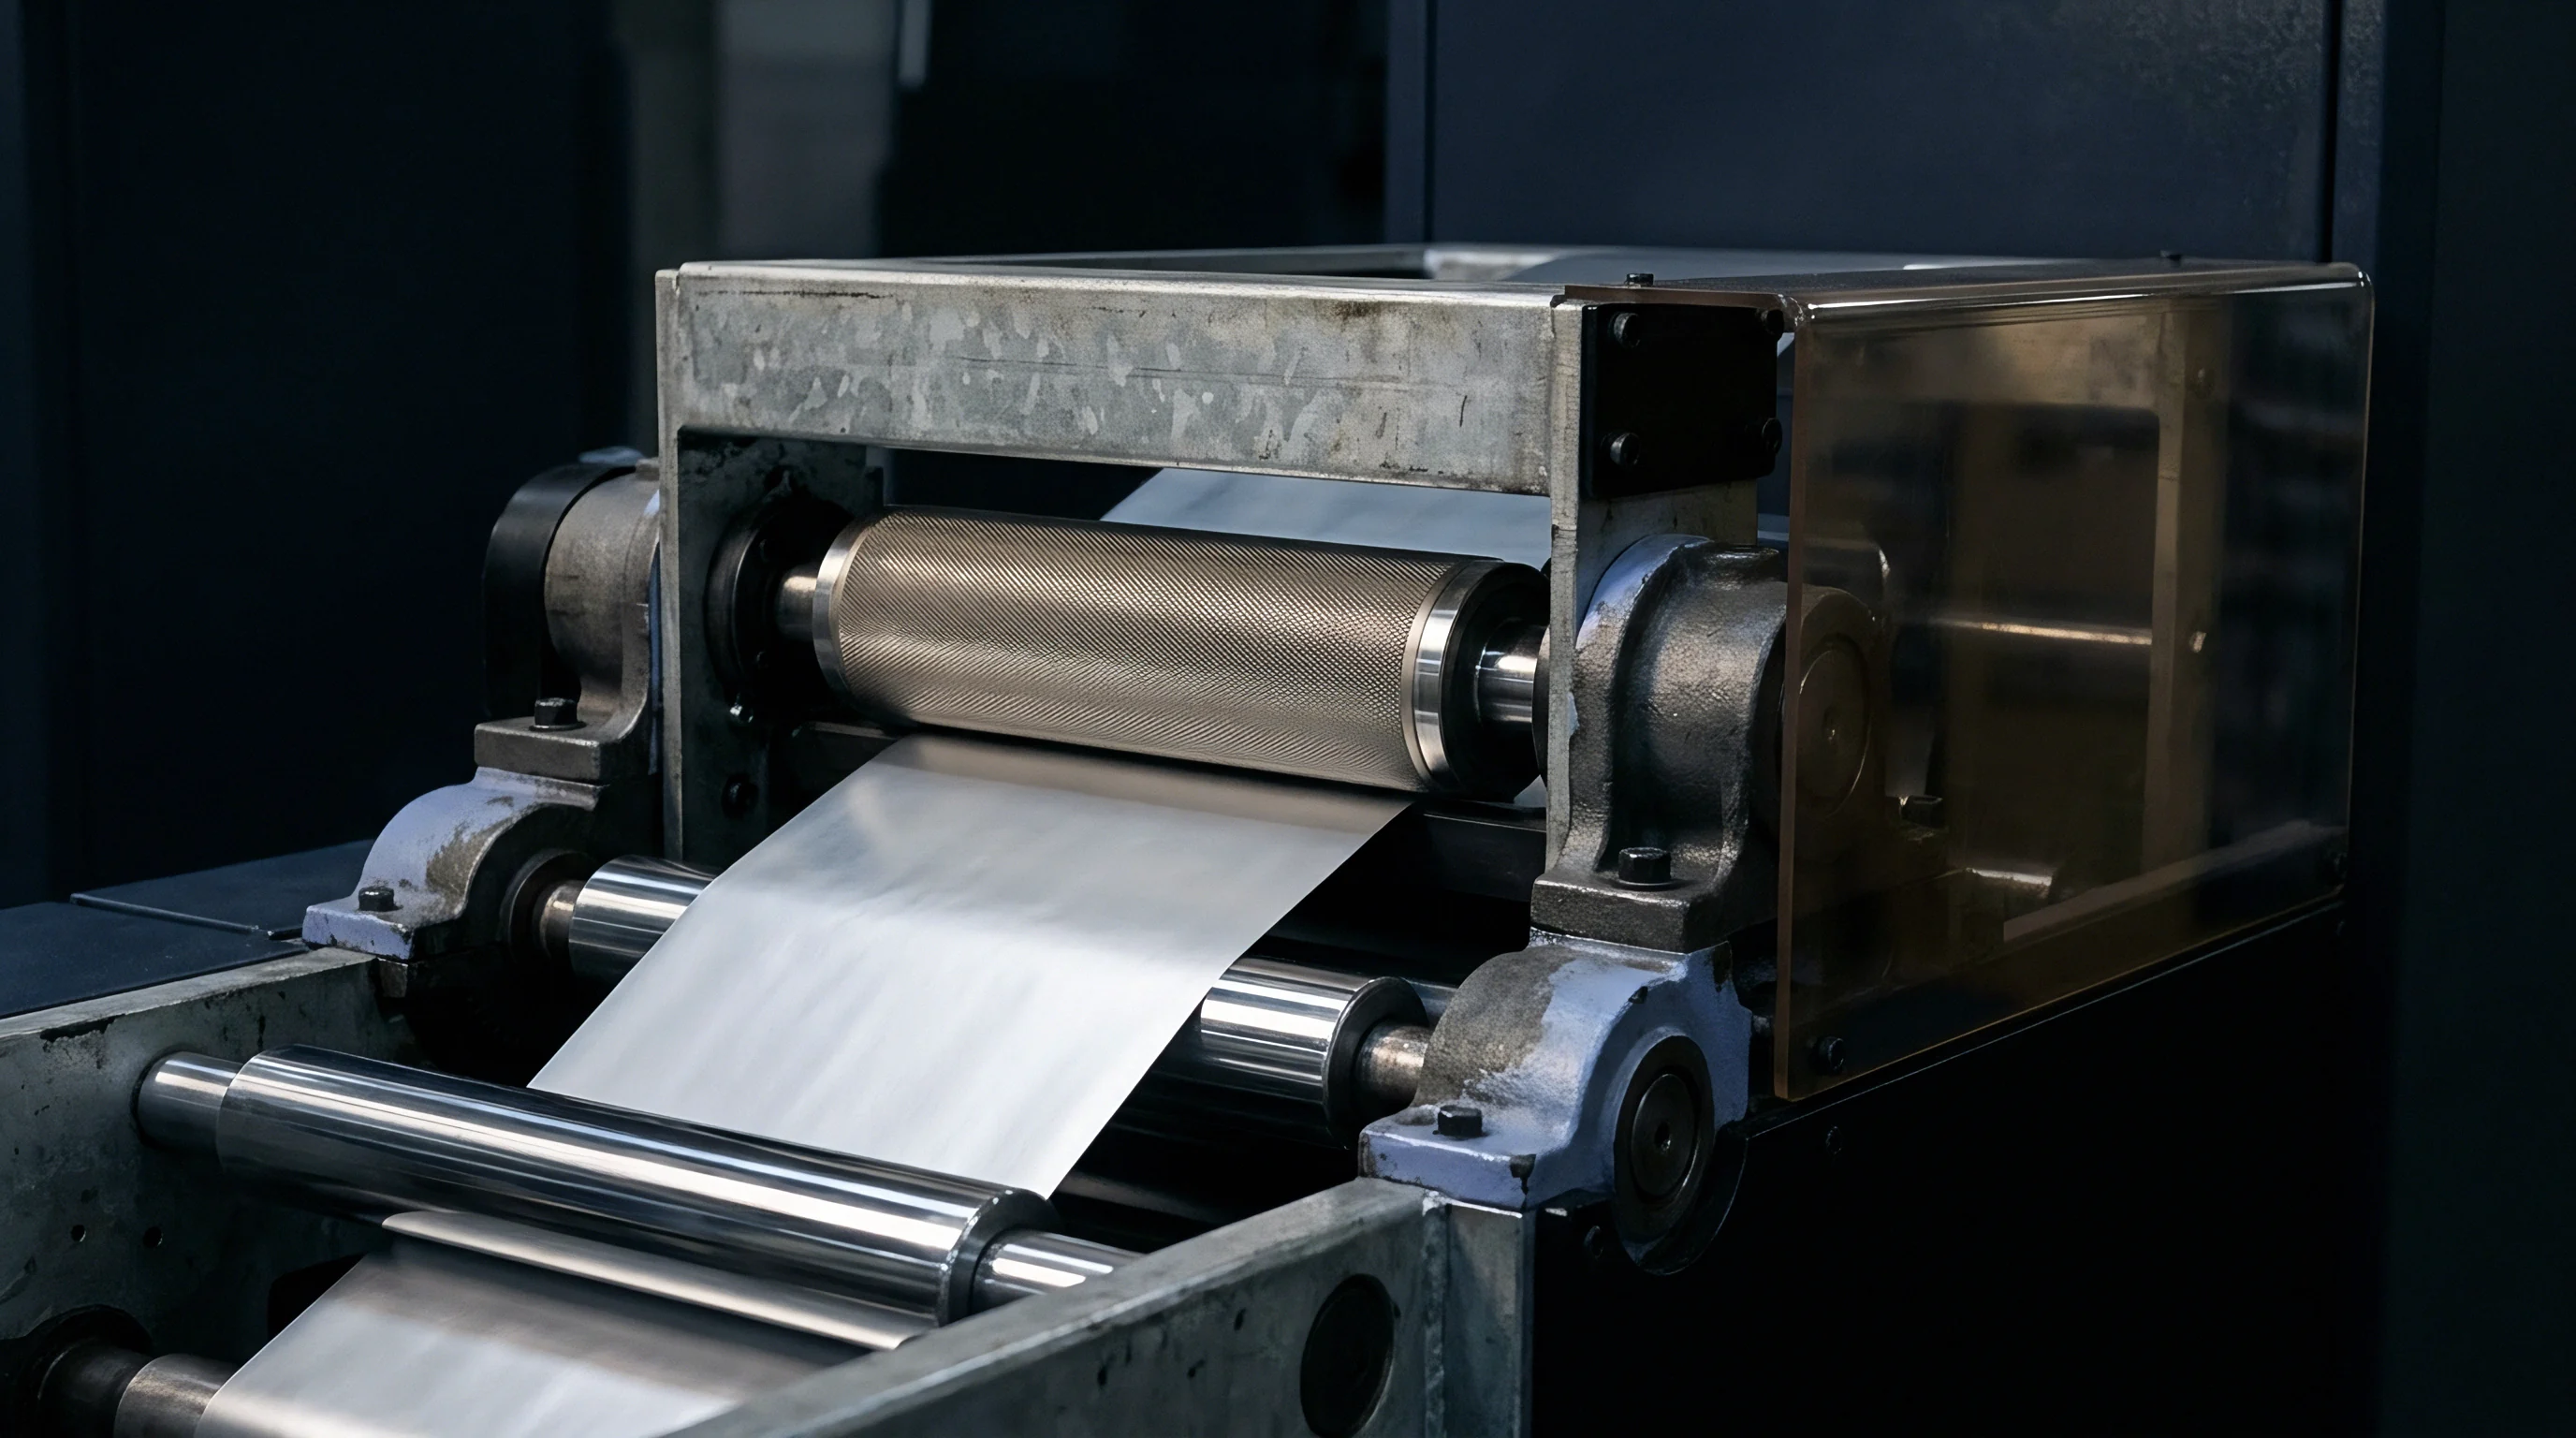
Tracking web defects down to individual slit coils requires precise spatial logging along the master roll length. Roll-mapping software records inspection camera defect locations, pairing cross-web coordinates with longitudinal footage so downstream slitter rewinders can automatically reject or trim out non-conforming segments.
Quarantine records must include comprehensive operational data to satisfy chain-of-custody and technical compliance standards:
- Master Reel Identifier links finished packaging inventory directly to parent jumbo roll production logs and raw material pulp lots.
- Defect Spatial Coordinates pinpoint exact longitudinal footage and cross-web lane locations for non-conforming material zones.
- Control Chart Trigger Events log the specific Western Electric rule breach or limit violation that initiated lot quarantine action.
- Disposition Sign-Off Records preserve quality manager authorization details for web rework, trimming, or scrap destruction.
Accurate roll maps prevent non-conforming web sections from advancing to secondary converting operations, where containment and scrap costs multiply exponentially.
Per ISO 9001 section 8.7 requirements, non-conforming outputs must be identified and controlled to prevent unintended use or delivery, requiring documented traceability records across all roll partitioning steps.
Structuring line logs around ISO 9001 clause 8.7.1 ensures that defect coordinates on master reel records directly support audit compliance and lot segregation.


Yield
Converting margins depend heavily on minimizing scrap caused by process instability and quality holds. Statistical process control links line variation directly to financial yield. Reducing coat weight variation allows converters to shift target nominals closer to lower specification limits without increasing off-spec risk, directly reducing raw resin and adhesive consumption.
Aligning process capability with commercial contract specifications prevents artificial scrap caused by over-specifying substrate parameters. When customer tolerances are tighter than line capability allows, scrap rates rise sharply. Negotiating specifications based on demonstrated statistical capability balances financial yield against functional packaging performance.
Aligning Natural Process Limits with Commercial Specifications
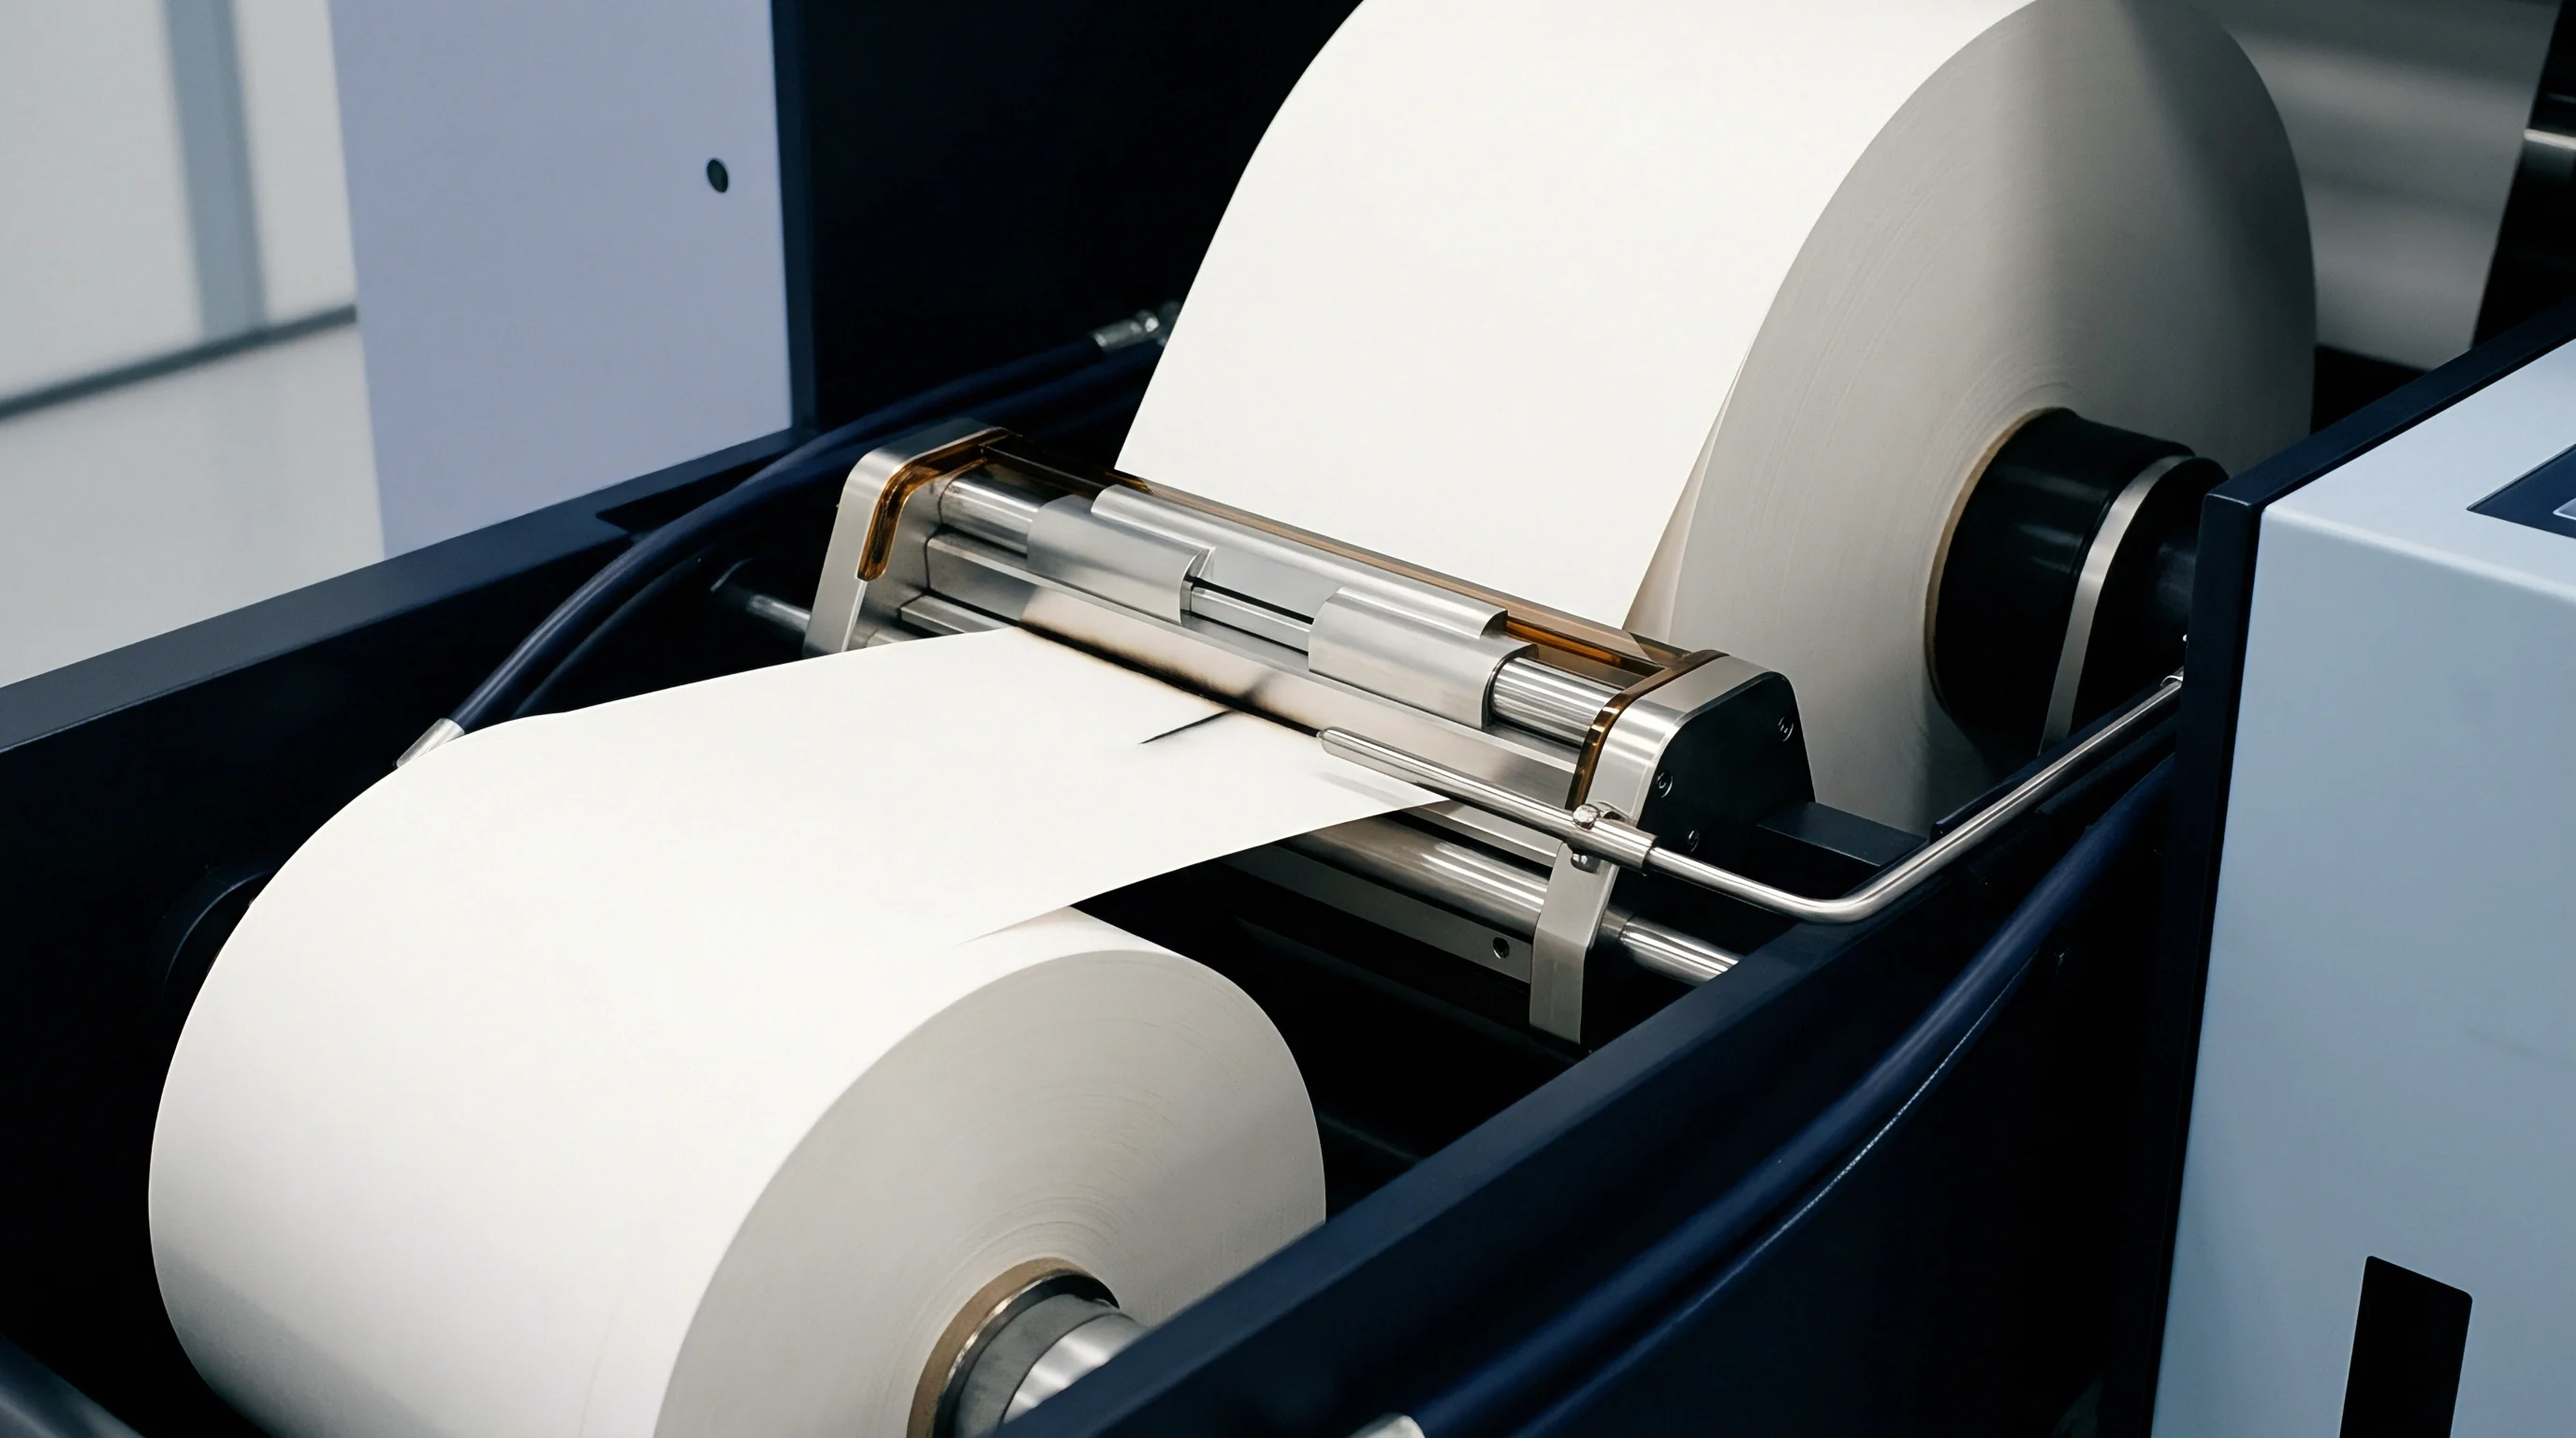
When customer specs are set tighter than natural process limits, a converting line cannot run scrap-free regardless of operator diligence. Setting realistic specification limits requires analyzing demonstrated statistical capability alongside downstream converting requirements.
Shifting coat weight target nominals downward yields substantial material savings in continuous extrusion operations. Tightening control bands makes target shifting safe without exposing the substrate to barrier failure risks.
| Control Regime | Coat Weight Target (g/m2) | Process Standard Deviation (σ) | Scrap Generation Rate (%) | Annual Polymer Usage (MT) | Direct Financial Impact ($) |
|---|---|---|---|---|---|
Operating advanced statistical control structures reduces raw resin consumption while preventing customer claims caused by barrier failure.

Contractual Exposure and Scrap Reclamation Mechanics
Supply agreements establish financial liability when delivered rolls fail on downstream packaging lines. Incorporating statistical control metrics into purchase contracts defines clear boundaries for claim validity when mill specifications and line capabilities diverge.
Reclaiming scrap value depends on operational records proving that non-conformance originated upstream. Mill certificates backed by statistical process control run data provide conclusive evidence during commercial disputes.
Implementing continuous statistical process control on lamination coat weight reduces resin consumption by five point six percent while maintaining strict regulatory barrier compliance.
Ultimately, statistical process control converts physical substrate predictability into verifiable commercial yield across all converted web products.
Applying statistical control across continuous substrate converting operations secures baseline material efficiency, stabilizes runnability, and protects long-term converting margins against unexpected scrap loss.