Paperboard Moisture Sorption Dynamics and Water Vapor Permeability Fundamentals
Paperboard moisture sorption and vapor permeability govern pack structural integrity and shelf life through fiber swelling, stiffness loss, and mass flux.
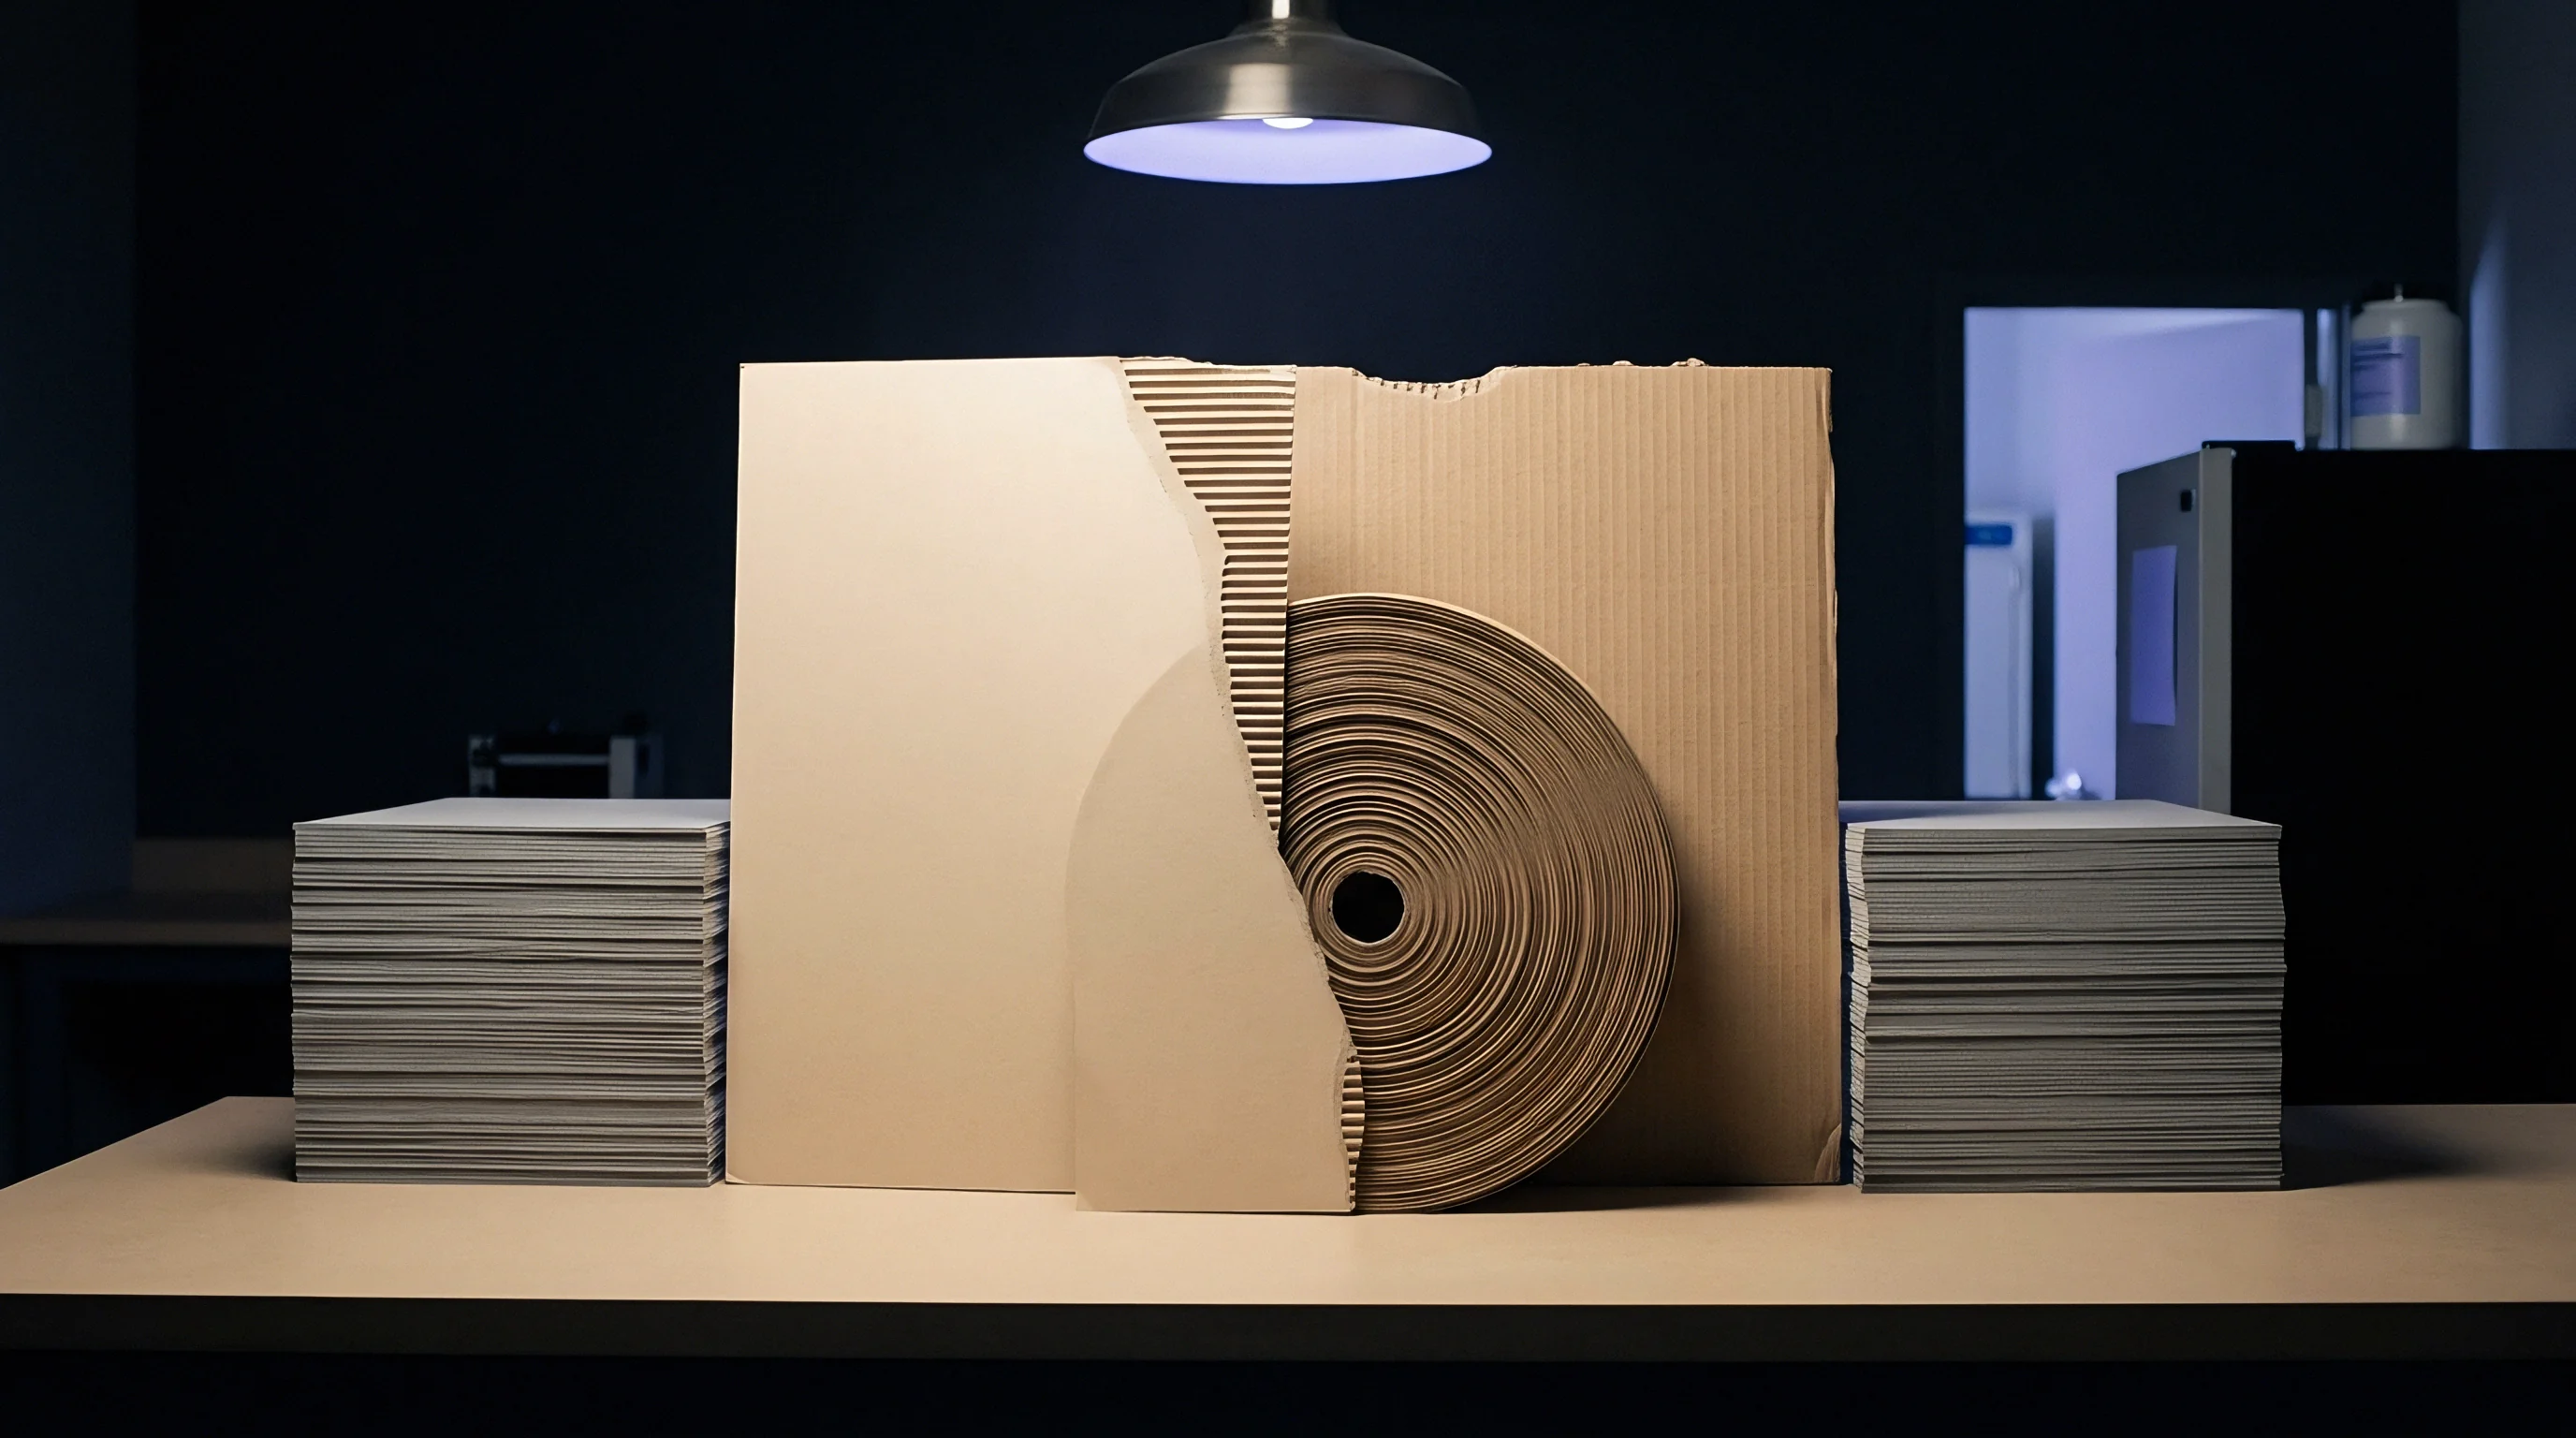
Isotherm
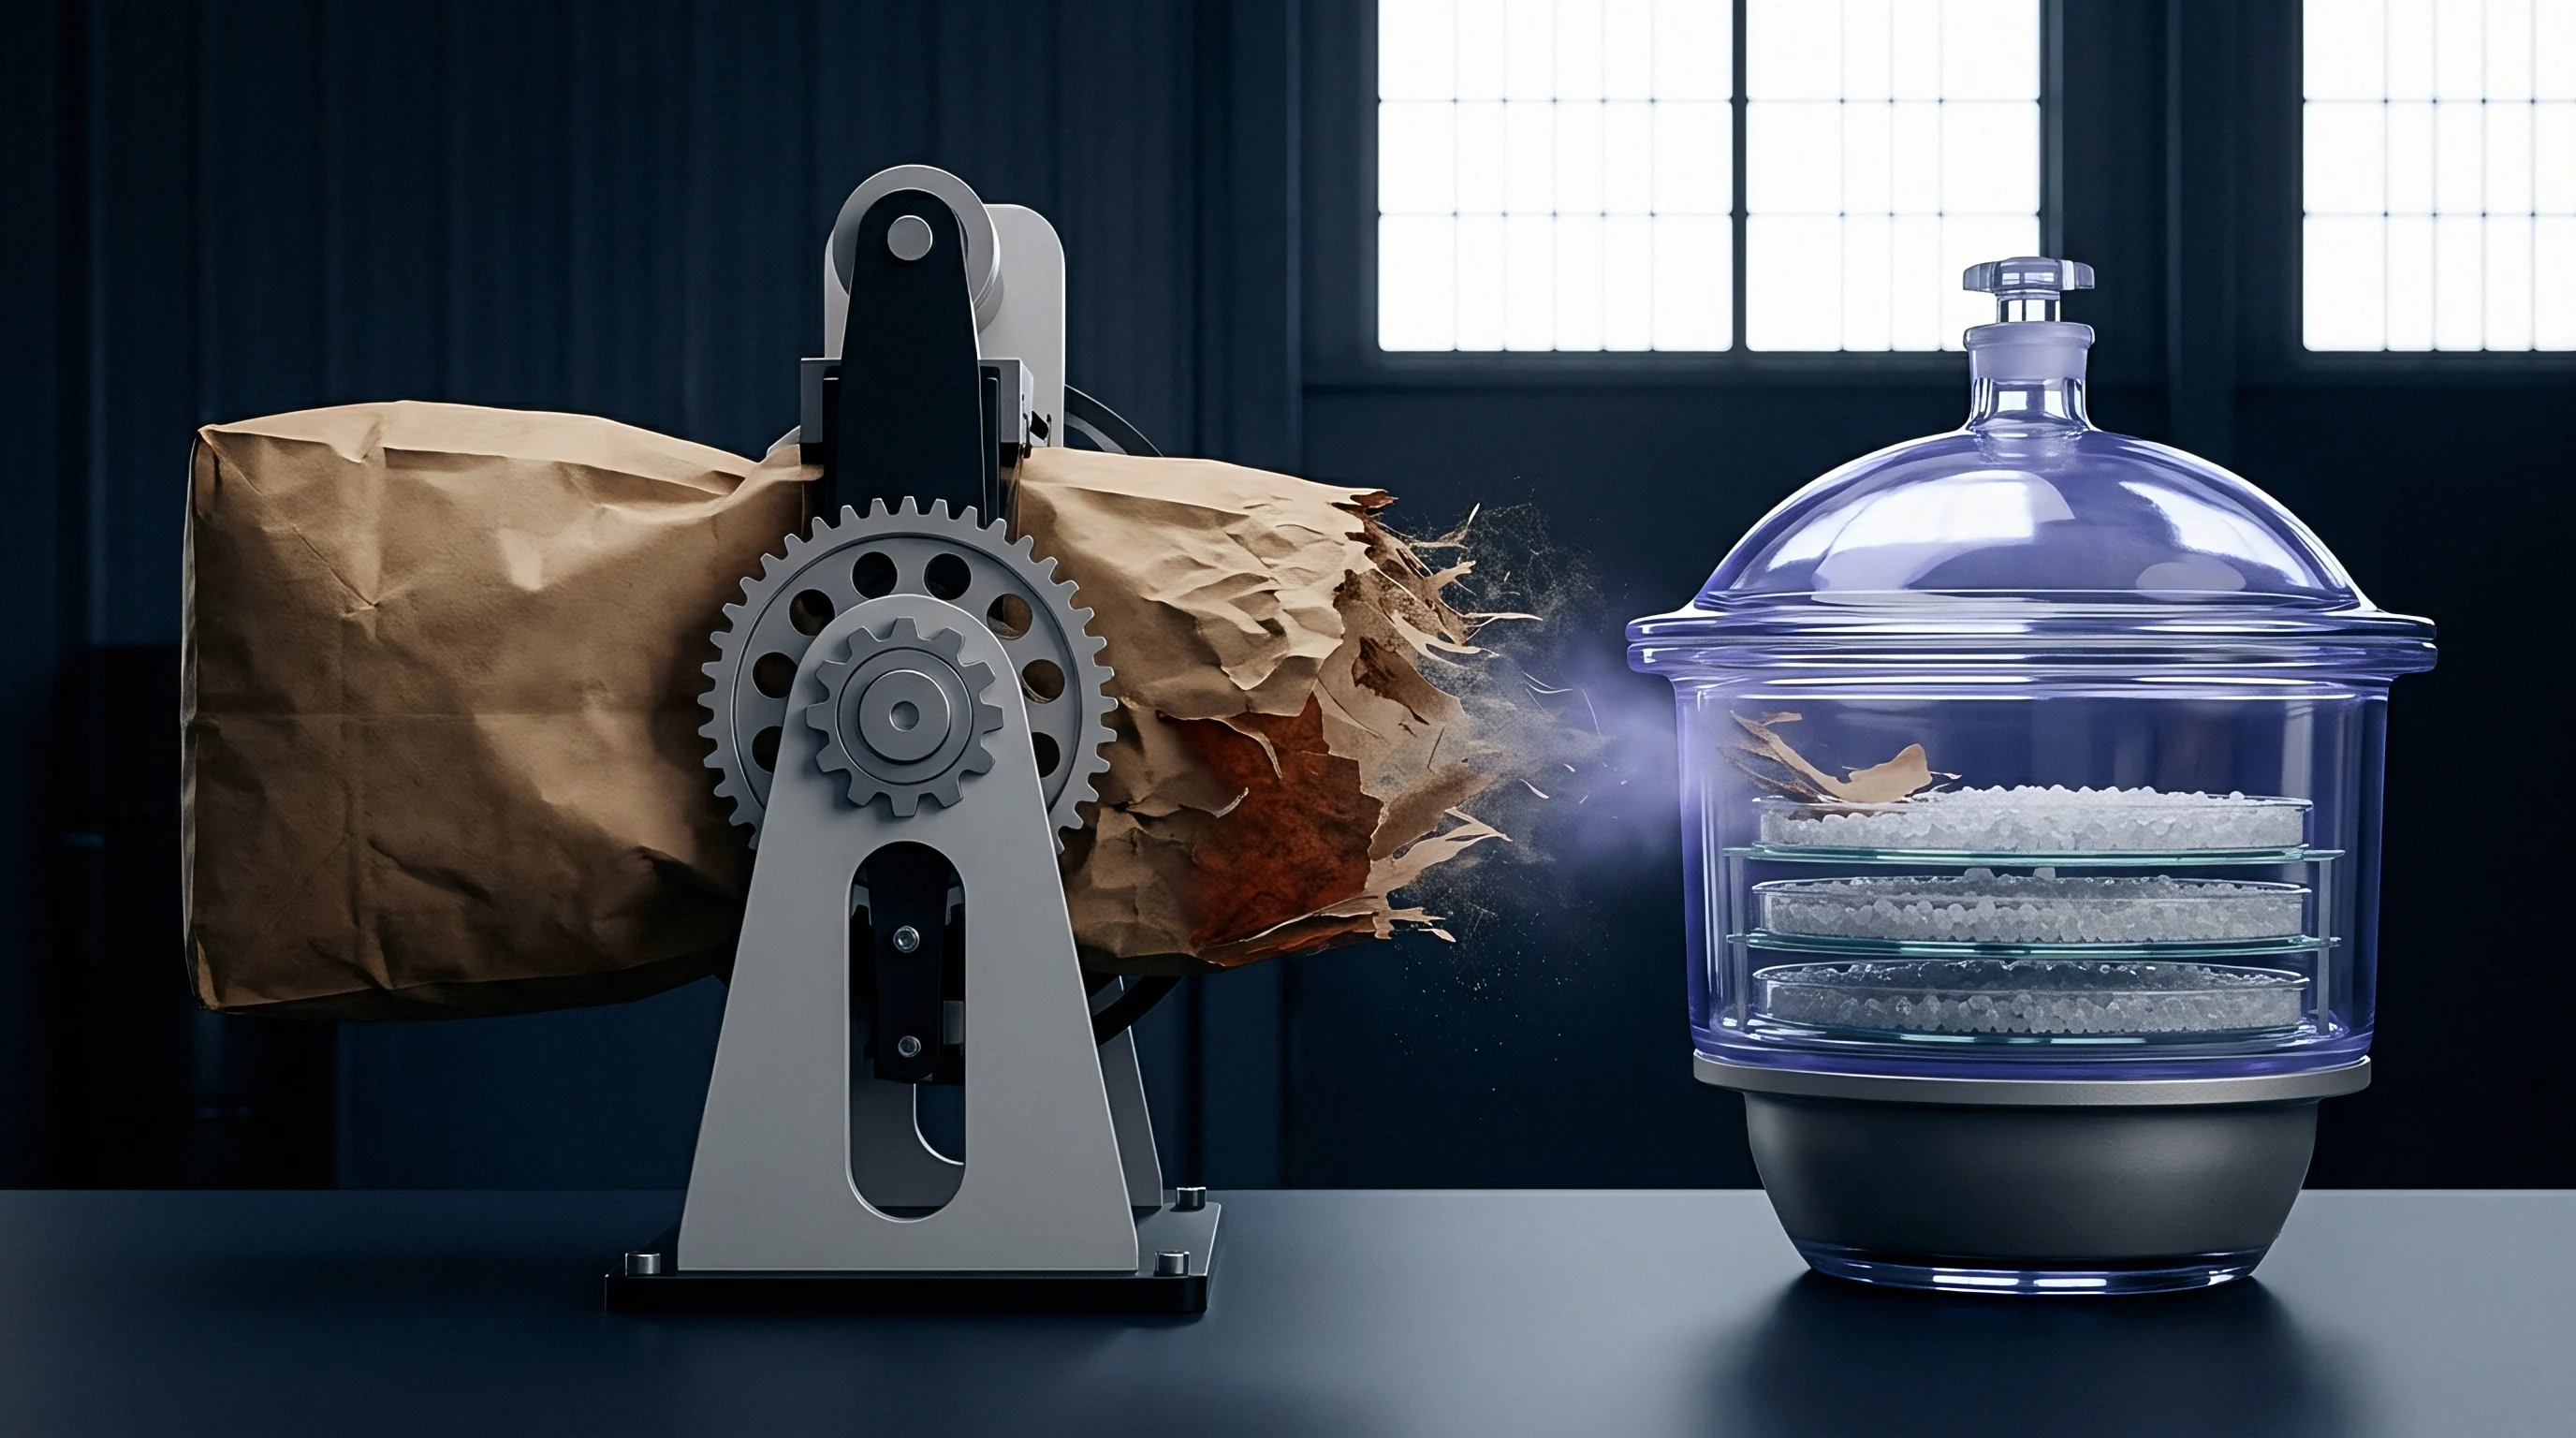
The equilibrium moisture content of paperboard depends directly on ambient relative humidity and temperature. Cellulose fibers are naturally hygroscopic, filled with accessible hydroxyl groups that bind water molecules through hydrogen bonds. When dry paperboard meets humid air, water adsorbs first as a monolayer onto microfibril surfaces.
As relative humidity rises, further water accumulates in multi-molecular layers inside internal pores and between fibers. This thermodynamic relationship defines the moisture sorption isotherm, mapping equilibrium moisture content against ambient water activity at a set temperature. Converters use this relationship to anticipate dimensional changes, softening, and barrier breakdown in packaging.
Cellulose fibers take up ambient moisture continuously until reaching thermal and hygroscopic equilibrium.
A clear hysteresis separates absorption and desorption across paperboard grades. Sorption hysteresis occurs because water uptake and water loss take different physical paths. As paper dries on the machine, hydroxyl groups on adjacent microfibrils draw close and bond directly to each other ~ a state called hornification.
When dry board reabsorbs water later, many of these internal hydrogen bonds stay closed, reducing the available hydroxyl binding sites. As a result, at any given relative humidity, a desorbing specimen holds more water than an adsorbing one. The size of this hysteresis loop depends on furnish chemistry, refining intensity, and internal sizing additives.
Cellulosic Sorption Physics and Hydrogen Bonding Mechanics
Dry wood fibers carry accessible hydroxyl groups within amorphous cellulose and hemicellulose polymers. By contrast, crystalline cellulose regions are packed into tight, parallel hydrogen-bonded structures that keep water from penetrating the internal lattice. Sorption therefore happens mainly in amorphous matrices, hemicellulose fractions, and accessible sites on microfibril surfaces.
Below 0.20 partial pressure, water molecules bind tightly to primary sites through high-energy enthalpy bonds. This strongly bound water loses mobility, behaving almost as part of the solid matrix with a density higher than bulk liquid water.
Capillary pores fill rapidly as water activity moves beyond the initial monolayer.
When water activity moves into the 0.20 to 0.70 range, secondary adsorption begins. Water molecules stack on top of the initial monolayer, bonding with previously sorbed water rather than directly to cellulose. This multilayer water has lower binding energy and greater mobility.
Above 0.70 water activity, capillary condensation takes over in small pores according to the Kelvin equation. Driven by surface tension and curved menisci, liquid water condenses inside micro-pores. This shift from surface adsorption to pore-filling absorption sharply alters the mechanical behavior of the sheet.
Equilibrium moisture content of unbleached kraft board reaches 7.8 percent at 23°C and 50 percent relative humidity under ISO 187 conditioning.
Furnish composition dictates sorption across all humidity ranges. Bleached chemical pulps, rich in cellulose, show moderate sorption because crystalline regions block moisture. Unbleached kraft pulps contain significant residual lignin; while hydrophobic compared to hemicellulose, it creates a porous structure that holds moisture during capillary condensation.
Thermomechanical pulps with high hemicellulose content absorb more water across intermediate humidities, owing to the open, branched structure of amorphous hemicellulose. Recycled furnishes with shortened fibers have lower monolayer capacity because of hornification accumulated over repeated drying cycles.
| Furnish Grade | Fiber Composition | Monolayer Moisture M0 (%) | GAB Constant C | GAB Constant K | Equilibrium Moisture at 50% RH (%) |
|---|---|---|---|---|---|
| Solid Bleached Sulfate (SBS) | 100% Bleached Kraft Hardwood/Softwood | 4.2 | 14.5 | 0.76 | 6.4 |
| Unbleached Kraft (CUK) | 100% Unbleached Virgin Kraft | 4.8 | 18.2 | 0.78 | 7.8 |
| Recycled Coated News (CRB) | 100% Recycled Deinked Fiber | 3.6 | 11.0 | 0.72 | 5.8 |
| Folding Boxboard (FBB) | Bleached Kraft Layers / Mechanical Core | 5.1 | 16.4 | 0.81 | 8.2 |
Mathematical Isotherm Models and Sigmoidal Curve Fitting
Industrial moisture models rely on sorption equations that map equilibrium moisture content against water activity. The Brunauer-Emmett-Teller (BET) model fits well at low water activity (below 0.35), but breaks down at higher humidities because it assumes infinite multilayer stacking without pore spatial limits. The Guggenheim-Anderson-de Boer (GAB) equation remains valid from 0.10 to 0.90 water activity, making it the standard model for paperboard sorption.
The GAB equation uses three parameters to fit the sigmoidal sorption isotherm of cellulosics. The parameter M0 is the monolayer moisture content, marking where primary sorption sites saturate. Constant C reflects the enthalpy difference between monolayer and multilayer adsorption, controlling the sharp initial knee of the curve.
Constant K accounts for interactions between multilayer water and bulk liquid water, adjusting curvature at high water activity. Fitting test data to GAB yields monolayer values that help set heat profiles on converting lines and optimize barrier coat drying.
Sorption hysteresis inherently shifts the shape of absorption and desorption curves.
Bound water within the cellulose matrix directly influences final sheet dimensions.
Refining alters GAB parameters by changing internal fiber surface area. Mechanical refining splits fibers into finer fibrils, exposing secondary hydroxyl groups once buried in the cell wall. Highly refined virgin pulps show higher monolayer values because of this added surface area.
At the same time, heavy refining increases drying hornification, creating wider hysteresis loops during rewetting. Mills must balance refining to meet strength targets without causing severe moisture instability.
Packaging designers remain uncertain whether sub-zero temperature shifts permanently alter the molecular monolayer capacity of recycled fiber networks during cold-chain distribution.
Diffusion
Mass transfer of water vapor across paperboard occurs through connected void networks via three simultaneous pathways: vapor diffusion through inter-fiber pores, surface diffusion along lumens, and bound water diffusion within the cell wall matrix. In porous substrates under ordinary conditions, vapor movement through air-filled pores dominates transport kinetics. Transmission rates depend on partial vapor pressure differences across the sheet, ambient pressure, temperature, and web pore architecture.
Water vapor moves along established concentration and partial pressure gradients.
Fickian diffusion models govern steady-state vapor transport across paperboard when the moisture gradient remains constant. Fick’s first law defines vapor flux as proportional to the concentration gradient times an effective diffusion coefficient. This effective coefficient is far smaller than the binary diffusion coefficient of vapor in open air.
The fiber network creates a tortuous path, forcing vapor molecules through winding channels where they repeatedly collide with pore walls and adsorb onto surfaces.
Fickian Vapor Transport through Fiber Pore Architecture
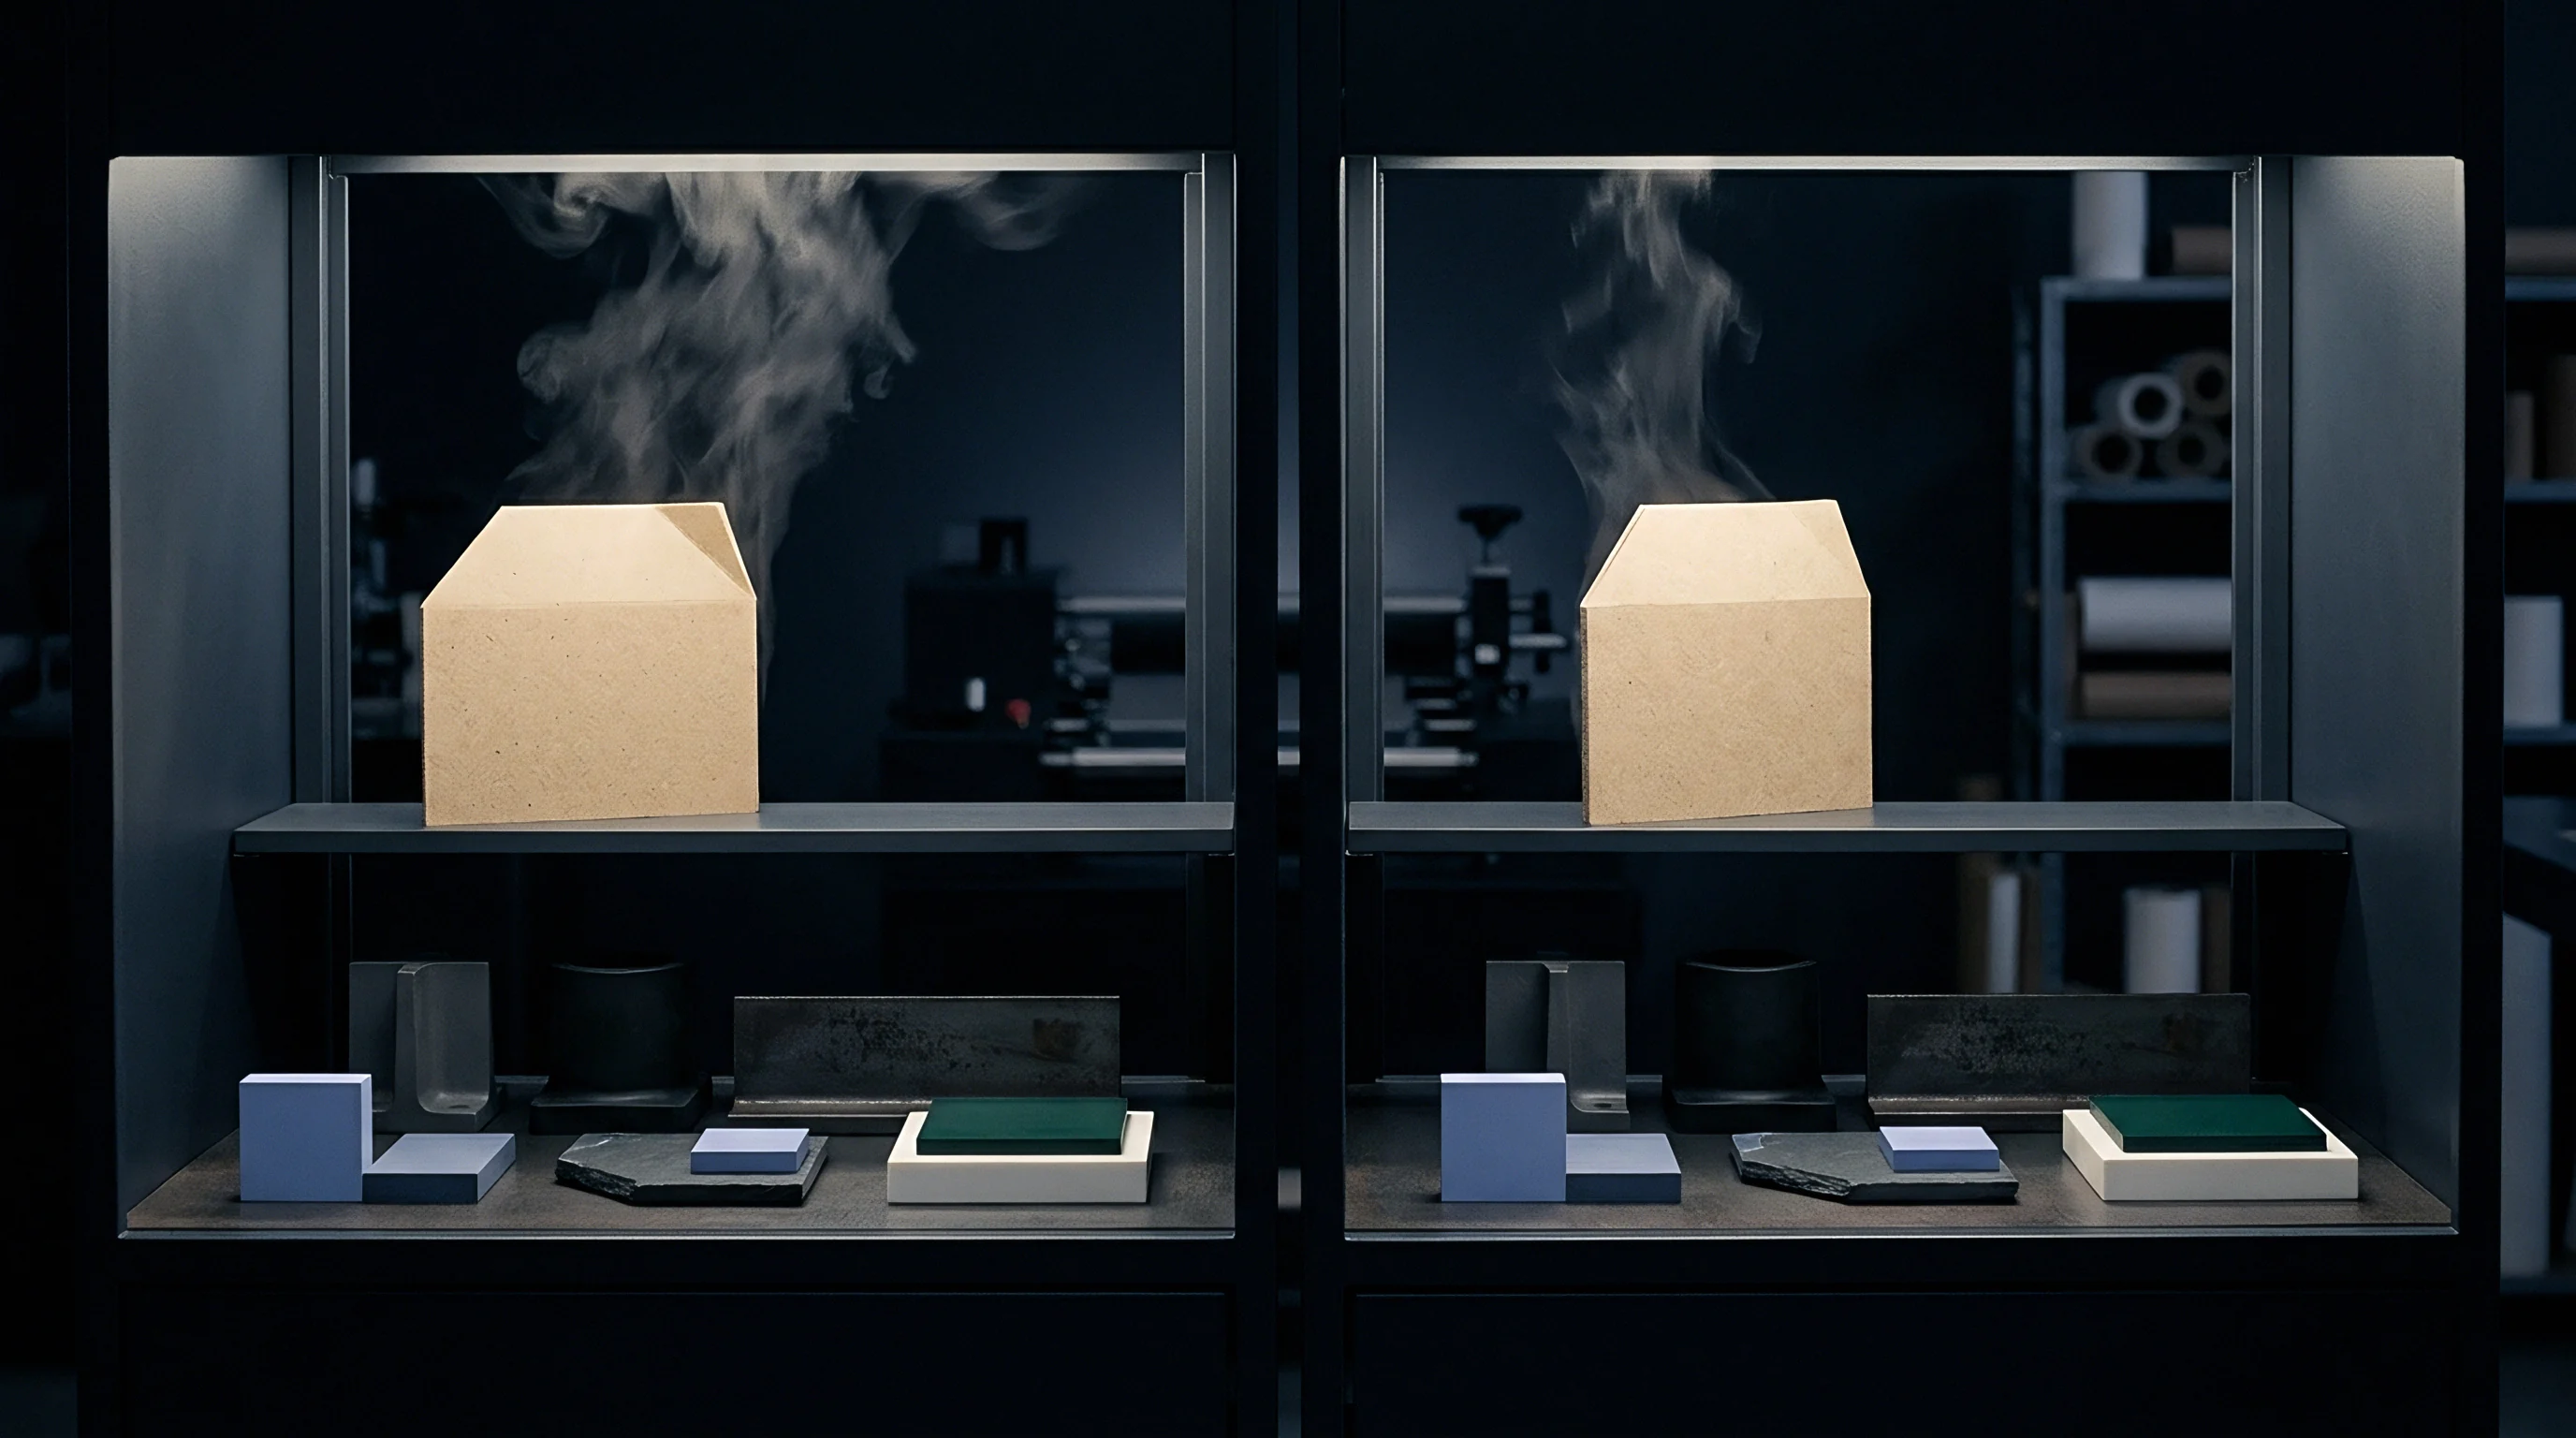
Water vapor moves through porous networks along partial pressure gradients across the sheet. Pore size distribution dictates which diffusion mechanism dominates. When pore diameters exceed the mean free path of water vapor (around 68 nanometers at standard atmospheric conditions), Fickian bulk diffusion drives transport.
In dense coatings or heavily refined zones where pores shrink below that mean free path, Knudsen diffusion takes over. There, vapor molecules collide more often with pore walls than with each other, slowing overall transport.
Higher ambient temperatures noticeably accelerate vapor diffusion rates.
Tortuosity provides the main structural resistance to vapor movement in uncoated board. It measures the ratio between the path length a vapor molecule actually travels and the straight-line thickness of the board. Mechanical refining increases tortuosity by flattening fibers and collapsing inter-fiber voids into a denser, more winding network.
Wet pressing on the machine compresses z-axis density even further, extending path lengths and lowering effective diffusion coefficients.
- Lumen Condensation Pathing Water molecules condense within tubular fiber cavities, accelerating liquid transport across high-density board layers.
- Tortuous Pore Channelling Structural variations in inter-fiber void space force vapor along extended trajectories, reducing net mass transfer rates.
- Surface Hydroxyl Hopping Bound water molecules jump between adjacent cellulose sites along internal fiber surfaces under elevated partial pressures.
- Micro-Fissure Permeation Defective surface sizing creates localized micro-voids that allow rapid vapor bypass around dense surface fibers.
Concentration Dependence and Z-Axis Density Gradients
Transport rates change non-linearly as local moisture causes internal swelling. The effective diffusion coefficient is not constant; it rises exponentially with local moisture content. Sorbed water swells amorphous cellulose regions, opening micro-cavities within cell walls and increasing bound-water mobility.
Because of this concentration dependence, board exposed to high relative humidity on one side absorbs vapor much faster than linear Fickian models predict.
Paperboard has a non-uniform z-axis density profile caused by hydrodynamic shear during web formation and asymmetric vacuum dewatering. Multi-ply grades like folding boxboard (FBB) or solid unbleached kraft (CUK) intentionally vary density across their cross section: outer plies use dense, refined chemical pulps for strength and printing, while middle plies use bulkier mechanical pulp. Calculating vapor diffusion through these sheets requires determining layer-specific diffusion coefficients and integrating transport across distinct density zones.
Higher temperatures accelerate vapor diffusion by boosting the kinetic energy of water molecules and lowering the binding energy at hydroxyl sites. This temperature dependence follows an Arrhenius relationship, with activation energy representing the energy needed for vapor to break hydrogen bonds and jump to adjacent sites. In hot, humid conditions, increased kinetic energy and moisture swelling combine to drive rapid vapor transport through unprotected packaging.
Elevated cross-direction vapor transmission can originate from unconditioned storage conditions at converting facilities rather than inconsistent internal sizing dosages.

Distortion
Dimensional instability stems from the anisotropic swelling of individual wood fibers as they take on moisture. A single cellulose fiber swells 15 to 20 percent in diameter, but less than 1 to 2 percent along its length. Because papermaking aligns fibers mostly in the machine direction (MD), paperboard shows strong dimensional anisotropy.
Cross-direction (CD) hygroexpansion exceeds MD expansion by three to five times, causing panels to distort unevenly when relative humidity shifts during storage, transit, or converting.
Fiber alignment across the sheet largely determines the direction and severity of curl.
Cross-direction dimensional drift develops significantly under cycling humidity conditions, while mechanical stiffness drops sharply as moisture content rises. Sheet stiffness depends on hydrogen bonds holding adjacent fibers rigid; as absorbed water plasticizes the network, it pushes cellulose chains apart, weakening those bonds and lowering elastic modulus. When sheet moisture increases from 6 percent to 12 percent, Taber stiffness often falls by more than 40 percent, causing bowed carton panels, leaning pallet stacks, and compression failures.
What Triggers Structural Flute Roll-Out in Humid Transit?
High ambient humidity causes medium fibers to expand laterally while stacking loads flatten the flute arches. In corrugated containers, moisture weakens the fluted medium faster than the outer liners. The arch geometry depends on flexural stiffness to carry top loads; as moisture plasticizes the flutes, they lose rigidity and roll over under vertical pressure.
This collapse happens quickly under cycling humidity due to mechano-sorptive creep.
- Condition test specimens in an atmosphere of 23°C and 50 percent relative humidity for 24 hours per ISO 187 specifications.
- Mount the sample into a dual-clamp tensile frame equipped with an environmental test enclosure.
- Ramp relative humidity from 50 percent to 90 percent over a two-hour duration while maintaining constant mechanical load.
- Record dimensional expansion along machine and cross directions using non-contact optical laser extensometers.
- Transfer specimens to a 105°C drying oven until dry mass stabilizes to calculate total hygroexpansion strain.
Hygroexpansion Anisotropy and Creep under Dynamic Humidity
Machine-direction fiber alignment makes cross-direction swelling up to five times greater than MD expansion. Mechano-sorptive creep describes the accelerated deformation that occurs when paperboard experiences load and shifting relative humidity simultaneously. While static creep under constant humidity develops slowly, fluctuating between 50 percent and 90 percent RH produces deformation rates an order of magnitude higher.
Each cycle of absorption and desorption breaks and reforms hydrogen bonds while under strain, causing permanent structural set.
ISO 2493 stiffness testing conducted outside standard atmosphere invalidates commercial rejection claims.
Bending stiffness drops rapidly as moisture levels rise in the sheet.
Curl and cockle are common converting defects driven by moisture gradients across sheet thickness. Curl creates continuous curvature due to unequal hygroexpansion between top and bottom plies. If the top ply absorbs moisture faster than the bottom, it expands and forces the sheet to curl toward the drier side.
Cockle forms localized, irregular puckers, usually caused by non-uniform basis weight, local fiber alignment variations, or uneven drying stress during manufacture.
| Substrate Grade | MD Hygroexpansion (50% to 90% RH) (%) | CD Hygroexpansion (50% to 90% RH) (%) | Anisotropy Ratio (CD/MD) | Taber Stiffness Retention at 85% RH (%) |
|---|---|---|---|---|
| Solid Bleached Sulfate (SBS) | 0.12 | 0.48 | 4.00 | 62 |
| Coated Unbleached Kraft (CUK) | 0.09 | 0.42 | 4.67 | 68 |
| Folding Boxboard (FBB) | 0.15 | 0.55 | 3.67 | 54 |
| White Lined Chipboard (WLC) | 0.18 | 0.72 | 4.00 | 45 |
| Stiffness retention measured per ISO 2493 against baseline performance at 23°C and 50% RH. | ||||
Panel instability in folding cartons causes significant downtime on high-speed packaging lines. Blistering, score-line cracking, and bowed flaps develop when cartons absorb moisture on their way to filling plants. Automatic feeders need flat panels to vacuum-pick and erect blanks; bowed panels break suction and jam the machine.
Resolving this requires adjusting carton dimensions, increasing caliper, or using functional barrier coatings to isolate fibers from ambient moisture.
Inadequate hygroexpansion controls lead directly to carton jam failures in high-speed automated packaging lines and costly pallet collapses in high-humidity transit lanes.
Foil
Polymer barriers and metallic laminates turn porous paperboard into protective packaging. Uncoated board has virtually no barrier performance, with water vapor transmission rates exceeding several hundred grams per square meter per day under standard conditions. Applying barrier coatings blocks inter-fiber pores and shuts down gas and vapor transport.
Choosing between extrusion coatings, aqueous dispersions, or foil laminates depends on required shelf life, converting flexibility, waste fees, and packaging costs.
Polymer film layers act as effective barriers to water vapor migration.
Extrusion-coated low-density polyethylene (LDPE) is widely used to add moisture barriers to paperboard. Molten LDPE extruded onto the moving web anchors mechanically into top fibers. While LDPE resists liquid water effectively, its non-polar hydrocarbon structure offers only moderate vapor resistance, requiring heavier coat weights to reach low permeance targets in humid conditions.
Barrier Polymer Architecture and Extrusion Coating Boundaries
Extruded polyethylene forms a continuous hydrophobic layer across uneven paperboard surfaces. High-density polyethylene (HDPE) resists vapor transmission better than LDPE because of its higher crystallinity and tighter chain packing. However, HDPE requires higher processing temperatures and has lower flexural elasticity, making it prone to micro-cracking when folded around tight carton scores.
Co-extruded films combining an LDPE tie-layer with an HDPE barrier layer balance surface adhesion with moisture protection.
- Pinhole Discontinuities Microscopic voids in molten extrusion films allow unhindered water vapor pass-through across low grammage regions.
- Interfacial Delamination Poor surface energy matching causes polymer films to peel away from paperboard substrates during scoring operations.
- Crease Line Fracture Brittle barrier layers crack along package fold lines, destroying overall vapor resistance under mechanical stress.
- Thermal Seal Thinning Excessive heat application during package sealing thins barrier layers, creating localized vapor leakage points.
Score-Line Micro-Cracking and Aqueous Dispersion Integrity
Water-based polymer coatings offer recyclable barrier options, but can fracture along heavy score lines. These dispersion coatings ~ typically styrene-butadiene copolymers or acrylic esters suspended in water ~ are applied by rod or curtain coaters. As the water evaporates, polymer particles coalesce into a continuous film over the fibers.
Achieving defect-free performance requires complete film formation, demanding tight control over web temperatures and drying rates to prevent pinholes or micro-bubbles.
Formation of micro-pinholes severely degrades overall barrier performance.
Polymer coating thickness matches base sheet surface roughness to eliminate pinhole vapor channels.
Aluminum foil laminates give high moisture barrier performance in both flexible and rigid packaging. Foil layers 6 to 9 micrometers thick have near-zero vapor transmission when intact. However, flexing and scoring during converting can fracture brittle foil, creating pathways for vapor.
Laminating aluminum foil with protective LDPE or PET cover layers shields the metal layer against flex-cracking during conversion.
Cobb testing under ISO 535 measures liquid water uptake over set intervals, giving metrics distinct from water vapor transmission. A board with a low Cobb 60 rating (below 20 grams per square meter) can still suffer from high vapor permeability. Liquid testing evaluates surface sizing hydrophobic behavior and capillary action, whereas vapor permeability measures flux driven by partial pressure differences across the barrier film.
Complete barrier specification requires testing liquid absorption and vapor permeance separately.
Specifying maximum Cobb 30 values under ISO 535 standard clauses shifts financial liability to the paper mill when surface water absorption exceeds contracted thresholds.

Permeance
Water vapor transmission rate (WVTR) measures the mass of vapor passing through a unit area of paperboard per unit time under set gradient conditions. Permeance standardizes this by dividing flux by the partial pressure difference across the sheet faces. Permeability normalizes permeance further by accounting for caliper, yielding an intrinsic transport property.
For multi-layer structures, permeability calculations get complicated by structural variations, so permeance and total flux remain the practical engineering metrics for package design.
Gravimetric dry cup methods measure steady-state vapor flux under controlled conditions.
Standardized test methods require tight control over climate, dish geometry, and edge sealing. ISO 2528 defines gravimetric WVTR testing via dry cup or wet cup procedures. In dry cup testing, a desiccant like anhydrous calcium chloride is sealed inside a dish under the specimen, maintaining 0 percent relative humidity inside.
The dish assembly sits in a climate chamber kept at fixed temperature and humidity, creating a constant partial pressure driving force across the material.
Standardized Test Method Methodologies and Environmental Chamber Verification
Gravimetric dry cup methods measure vapor flux by sealing desiccant inside test dishes placed in controlled humidity cabinets. Technicians weigh the dishes periodically to measure mass gain over time. Once steady-state diffusion takes hold, plotting weight gain against time yields a straight line.
The slope of this linear portion gives the steady-state transmission rate in grams per square meter per 24 hours.
Wet cup methods use distilled water or saturated salt solutions inside the dish, creating a 100 percent or controlled high-humidity interior. This measures diffusion from inside the dish out to a drier test cabinet. Because paperboard diffusion coefficients rise with moisture concentration, wet cup tests consistently give higher transmission values than dry cup tests on the same material under equivalent relative humidity gradients.
Engineers should verify which orientation was used when reviewing test certificates.
- Atmospheric Conditioning Log Test reports show temperature and humidity charts confirming continuous compliance with ISO 187 tolerances throughout exposure.
- Specimen Edge Sealing Protocol Quality documents specify microcrystalline wax blends used to eliminate lateral edge diffusion around dish perimeters.
- Instrument Calibration Certificate Sensor-based test methods include traceable calibration records against reference polymer films of known vapor flux.
- Replicate Test Deviation Data Mill MTRs state individual sample values and calculated standard deviations across minimum five specimen runs.
Sensor-based instrumental methods, such as electrolytic systems (ISO 15106-2) or modulated infrared systems (ISO 15106-3), speed up testing. These automated instruments replace manual weighing with continuous electronic monitoring of vapor accumulating in a dry carrier gas stream. Sensor methods detect pinholes and micro-leaks faster than gravimetric cups, though high-barrier laminates still need extended runs to reach stable baseline readings.
| Substrate Configuration | Caliper (µm) | Test Condition (Temp / RH) | Test Method Standard | WVTR (g/m²·day) |
|---|---|---|---|---|
| Uncoated Solid Bleached Sulfate | 400 | 23°C / 50% RH | ISO 2528 (Dry Cup) | 450.0 |
| Clay-Coated Folding Boxboard | 450 | 23°C / 50% RH | ISO 2528 (Dry Cup) | 310.0 |
| SBS / 15 g/m² LDPE Extrusion | 420 | 23°C / 50% RH | ISO 2528 (Dry Cup) | 8.5 |
| SBS / 15 g/m² LDPE Extrusion | 420 | 38°C / 90% RH | TAPPI T464 (Tropical) | 42.0 |
| SBS / 12 g/m² Aqueous Dispersion | 415 | 23°C / 50% RH | ISO 15106-2 (Electrolytic) | 14.0 |
| FBB / 7 µm Aluminum Foil Laminate | 480 | 38°C / 90% RH | ISO 15106-3 (Infrared) | 0.05 |

Mathematical Quantification of Multi-Layer Moisture Flux
Calculating composite barrier performance uses a series-resistance model. In multi-layer structures made of paperboard, tie-layers, and barrier coatings, total vapor transport resistance equals the sum of individual layer resistances. Structural permeance is simply the reciprocal of total resistance, enabling engineers to model coating thickness adjustments without running physical trials for every formulation tweak.
Composite permeance values for a triple-layer barrier under tropical conditions follow series-resistance equations. Consider a substrate built from a 300 micrometer solid bleached sulfate base sheet, a 15 micrometer polyethylene extrusion layer, and an 8 micrometer dispersion topcoat. Setting resistance R equal to layer thickness L divided by intrinsic permeability P, total resistance is expressed as:
R_total = (L_board / P_board) + (L_polymer / P_polymer) + (L_dispersion / P_dispersion)
Assuming intrinsic water vapor permeability values measured at 38°C and 90 percent relative humidity:
Base Board Permeability = 1.2 x 10^-6 grams per meter-day-Pascal
Polyethylene Permeability = 2.5 x 10^-10 grams per meter-day-Pascal
Dispersion Layer Permeability = 6.0 x 10^-10 grams per meter-day-Pascal
Calculating individual layer resistances:
R_board = 0.000300 / (1.2 x 10^-6) = 250 Pascal-meter-squared-day per gram
R_polymer = 0.000015 / (2.5 x 10^-10) = 60000 Pascal-meter-squared-day per gram
R_dispersion = 0.000008 / (6.0 x 10^-10) = 13333 Pascal-meter-squared-day per gram
Summing these gives R_total equal to 250 plus 60000 plus 13333, or 73583 Pascal-meter-squared-day per gram. Reciprocating R_total gives a total structural permeance of 1.36 x 10^-5 grams per meter-squared-day-Pascal. Under a tropical partial pressure differential of 5280 Pascals, expected vapor flux is 0.0718 grams per square meter per day.
The polyethylene layer alone accounts for over 81 percent of total transport resistance, whereas the base board provides less than 0.4 percent.
Doubling the extrusion layer thickness cuts vapor transmission rates in half across solid bleached sulfate boards.
Preservation
Shelf-life calculations for moisture-sensitive products link internal equilibrium relative humidity directly to package permeance. Dry goods like infant formula, crisp snacks, and hygroscopic pharmaceuticals spoil or degrade once internal moisture crosses critical thresholds. Designing effective packaging means matching product sorption isotherms against total package permeance to keep contents within safe water activity limits through target shelf life.
Internal moisture equilibrium directly dictates product shelf life.
Strict vapor transmission limits in paperboard purchasing contracts protect product shelf life. Critical water activity thresholds mark where products degrade sensorially, structurally, or chemically. For crisp foods, crossing 0.35 water activity softens the starch matrix and ruins texture.
For powders, exceeding 0.50 triggers caking, clumping, and lipid oxidation. Package design calculations determine maximum allowable vapor gain, using that threshold to establish substrate permeance limits.

Shelf-Life Modeling via Critical Water Activity Thresholds
Food stability relies on keeping internal water activity below critical degradation levels during storage. Predictive shelf-life models combine ambient climate conditions, package surface area, substrate permeance, dry product mass, and the slope of the product’s sorption isotherm. Where isotherms behave linearly across the critical moisture range, shelf life scales inversely with package permeance.
Modeling these variables helps avoid over-engineering expensive polymer barriers on products with short retail shelf lives.
Determining maximum acceptable permeance uses a shelf-life equation derived from Fickian mass balance. Let M_i be initial product moisture content, M_c critical product moisture content, W dry product mass in kilograms, A package surface area in square meters, p_o vapor saturation pressure at storage temperature, and b the slope of the product sorption isotherm. The maximum allowable substrate permeance P_max is calculated as:
P_max = (W / (A p_o b time)) ln((M_c – M_eq) / (M_i – M_eq))
Where M_eq is the equilibrium moisture content the product would reach if left in ambient storage humidity indefinitely. This relationship shows that doubling package surface area cuts shelf life in half, which is why larger bulk packs often require higher-grade barrier board than small single-serve cartons holding the exact same product.
Yield Economics and Freight Mass Drift Calculations
Absorbed moisture adds non-salable weight to board reels during ocean transit through humid shipping lanes. Paperboard is bought by weight but used by surface area. When rolls pick up moisture in transit, total tonnage climbs without yielding a single additional carton.
Purchasing unconditioned, high-moisture paperboard effectively transfers money to the mill, since buyers pay tonnage prices for water weight.
Reel weight drift changes converting economics. A 1000-tonne shipment of unbleached kraft board shipped at 6 percent nominal moisture that absorbs water up to 9 percent during ocean transit gains 30 tonnes of moisture. Without contract clauses adjusting price to ISO 187 standard conditions, the buyer pays full price for excess water.
High moisture then forces converting plants to run slower, expend more energy on drying, and handle higher scrap rates from panel bowing.
Web tension settings require precise tuning during converting operations.
Converting plants recalibrate web tension systems when running high-moisture rolls to prevent web breaks.