Statistical Process Control for Oxygen Barrier Performance in Adhesive Lamination
Effective statistical process control for lamination barrier performance requires tracking adhesive coat weight proxy metrics alongside delayed coulometric OTR testing.
Film
Barrier flexible packaging relies on multi-layer web architectures where individual polymer plies perform distinct mechanical and gas transport functions. Base substrates carry baseline permeability. Oxygen transmission through a multi-layer flexible laminate operates according to resistance-in-series principles, where total gas permeance equals the sum of individual layer permeances.
In typical converter operations, primary substrates include oriented poly(ethylene terephthalate) (OPET), oriented polypropylene (OPP), cast polypropylene (CPP), polyethylene (PE), and aluminum foil. The intrinsic oxygen barrier of non-metallized polyolefins remains low, with low-density polyethylene exhibiting oxygen transmission rates (OTR) exceeding 2,500 cm³/(m²·day·atm) at 23°C and 0% relative humidity for a 25 µm gauge.
Ethylene vinyl alcohol (EVOH) copolymer resins provide exceptionally high passive gas barrier when dry. Moisture plastifies ethylene vinyl alcohol. At elevated relative humidity, water molecules penetrate the EVOH matrix, disrupting inter-chain hydrogen bonding and increasing free volume.
An EVOH grade containing 32 mol% ethylene yields an OTR of 0.2 cm³/(m²·day·atm) at 0% relative humidity, but this value rises to 4.5 cm³/(m²·day·atm) when environmental moisture reaches 80% relative humidity. Designing barrier packaging requires embedding moisture-sensitive barrier layers between hydrophobic polyolefin outer skins using suitable adhesive lamination techniques.

Substrate Baseline Permeability
Polymeric webs display inherent resistance to gas molecule migration depending on molecular structure and crystallinity. Biaxially oriented PET at 12 µm gauge presents an average baseline OTR of 110 cm³/(m²·day·atm) under standard test conditions. High-barrier variants incorporating coextruded EVOH or polyvinylidene chloride (PVdC) coatings reduce this value below 5.0 cm³/(m²·day·atm).
Pinholes destroy barrier capacity instantly. When specifying raw materials for conversion, incoming quality control protocols verify film thickness uniformity and surface energy prior to adhesive application.
| Substrate Material | Nominal Thickness (µm) | Baseline OTR at 0% RH (cm³/(m²·day·atm)) | Baseline OTR at 85% RH (cm³/(m²·day·atm)) | Primary Failure Mode |
|---|---|---|---|---|
| Oriented PET (OPET) | 12 | 110.0 | 108.0 | Surface micro-cracking |
| Metallized PET (Met-PET) | 12 | 1.2 | 1.2 | Pinhole formation and micro-flaking |
| AlOx-coated OPET | 12 | 0.8 | 0.9 | Flex-crack barrier degradation |
| EVOH Coextruded PE (32 mol%) | 50 | 0.3 | 5.2 | Hydrophilic matrix plasticization |
| Aluminum Foil | 7 | 0.01 | 0.01 | Mechanical pinholing during handling |
| Cast Polypropylene (CPP) | 40 | 1800.0 | 1800.0 | High intrinsic free volume transport |

Metallized and Oxide Coating Vulnerabilities
Deposition of aluminum or silicon dioxide layers onto polymer surfaces reduces gas permeation by several orders of magnitude. Metallized PET relies on a thin vacuum-deposited aluminum layer, typically 30 to 50 nanometers thick, to block optical paths and gas channels. Optical density measurements between 2.0 and 2.8 serve as an operational proxy for layer thickness.
Oxide coatings like aluminum oxide (AlOx) and silicon oxide (SiOx) deliver transparent barrier layers but exhibit extreme sensitivity to mechanical stress. Web tension during lamination must remain within tight windows to prevent microscopic fracturing of the brittle ceramic coating.
Coulometric testing under ASTM D3985 at 23°C and 0% relative humidity yields an oxygen transmission rate below 0.1 cm³/(m²·day·atm) for 12 µm aluminum foil laminates.
Converter customer service personnel frequently attribute oxygen transmission spikes to incoming film lot variability rather than uneven dry coat weight distribution across the nip.

Chemistry
Polyurethane adhesives applied in solventless or solvent-borne laminations bind adjacent webs while contributing a secondary resistance to gas diffusion. Two-component polyurethanes consist of an isocyanate-functional prepolymer component mixed with a polyol hydroxyl component. The chemical structure of the cured polyurethane network influences gas molecule solubility and diffusivity across the interface.
Higher crosslink density restricts polymer chain mobility, decreasing oxygen gas diffusion through the adhesive bulk layer.
Dry coat weight selection balances bond strength requirements against barrier contribution and process economics. Standard flexible packaging applications apply dry adhesive coat weights ranging from 1.5 to 4.5 g/m². Coat weight varies across webs.
Coat weight variations directly alter the physical distance gas molecules travel through the crosslinked polymer layer. An insufficient coat weight application creates localized low-density zones or micro-voids, enabling accelerated gas transport across the finished packaging laminate.

Adhesive System Selection and Barrier Contribution
Two-component polyurethane formulations represent the primary bonding agent in flexible barrier conversion. Solventless adhesives operate at 100% solids content, eliminating the thermal drying stage required for solvent-borne or waterborne systems. Isocyanates react with ambient moisture.
Application temperatures for solventless systems range between 40°C and 70°C to maintain viscosity levels suitable for smooth transfer roll metering. Solvent-borne adhesives utilize ethyl acetate or methyl ethyl ketone carriers, which evaporate inside drying tunnels to leave a uniform polymer film prior to nip consolidation.
Mixing Ratios and Stoichiometric Control
Precise metering of isocyanate prepolymers and polyol resins determines final polymer network density. Deviations from the target stoichiometric ratio leave unreacted functional groups within the cured matrix. Excess polyol acts as a plasticizer, lowering the glass transition temperature of the adhesive and increasing oxygen diffusion rates.
Excess isocyanate reacts with atmospheric moisture, generating carbon dioxide micro-bubbles that disrupt continuous film formation.
- Isocyanate Deficiency results in incomplete polyurethane crosslinking, leaving unreacted monomer channels that double oxygen transmission rates across the adhesive interface.
- Excessive Solvent Retention weakens structural bond strength and creates micro-cavities within ethyl acetate residues, increasing localized gas transport coefficients.
- Viscosity Drift alters gravimetric coat weight application, causing lateral gauge variations across wide web flexible packaging structures.
- Amine Side-Reactions generate carbon dioxide bubbles inside high-solids adhesive layers, creating pinhole defects that breach passive barrier performance.
Deviations in adhesive coat weight below nominal target thresholds compromise shelf-life validation periods and lead to premature product degradation in oxygen-sensitive food packaging.

Kinetics
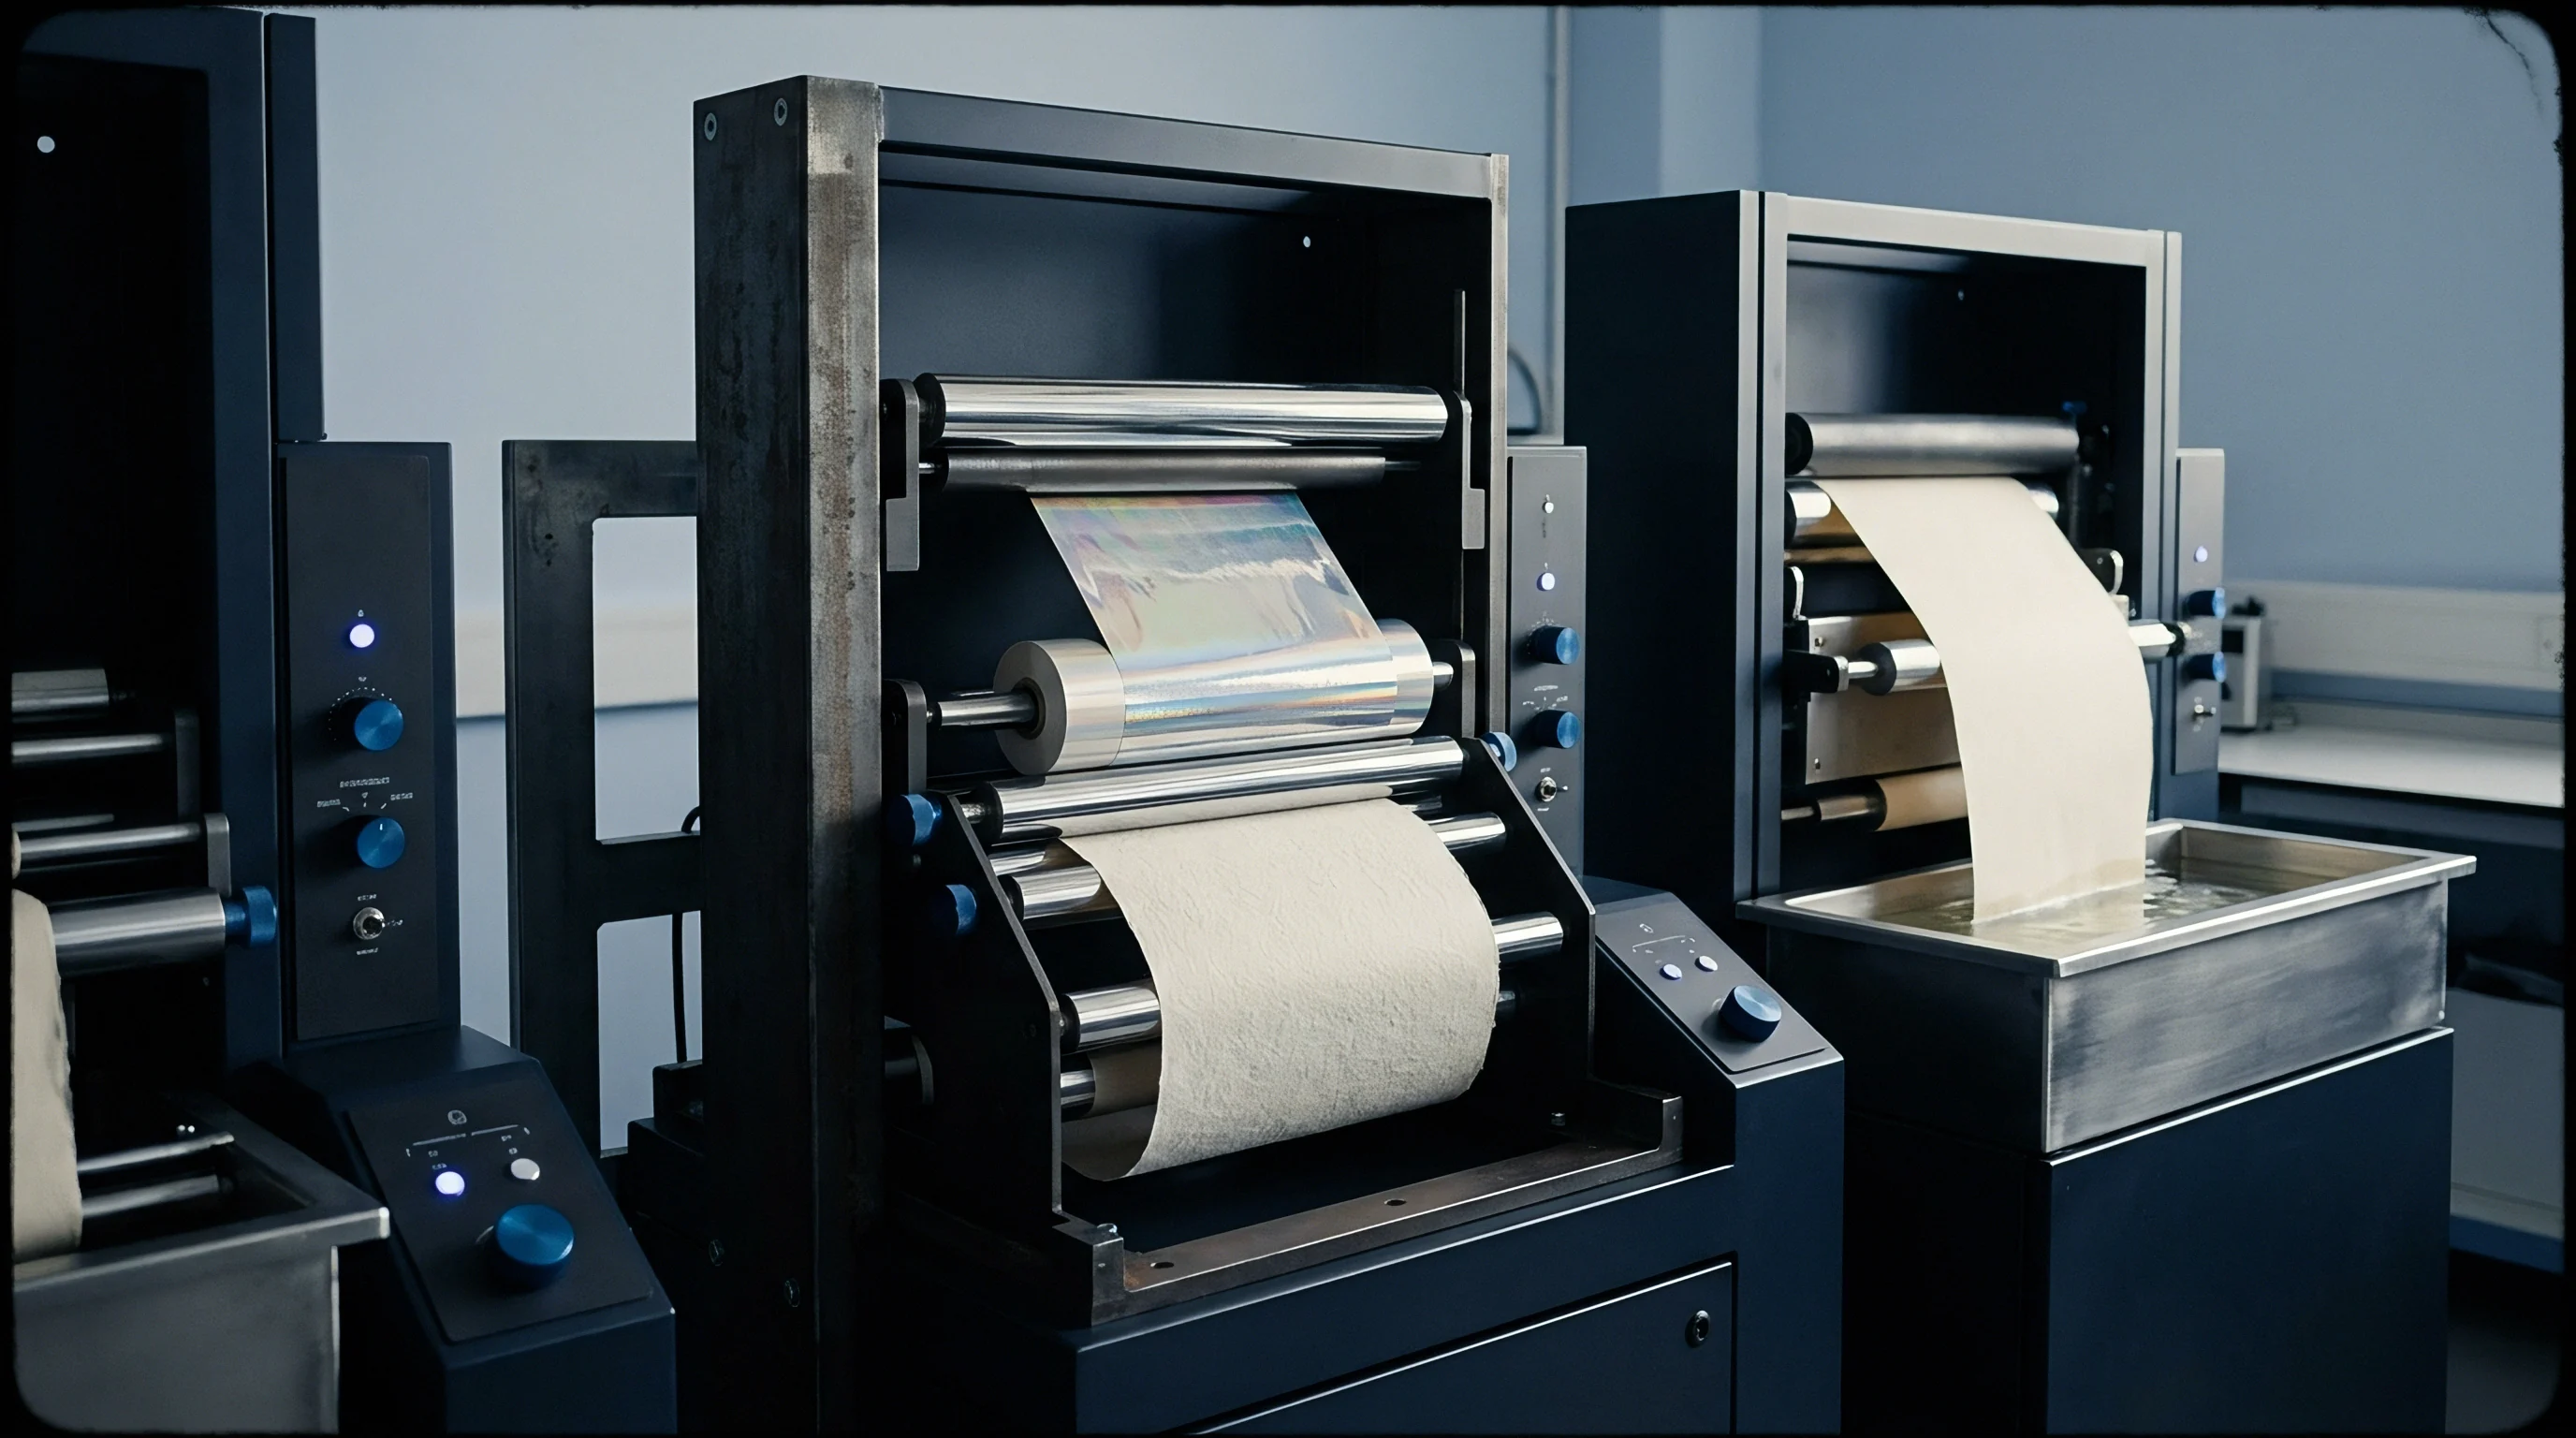
Crosslinking reactions inside two-component polyurethane adhesives alter gas permeability values for up to one hundred twenty hours following web consolidation. Freshly laminated film rolls exhibit elevated oxygen transmission rates immediately off the machine line because the liquid or semi-gelled adhesive resin has not attained its terminal crosslink density. As the polyurethane polymerization proceeds, molecular weight increases and free volume decreases, gradually establishing the final gas barrier properties of the flexible laminate structure.
Post-Lamination Cure Dynamics
Freshly laminated reels undergo progressive chemical transformation inside heated storage rooms maintained at forty degrees Celsius. The rate of reaction depends heavily on ambient thermal conditions and moisture availability for aromatic or aliphatic isocyanate curing. Tracking barrier evolution requires sampling off-line reels at defined time intervals to establish stabilization curves.
Testing permeability before crosslinking reaches ninety percent completion generates artificially high transmission values that do not represent final pack performance.
Worked Barrier Evolution Calculation
Calculating barrier progression requires defining initial oxygen transport values alongside adhesive reaction constants. Take a two-ply laminate construction consisting of 12 µm OPET laminated to 50 µm low-density polyethylene using a two-component solventless polyurethane adhesive applied at 2.0 g/m² dry weight. Assume the intrinsic barrier of the OPET web stays constant at 110 cm³/(m²·day·atm), while the un-cured adhesive layer initially contributes zero effective barrier resistance.
At hour zero, immediately after the nip roll, the baseline measured OTR of the un-cured web structure equals 105 cm³/(m²·day·atm).
Chemical crosslinking follows pseudo-first-order kinetics under controlled temperature storage at 35°C, expressed by the crosslinking fraction alpha over time t in hours:
alpha(t) = 1 – exp(-k t)
Assume the reaction rate constant k equals 0.045 h⁻¹ for the specific polyurethane formulation. The adhesive layer maximum barrier contribution at complete cure (alpha = 1.0) provides an effective adhesive layer resistance equivalent to reducing total laminate OTR down to 85 cm³/(m²·day·atm). The inverse barrier equation governs multi-layer permeability:
1 / OTR_total(t) = (1 / OTR_substrate) + (alpha(t) / OTR_adhesive_max)
Calculating values at specific time intervals demonstrates the non-linear stabilization of barrier performance across the initial post-lamination curing window:
At t = 12 hours: alpha(12) = 1 – exp(-0.045 12) = 0.417. The calculated inverse OTR yields 1 / OTR_total(12) = (1 / 110) + (0.417 / 467.5) = 0.00909 + 0.00089 = 0.00998, resulting in an OTR of 100.2 cm³/(m²·day·atm).
At t = 24 hours: alpha(24) = 1 – exp(-0.045 24) = 0.660. The calculated inverse OTR yields 1 / OTR_total(24) = (1 / 110) + (0.660 / 467.5) = 0.00909 + 0.00141 = 0.01050, resulting in an OTR of 95.2 cm³/(m²·day·atm).
At t = 48 hours: alpha(48) = 1 – exp(-0.045 48) = 0.885. The calculated inverse OTR yields 1 / OTR_total(48) = (1 / 110) + (0.885 / 467.5) = 0.00909 + 0.00189 = 0.01098, resulting in an OTR of 91.1 cm³/(m²·day·atm).
At t = 96 hours: alpha(96) = 1 – exp(-0.045 96) = 0.987. The calculated inverse OTR yields 1 / OTR_total(96) = (1 / 110) + (0.987 / 467.5) = 0.00909 + 0.00211 = 0.01120, resulting in an OTR of 89.3 cm³/(m²·day·atm).
At t = 120 hours: alpha(120) = 1 – exp(-0.045 120) = 0.995. The laminate reaches nominal terminal barrier performance, stabilizing at 89.1 cm³/(m²·day·atm).
Temperature accelerates curing reactions exponentially. Storage at 20°C slows reaction kinetics, dropping the rate constant k down to 0.018 h⁻¹ and extending the time required to reach ninety-five percent ultimate barrier performance from sixty hours out to one hundred sixty-five hours. Performing quality audit sampling before ninety-six hours under ambient warehouse storage leads to false out-of-specification classifications.
Compliance declarations under EU Regulation 10/2011 require migration and barrier testing on fully cured laminates after seven days of post-lamination thermal conditioning.
The exact mathematical relationship governing crosslinking speed and gas diffusion resistance in bio-based solventless adhesives remains undefined across varying ambient humidity ranges.


Metrology
Gas permeation measurement across laminated flexible structures follows standardized sensor technology operating under rigorous environmental isolation. Analytical instruments utilize carrier gas routes to sweep oxygen molecules escaping through test specimens into specialized detectors. Laboratory environments control ambient temperatures to within plus or minus 0.5°C, as gas diffusion coefficients double with modest thermal elevations.
Testing Standard Protocols ASTM D3985 and ASTM F1927
Coulometric oxygen sensors detect trace quantities of oxygen molecules passing through flexible packaging samples. ASTM D3985 specifies oxygen transmission rate measurements under dry conditions, where both carrier gas and test gas streams enter test cells at 0% relative humidity. ASTM F1927 expands this methodology to account for controlled relative humidity environments.
The sensor generates an electrical current directly proportional to the amount of oxygen flowing into the catalytic reaction chamber per unit time, expressed as Faraday’s law of electrolysis.

How Does Sample Conditioning Temperature Alter Permeability Results?
Thermal energy increases polymer chain mobility, accelerating oxygen transport rates across flexible packaging barriers. Testing carried out at 38°C yields OTR figures approximately two to three times higher than measurements conducted under standard ambient conditions of 23°C. Standardized testing mandates strict temperature stabilization. Quality control laboratories calibrate environmental chambers to prevent thermal gradient errors across large sample surface areas.
- Cut representative 100 cm² circular specimens from across the full width of the cured laminated web, avoiding creases or edge damages.
- Mount the specimen securely into the temperature-controlled diffusion cell using high-vacuum silicone grease along sealing flanges.
- Purge both top and bottom cell chambers with nitrogen-hydrogen carrier gas to strip residual oxygen until sensor baseline drift drops below 0.005 cm³/(m²·day).
- Introduce pure oxygen test gas into the upper chamber while carrier gas continues sweeping the lower chamber directly into the coulometric sensor.
- Monitor voltage output continuously until oxygen flux reaches steady-state equilibrium, recording the final plateau value as the lot transmission rate.
| Standard Designation | Detection Technology | Carrier Gas Mix | Standard Temperature (°C) | Relative Humidity Range (%) |
|---|---|---|---|---|
| ASTM D3985 | Coulometric Sensor | 98% N₂ / 2% H₂ | 23.0 | 0.0 (Strictly Dry) |
| ASTM F1927 | Coulometric Sensor | 98% N₂ / 2% H₂ | 23.0 or 38.0 | 35.0 to 90.0 |
| ISO 15105-2 | Coulometric Sensor | Pure N₂ or Mixed | 23.0 | 0.0 to 85.0 |
| DIN 53380-3 | Carrier Gas Method | Nitrogen Carrier | 23.0 | 0.0 or Specified |
Offline testing takes forty-eight hours. The physical duration of standard coulometric testing limits real-time process control capability. Converter operations utilize high-resolution online infrared absorption sensors to monitor wet and dry adhesive coat weights across web width in real time.
Linking real-time coat weight data to historical coulometric test results establishes statistical regression models that serve as immediate barrier performance proxies.
Offline oxygen transmission test results obtained before seventy-two hours of adhesive cure indicate trend direction rather than absolute compliance values.

Control
Statistical chart selection for barrier packaging lines accounts for long measurement feedback cycles and small subgroup sample sizes. Standard Shewhart individual and moving range (I-MR) charts track daily offline laboratory coulometric OTR results. Process capability calculations evaluate whether adhesive lamination processes remain capable of consistently achieving target barrier performance thresholds.
Subgrouping rules separate process variance into within-roll positional shifts and roll-to-roll temporal shifts.
Statistical Chart Selection for Latent Quality Attributes
Measurement delay inherent to barrier testing prevents immediate feedback to lamination line operators. Shewhart charts miss gradual drifts. Exponentially Weighted Moving Average (EWMA) and Cumulative Sum (CUSUM) charts detect small, systematic process shifts faster than traditional Shewhart charts.
When monitoring barrier metrics where test results arrive every twelve or twenty-four hours, EWMA weighting factors between 0.1 and 0.3 provide robust early warning indicators for process mean shifts on the order of 0.5 to 1.0 standard deviations.
Exponentially Weighted Moving Average Implementation
Weighting past observations allows quality engineers to detect subtle barrier degradation trends before product specifications break. The EWMA statistic z_t calculates recursively according to the weighting parameter lambda:
z_t = lambda x_t + (1 – lambda) z_(t-1)
Where x_t represents the measured oxygen transmission rate of the current cured laminate sample, and z_(t-1) is the previous EWMA statistic. Upper and lower control limits for the EWMA chart dynamically adjust based on sample sequence number t and historical process standard deviation sigma:
UCL = mu_0 + L sigma sqrt((lambda / (2 – lambda)) (1 – (1 – lambda)^(2 t)))
LCL = mu_0 – L sigma sqrt((lambda / (2 – lambda)) (1 – (1 – lambda)^(2 t)))
Assuming a target baseline OTR mean mu_0 of 1.20 cm³/(m²·day·atm), a process standard deviation sigma of 0.15, a weighting factor lambda of 0.20, and a control limit width factor L of 3.0, the steady-state control limits simplify to:
UCL = 1.20 + 3.0 0.15 sqrt(0.20 / 1.80) = 1.20 + 0.45 0.3333 = 1.35 cm³/(m²·day·atm)
LCL = 1.20 – 3.0 0.15 sqrt(0.20 / 1.80) = 1.20 – 0.45 0.3333 = 1.05 cm³/(m²·day·atm)
Process capability indices Cp and Cpk quantify barrier compliance relative to customer specification limits. If a customer specification defines an Upper Specification Limit (USL) of 1.60 cm³/(m²·day·atm) for a finished laminate, process capability evaluates as:
Cpk = (USL – mu) / (3 sigma) = (1.60 – 1.20) / (3 0.15) = 0.40 / 0.45 = 0.89
A Cpk value of 0.89 indicates an incapable lamination process producing out-of-specification barrier material at a rate exceeding 3,800 parts per million. NARROWING process variance down to a standard deviation sigma of 0.08 elevates Cpk up to 1.67, achieving full statistical control suitable for critical food contact packaging applications.
Small sample sizes evaluated with exponentially weighted moving average charts detect subtle process shifts faster than traditional Shewhart individual control charts.
- Subgroup Frequency Calibration aligns physical sampling intervals with adhesive batch changes, slit roll positions, and ambient humidity fluctuations on the converting floor.
- Proxy Metric Correlation links real-time online infrared coat weight measurements directly to offline coulometric oxygen transmission test values.
- Control Boundary Adjustment narrows upper specification limits to account for measurement uncertainty and post-converting storage temperature variances.
- Out-of-Control Action Routing stops converting operations immediately when three consecutive subgroup averages exceed the warning limit line.
Statistical limits prevent unnecessary adjustments. Setting control boundaries too narrow creates over-control instability, causing operators to alter machine speed or web tension unnecessarily.
Section 4.2 of the supplier quality agreement defines a lot rejection limit when the upper control limit of the EWMA chart exceeds 1.5 cm³/(m²·day·atm).

Warranty
Commercial contracts for high-barrier packaging materials specify statistical acceptance boundaries tied to verified laboratory testing. Quality assurance protocols mandate that converters maintain traceable audit records linking raw film roll numbers, adhesive batch codes, line operating parameters, and final oxygen transmission rate certificates of analysis. Buyers audit these compliance dossiers before releasing volume production orders for food or medical packaging applications.

Dossier Assembly and Certificate Verification
Technical compliance documentation contains complete traceability linking physical roll serial numbers to analytical test reports. Certificates of Analysis (CoA) provided by converters present measured OTR values alongside specific conditioning parameters including test temperature, relative humidity, and curing duration. Buyers cross-check CoA values against public scheme registers and certified laboratory standards to confirm accreditation scopes cover ASTM D3985 and ASTM F1927 test standards.
| Compliance Document Type | Primary Data Attributes | Verification Protocol | Commercial Exposure Risk |
|---|---|---|---|
| Certificate of Analysis (CoA) | OTR, coat weight, roll ID | Coulometric test report check | Rejected lot freight liabilities |
| Adhesive Safety Data Sheet | Isocyanate content, solvents | Chemical composition review | Regulatory non-compliance holds |
| Food Contact Declaration | EU 10/2011, FDA 175.105 | Migration limit testing check | Customs confiscation and fines |
| SPC Control Chart Record | Cpk, EWMA values, subgroup size | Statistical audit verification | Systemic quality failure claims |
Regulatory Risk Allocation across Cross-Border Chains
Purchase orders for international food packaging film carry explicit allocation of non-compliance financial liabilities. Customs inspectors hold unverified shipments. When imported flexible packaging fails barrier performance checks at destination ports, financial responsibility falls on the importer of record unless purchase terms explicitly assign quality warranty risks back to the exporting converter.
Contract terms specify secondary sampling procedures using accredited third-party laboratories to resolve trade disputes over marginal out-of-specification test figures.
Border inspection authorities hold the importer of record financially liable when printed packaging declarations lack valid chain of custody certification.
Defective barrier causes premature spoilage. Sourcing practices protect procurement capital by matching physical roll tags against mill test reports before releasing batch payments.