Statistical Process Control Methods for Paperboard Coating Uniformity
Decoupling machine-direction and cross-direction coat weight sensor arrays maintains barrier integrity and limits food contact migration exposure.


Gauge
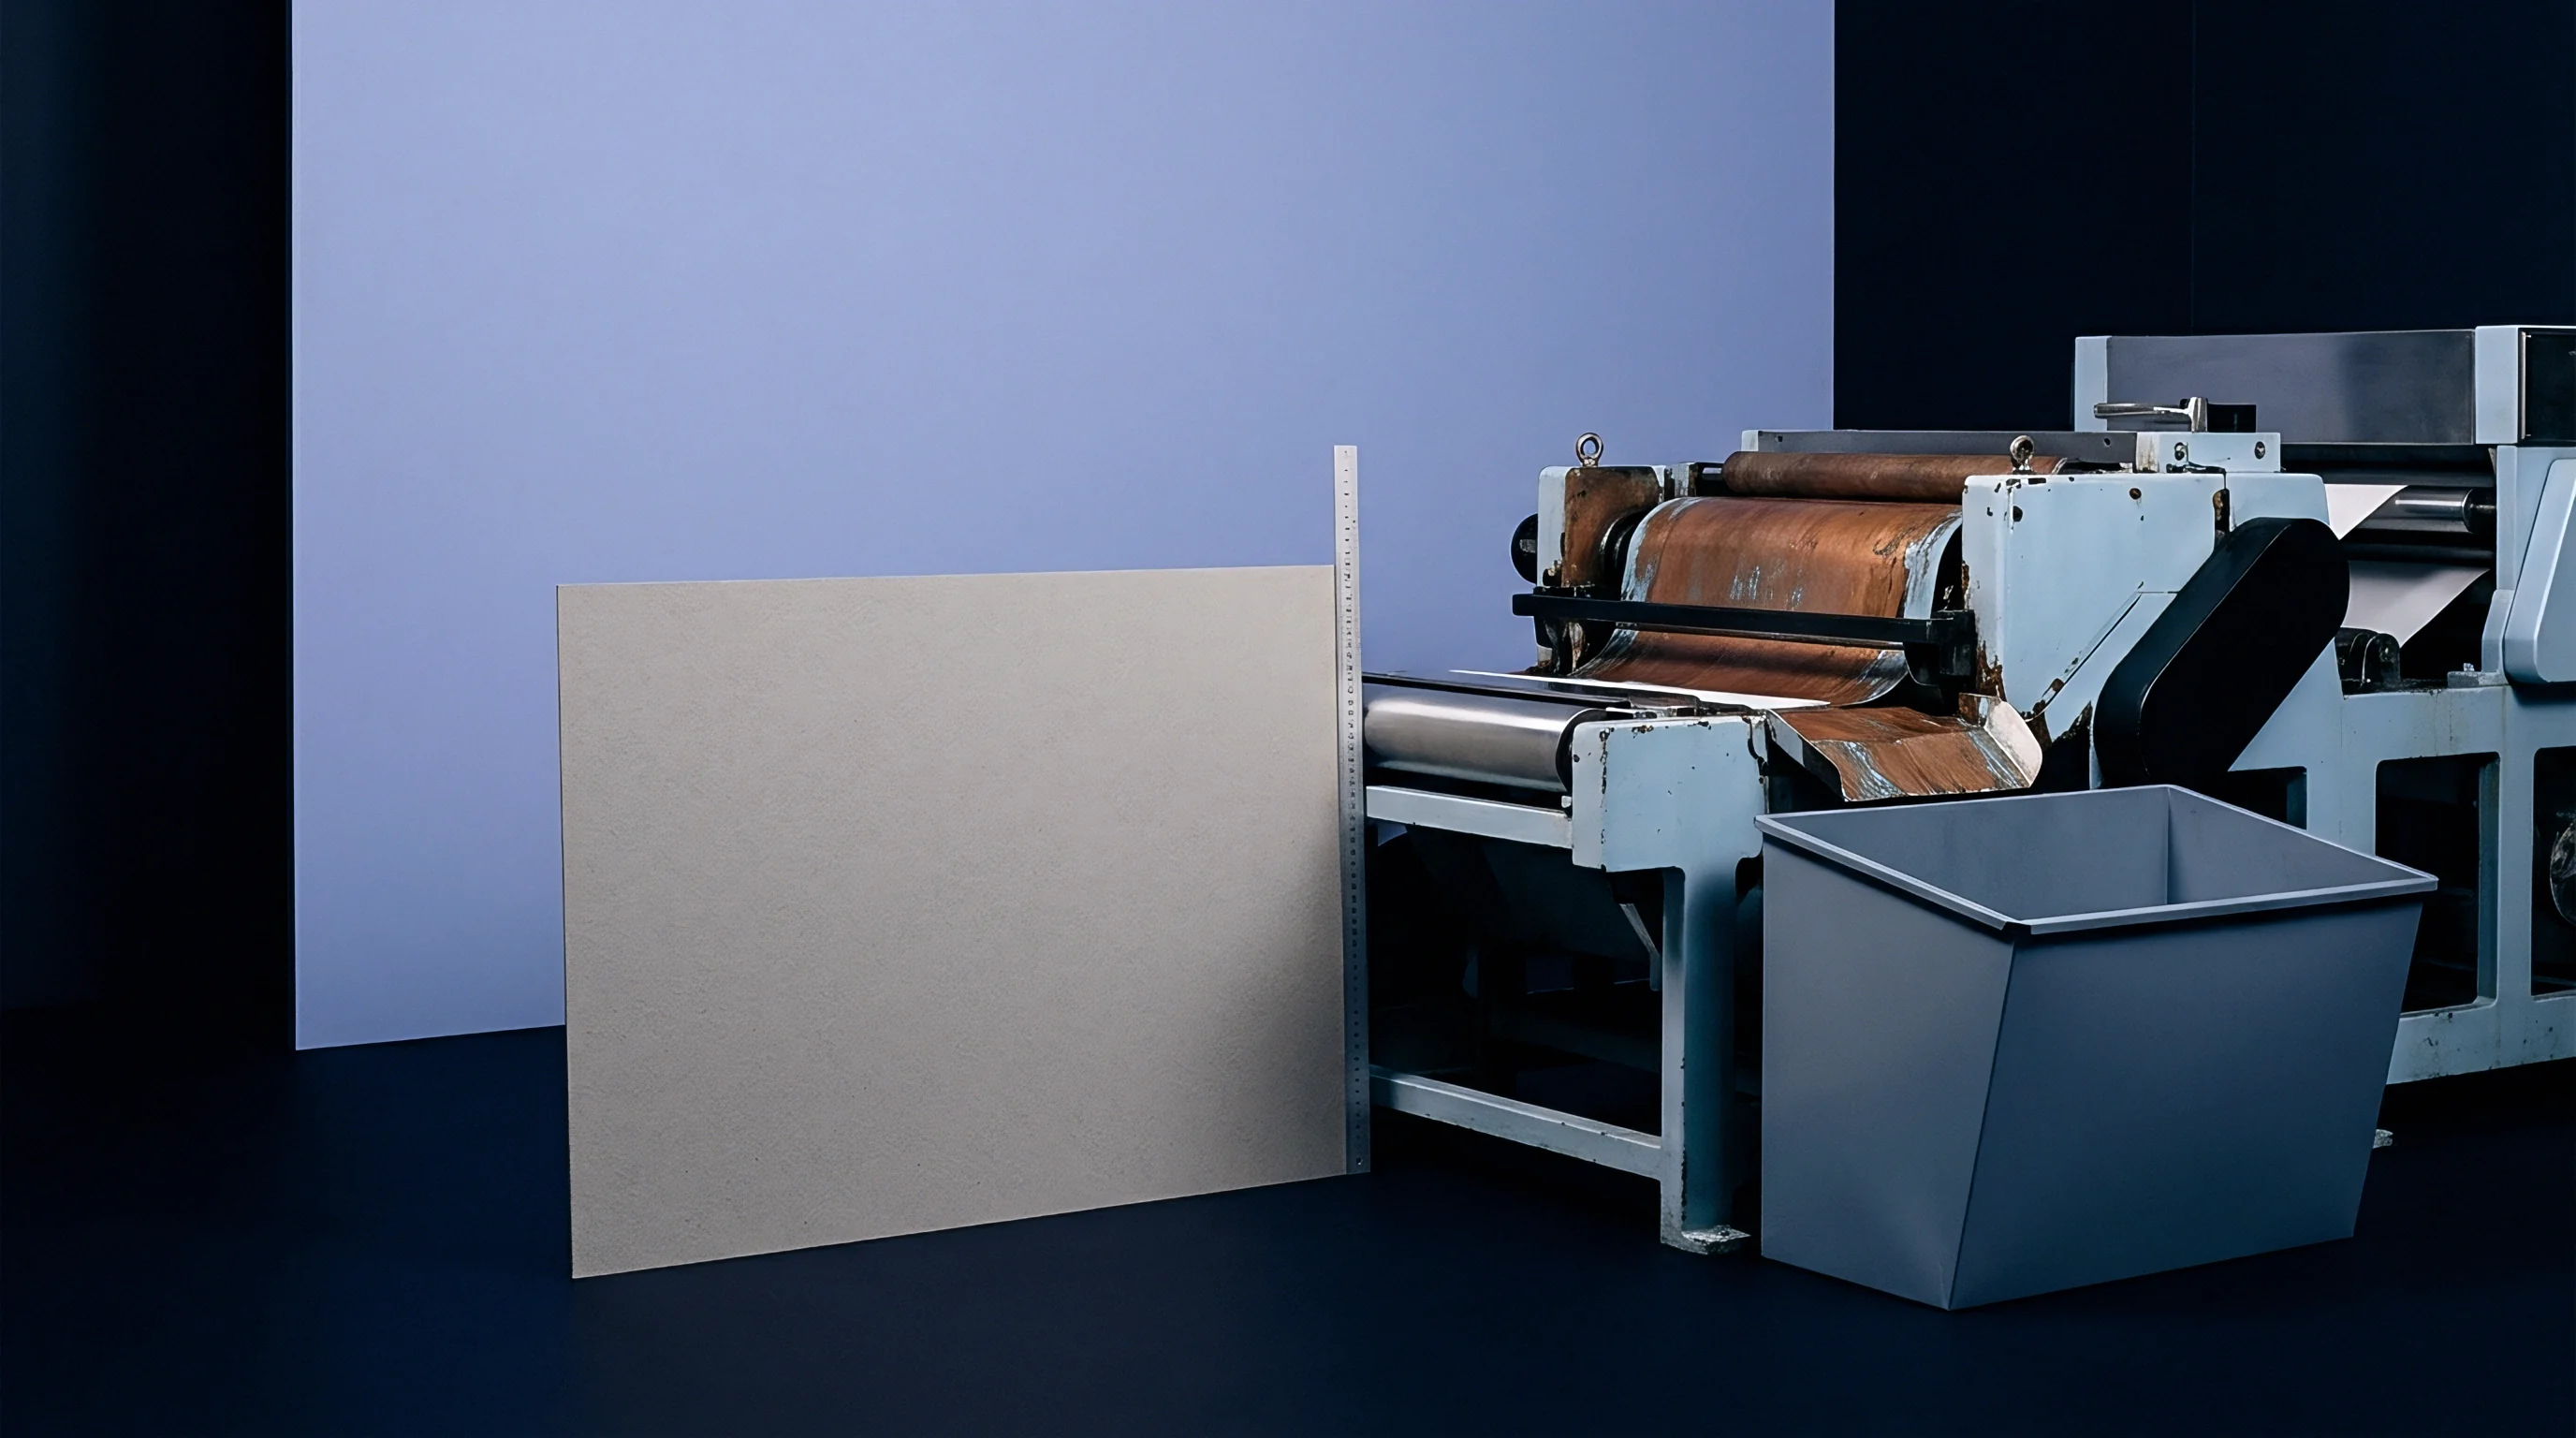
On-line coat weight measurement on high-speed paperboard machines relies on continuous radiometric, X-ray, or optical absorption sensors mounted on traversing frames. Measuring single-digit grammage variations on a moving web traveling at 600 meters per minute demands sensor precision within 0.1 grams per square meter. Primary measurement architectures deploy dual-frame configuration.
The first frame measures un-coated baseboard mass per unit area, while the second frame measures total coated board mass immediately after the drying section. Continuous subtraction yields differential coat weight across the cross direction. Sensor calibration relies on absorption physics, where beta radiation attenuation or X-ray fluorescence intensity directly correlates with surface pigment mass.
Baseboard basis weight variations directly contaminate differential calculations. A localized 2 gram per square meter surge in raw fibre mass registers as an artificial coat weight spike unless the downstream gauge precisely tracks the same web element using differential time-delay compensation. Machine-direction delay matching uses encoder-based reel synchronization to align baseboard profile frames with coated web profile frames.
Single-frame backscatter sensors reduce synchronization error by isolating surface pigment elements. X-ray fluorescence targets chemical markers such as titanium dioxide or calcium carbonate within the formulation, isolating mineral pigment mass from organic cellulose backing.
Continuous Scanning Arrays and On-Line Calibration Protocols
Traversing frames sweep across the web in a continuous zig-zag pattern, combining machine-direction and cross-direction mass movements into a single raw signal. Deconvoluting these two spatial vectors requires mathematical filtering algorithms. Line speed shifts coat weight.
High-speed scanning heads complete a full cross-machine pass in 10 to 30 seconds, during which hundreds of meters of paperboard pass the sensor head. Spatial resolution depends on beam footprint size and signal integration time. A 10-millimeter aperture yields high spatial resolution but demands higher sampling integration time to dampen statistical detector noise.
Infrared reflection sensors capture functional group absorption bands corresponding to synthetic latex binders and water. Near-infrared spectroscopy measures baseline absorption at specific wavelengths, calculating binder film thickness independent of mineral filler composition. Baseboard roughness increases binder absorption.
Sensor calibration protocols link non-destructive optical readings to absolute gravimetric bench metrics. Calibration verification involves periodic web off-cut sampling, where physical swatches undergo laboratory conditioning prior to solvent extraction or high-temperature ashing.
| Measurement Technology | Dynamic Accuracy | Sampling Frequency | Baseboard Sensitivity | Primary Measurement Target |
|---|---|---|---|---|
| Beta Attenuation Differential | ±0.15 g/m² | 100 Hz | High sensitivity to raw fibre grammage drift | Total applied wet/dry mass layer |
| X-Ray Fluorescence (XRF) | ±0.08 g/m² | 10 Hz | Zero sensitivity to cellulose backing mass | Specific mineral elements (Ca, Ti) |
| Near-Infrared Reflection (NIR) | ±0.12 g/m² | 500 Hz | Moderate sensitivity to surface scatter | CH/OH binder functional groups |
| Microwave Resonance | ±0.20 g/m² | 1000 Hz | Sensitivity to core moisture gradient | Water film and aqueous mass distribution |

Off-Line Gravimetric Verification and Standard Methods
Laboratory validation of web scanner accuracy relies on standardized destructive testing protocols. TAPPI T 410 establishes baseline procedures for dry mass per unit area determinations on precision-cut swatches. Validating mineral coat weight isolated from baseboard cellulose involves high-temperature ignition per ISO 3451 protocols.
Muffle furnace combustion at 525 degrees Celsius incinerates organic fibre while leaving inorganic calcium carbonate and kaolin clay residue intact. Weight loss calculations yield pigment coat weight, provided organic binders and carbonate thermal decomposition factors are accounted for in the stoichiometric balance.
Beta transmission sensors achieve a dynamic repeatable accuracy of 0.15 grams per square meter when calibrated against gravimetric web samples conditioned at 23 degrees Celsius and 50 percent relative humidity under TAPPI T 402.
Solvent extraction methods isolate synthetic polymer binders without altering underlying cellulose structures. Standardized testing protocols require conditioning all off-line samples at 23 degrees Celsius and 50 percent relative humidity for 24 hours prior to weighing. Sensor drift occurs when temperature gradients expand structural traversing frames or when airborne coating mist settles on sensor optics.
Relying on uncalibrated scanner profiles leads directly to false process adjustment, causing systematic over-application of costly titanium dioxide pigments and triggering surface crazing defects during carton creasing operations.

Slurry
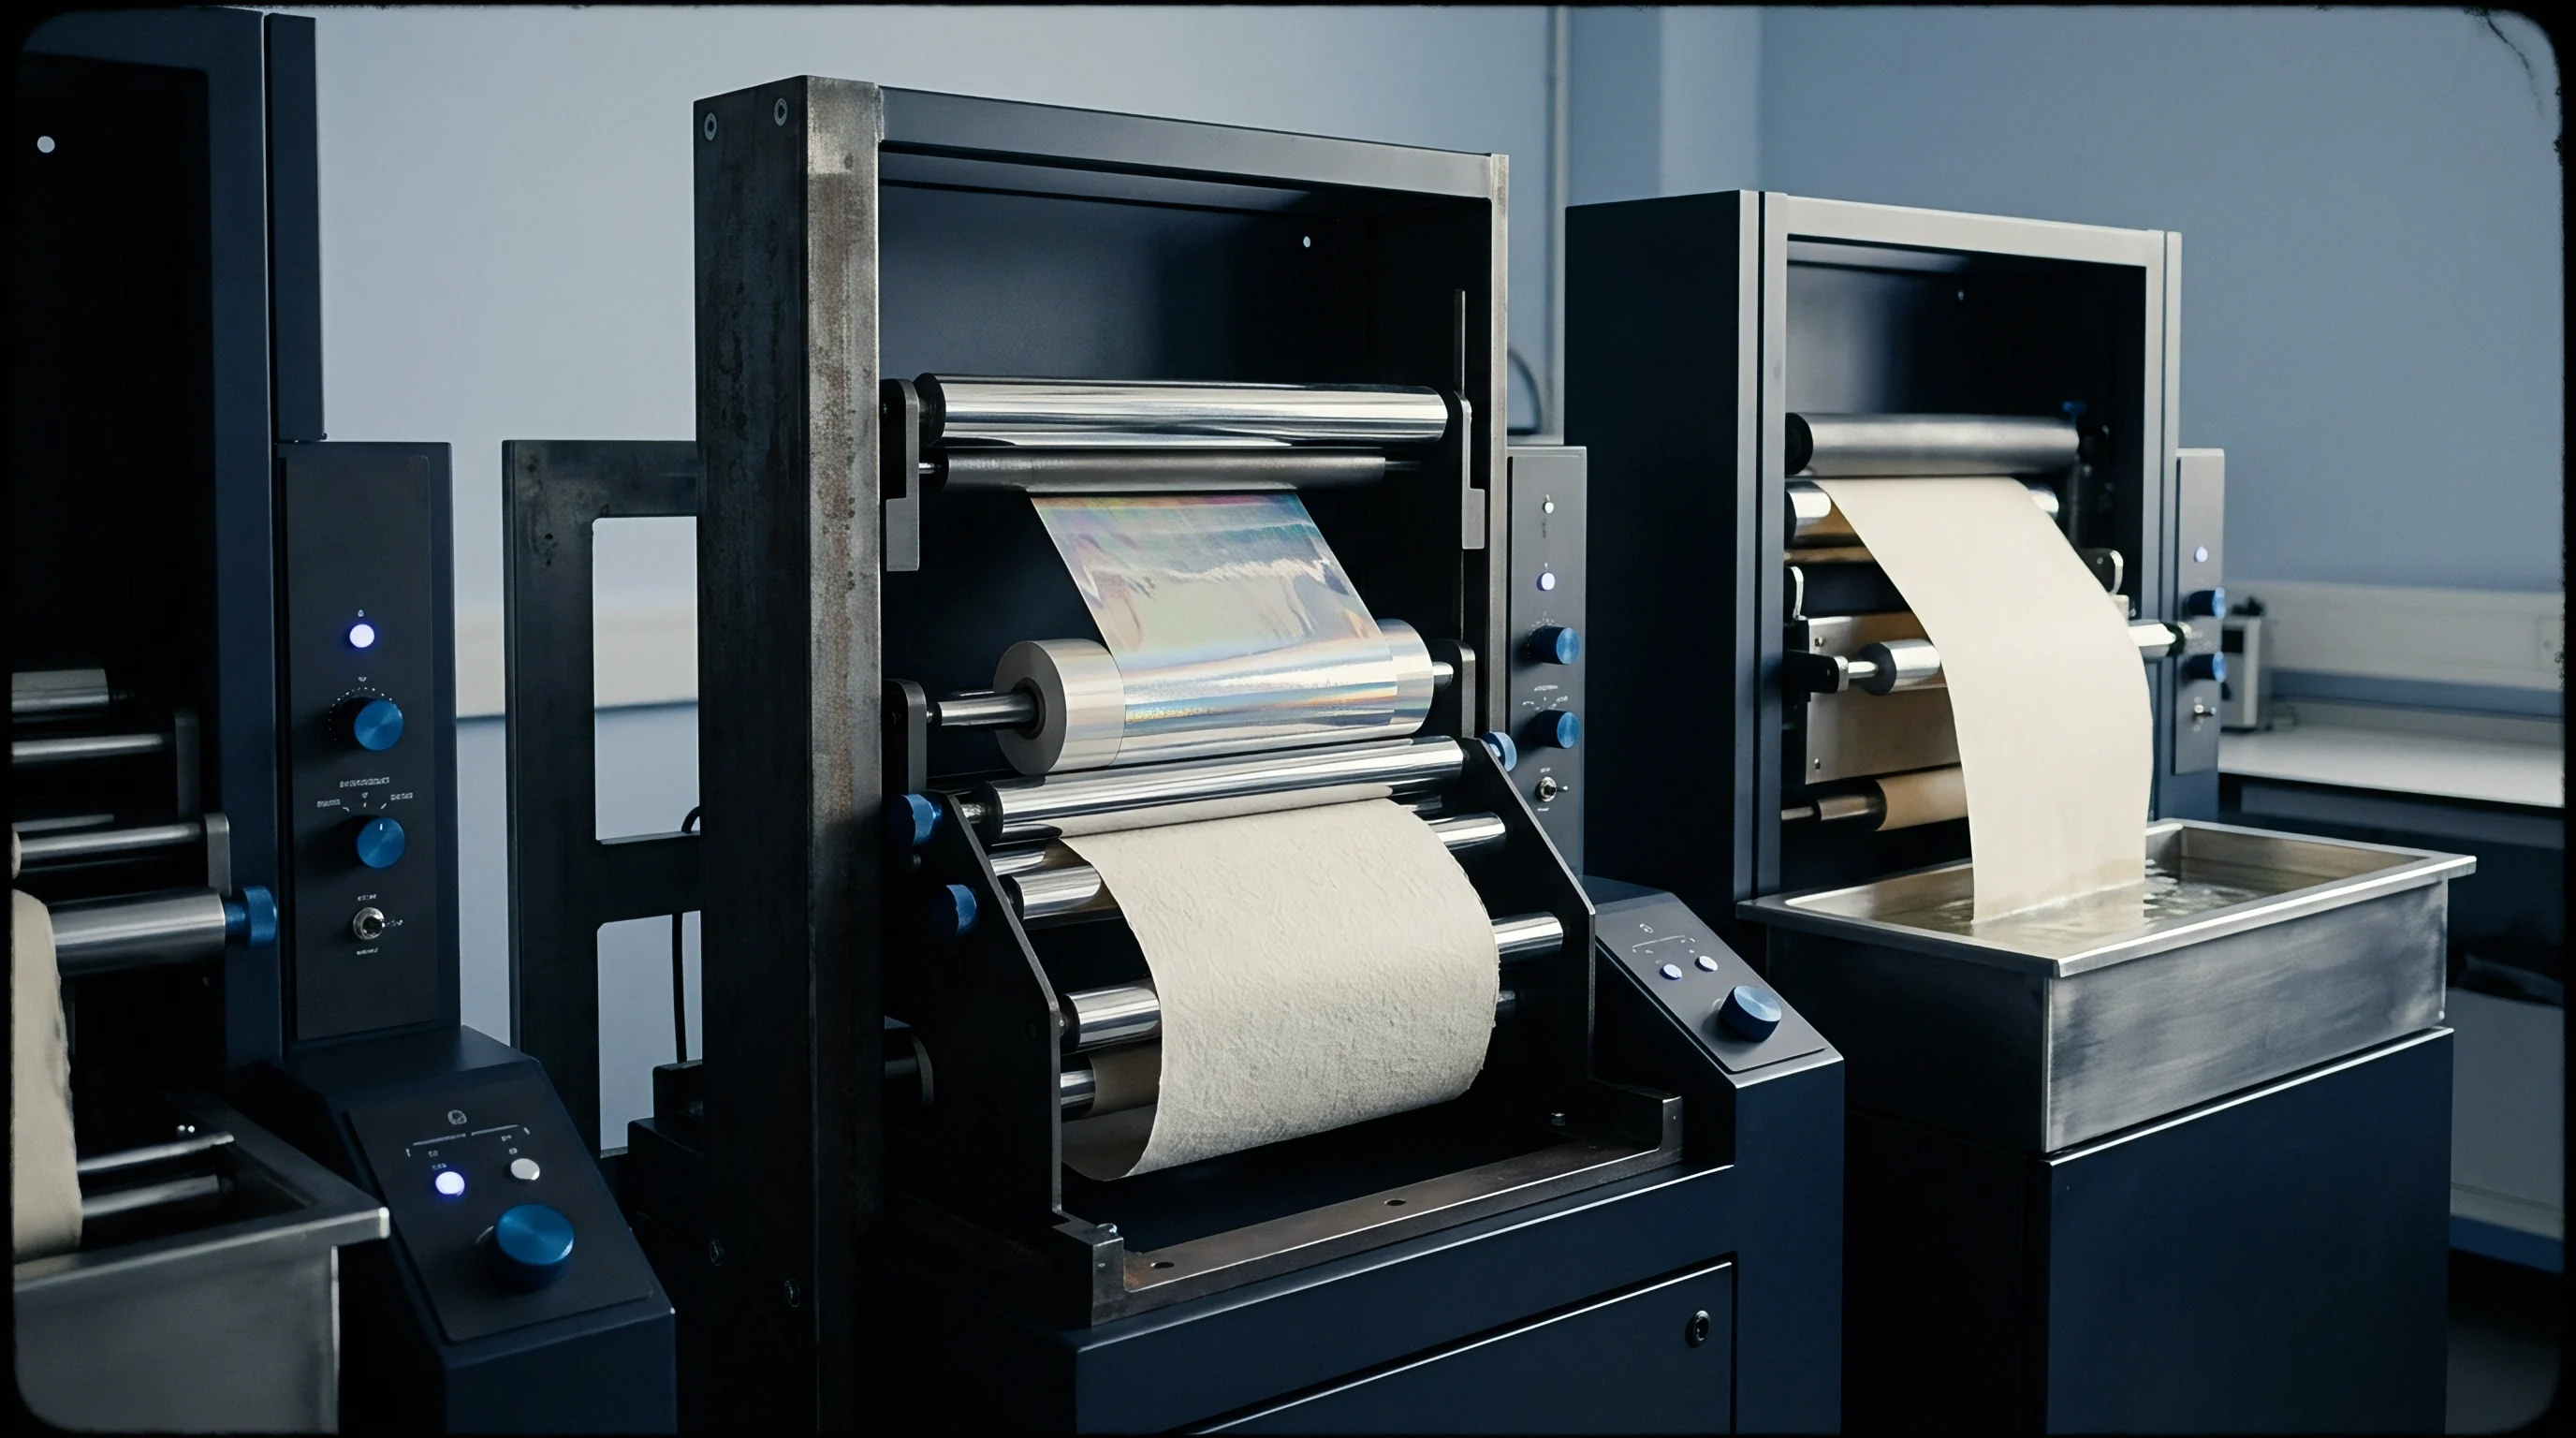
Coating formulation behavior under high shear governs coat weight uniformity across the metering zone. Rheology shifts alter dynamic hydraulic pressure at the blade tip or metering rod nip, distorting applied film thickness. Formulations contain grounded calcium carbonate, kaolin clay, synthetic latex binders, and water-soluble rheology modifiers suspended in water at 60 to 70 percent solids by weight.
High solids concentration minimizes drying energy demand but narrows the stable operational window. Rheology modifiers impart shear-thinning characteristics, permitting smooth flow under high metering shear while preventing liquid sagging prior to infrared drying.
Dynamic viscosity shifts under shear rates exceeding 100,000 reciprocal seconds dictate coat weight stability. High-shear rheometers measure yield stress and viscosity breakdown under conditions simulating blade metering nips. Viscosity drops excessively under high shear when latex binder structures break down, reducing hydraulic lift and causing blade bleed.
Thermal expansion changes blade nip gap. Viscosity fluctuations across a single shift trace directly to batch dispersion variance, temperature changes in supply loops, or micro-flocculation of pigment particles.

Metering Geometry and Dynamic Mechanical Drivers
Mechanical coater configurations apply slurry using bent blade, stiff blade, metering rod, or air knife mechanical elements. Bent blade metering operates under combined hydrodynamic and mechanical force, where blade thickness, angle, and tip bevel dictate film profile. Blade wear skews cross-direction profiles.
Steel blades experience abrasive wear from kaolin clay and calcium carbonate particles, leading to edge rounding and localized coat weight increases across the web. Ceramic-tipped blades reduce abrasion rates, maintaining tip geometry over extended production runs.
Air knife coater stability depends on continuous, uniform air jet pressure exiting a narrow slot across the entire machine width. Pressure drops inside the air plenum cause cross-direction coat weight surging. Metering rod coater systems utilize grooved or smooth rotating rods held against the backing roll by flexible pressure beam hoses.
Pneumatic pressure variations along the beam alter local rod loading, creating micro-zone coat weight variations. Recycled fibre increases surface variance.
ISO 12647-2 specifies an upper tolerance limit of two delta E units for surface shade variations caused by local mineral coating fluctuations before lithographic print registration fails customer acceptance tests.
Filter clogging alters slurry delivery rate. Runnability issues arise when mechanical vibrations translate through the metering assembly. Metering bar chatter produces short-wavelength machine-direction coat weight waves visible under low-angle illumination.
Eliminating chatter demands precise balancing of backing rolls, fluid pressure optimization, and continuous monitoring of slurry viscoelasticity.

Rheological and Mechanical Failure Modes
Coat weight drift stems from interconnected chemical and physical process disturbances. Identifying root causes requires separating fluid dynamics from structural coater wear.
- Pigment Micro-Flocculation creates localized high-viscosity agglomerates that block blade gaps, producing longitudinal streaks and micro-coat weight drops across affected web zones.
- Blade Edge Micro-Chipping allows unmetered slurry pass-through, resulting in high coat weight bands and surface ridges along the machine direction.
- Temperature-Induced Viscosity Drop reduces hydraulic lift force at the metering nip, leading to lower net coat weight during extended high-speed production runs.
- Air Plenum Pressure Drop in air knife coaters lowers jet impact force, leaving excessive liquid mass on the board surface and producing wet-streak defects.
- Metering Hose Pressure Leakage reduces localized beam loading in rod coaters, creating broad cross-direction coat weight swells across multiple actuator zones.
Mill technical teams frequently attribute chronic coat weight streak defects to raw material batch variation, citing pigment particle size distribution shifts, when physical blade holder contamination or micro-vibrations in the backing roll bearings are the actual physical causes of surface non-uniformity.


Control
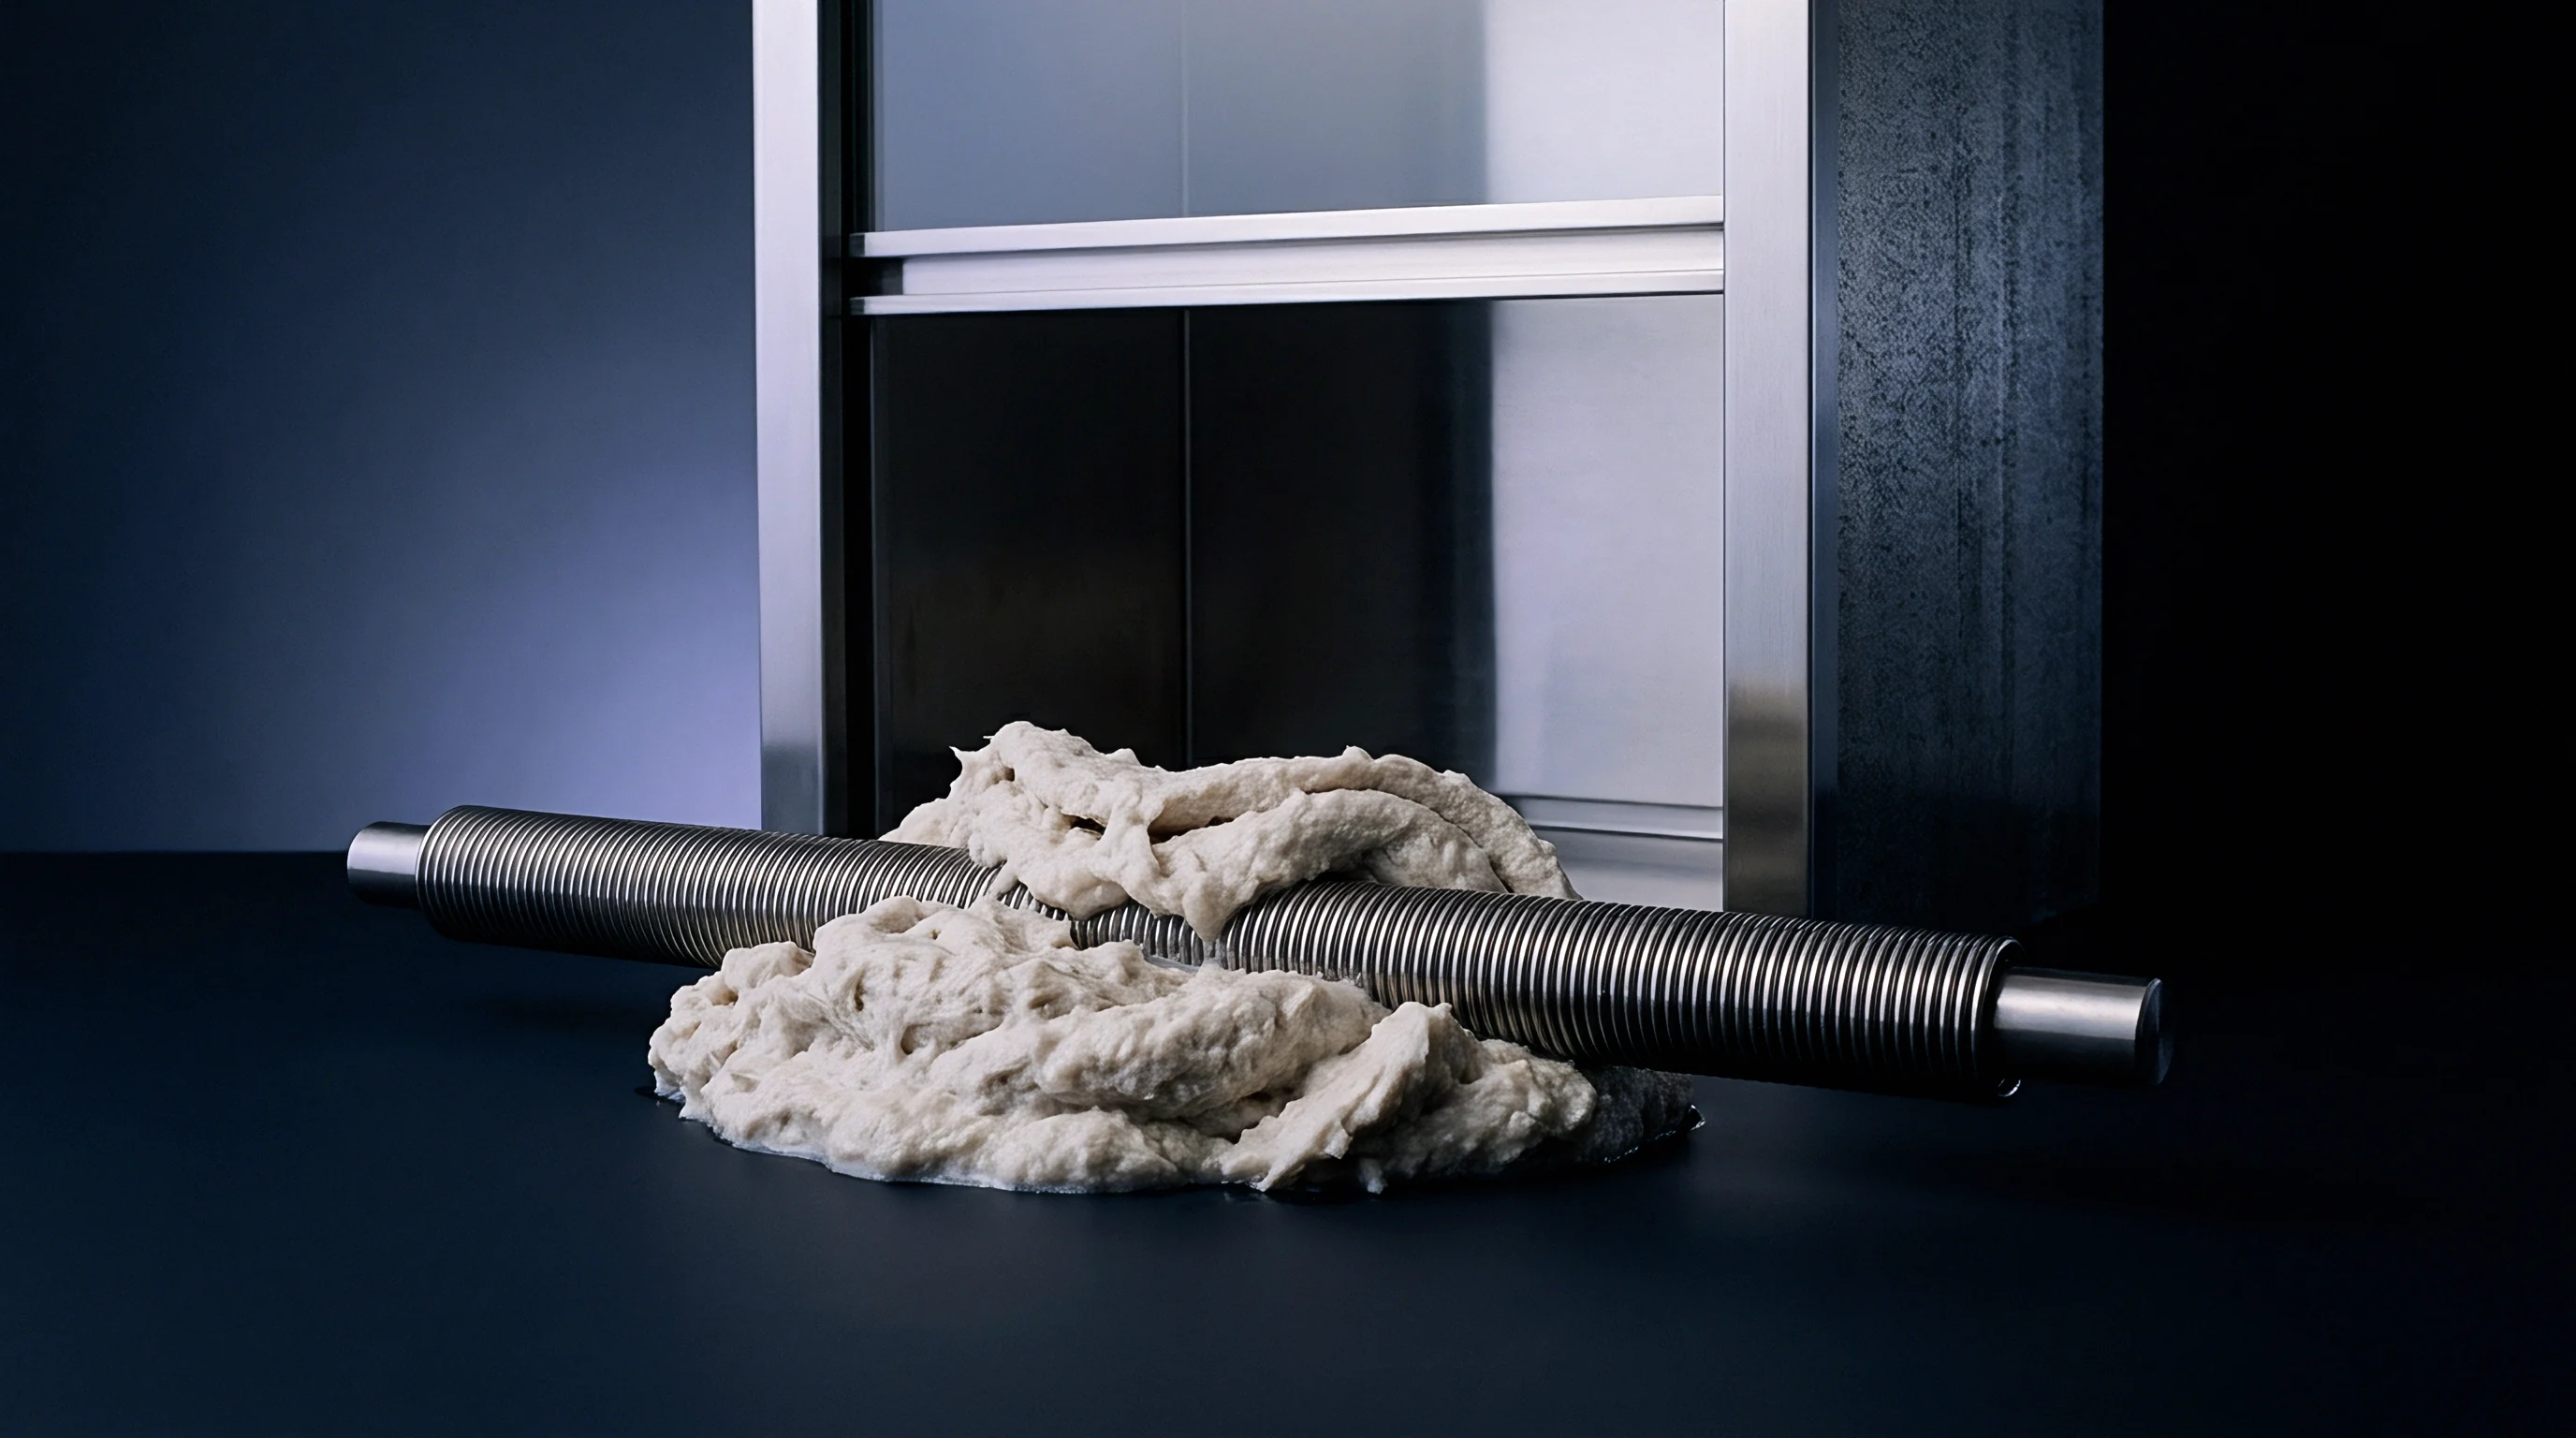
Statistical process control for paperboard coating demands continuous separation of machine-direction variations from cross-direction profile variations. Standard univariate Shewhart charts fail on continuous web processes because spatial correlation between adjacent measurement zones violates assumptions of independent sample distribution. Machine-direction control tracks average coat weight across the entire width over time, isolating reel-to-reel trends driven by slurry viscosity or machine speed changes.
Cross-direction control monitors spatial distribution across individual actuator zones, detecting mechanical blade beam bending or localized thermal deformation.
Decomposing cross-machine profiles uses principal component analysis and eigenvector decomposition. The primary eigenvector represents average web mass, while higher-order vectors isolate edge-pinch, center-swell, and sinusoidal bending modes. Subgroup size alters chart sensitivity.
Evaluating machine-direction variance requires averaging all cross-direction zone measurements within a single scan sweep, creating a composite mean point for X-bar and R control charts.
Statistical Charting Techniques for Dynamic Web Processing
Exponentially Weighted Moving Average (EWMA) charts detect small, persistent coat weight drifts earlier than standard Shewhart charts. The EWMA weighting parameter lambda, typically set between 0.05 and 0.20, determines chart memory for historical profile points. Cumulative Sum (CUSUM) charts track cumulative deviations from target coat weight, isolating subtle slurry solids content shifts.
Both methods prevent over-reaction to temporary web splices or speed changes.
Two-dimensional spatial control charts track individual actuator zones across time. Every zone along the blade beam represents an independent sub-process with specific control limits. When adjacent zones exhibit anti-correlated variance patterns, the control algorithm identifies mechanical blade beam twisting rather than slurry flow changes.
| Chart Architecture | Primary Target Parameter | Optimal Subgroup Size (N) | Average Run Length (ARL0) | Detectable Shift Magnitude |
|---|---|---|---|---|
| Shewhart X-Bar / R | Gross machine-direction weight shifts | 5 to 10 scans | 370 scans | > 1.5 Standard Deviations |
| EWMA (lambda = 0.1) | Slurry solids drift and binder depletion | Single scan width average | 400 scans | 0.5 to 1.0 Standard Deviations |
| CUSUM | Systematic raw material batch changes | Single scan width average | 500 scans | 0.2 to 0.75 Standard Deviations |
| Multi-Zone 2D Spatial | Cross-direction blade wear and profile distortion | Zone array per sweep | 350 scans per zone | Localized spatial spikes > 2.0 Sigma |

Can Infrared Sensor Arrays Detect Sub-Gram Coat Weight Shifts?
High-resolution near-infrared sensor arrays deliver sub-gram coat weight detection by measuring water and binder absorption frequencies at multi-kilohertz sampling rates. Array systems eliminate mechanical traversing frames, providing continuous stationary coverage across every millimeter of web width. Rapid optical response allows real-time closed-loop control of fast-acting motorized blade actuators.
Moisture fluctuations distort raw infrared readings. Moisture compensation algorithms isolate water absorption bands from polymer binder bands, preventing humidity shifts from generating false coat weight control signals.
A control chart set to detect microscopic machine direction shifts will trigger false alarms if cross-direction profile variations are not mathematically decoupled prior to calculating subgroup means.
Implementing closed-loop statistical control requires structured calibration and validation procedures to establish reliable action thresholds on the coater deck.
- Stabilize baseboard web moisture and basis weight within pre-set limits prior to engaging automated coating feedback control loops.
- Execute a 30-minute traversing sensor baseline scan at fixed line speed to establish baseline measurement noise and detector variance.
- Perform physical off-line gravimetric sampling across 10 cross-direction web zones to calculate line-specific gauge scaling factors.
- Configure spatial de-convolution algorithms to separate machine-direction mass variations from individual actuator zone response signals.
- Establish Upper and Lower Control Limits on X-bar and EWMA charts using three-sigma boundaries derived from stable historical baseline runs.
- Link statistical out-of-control rule triggers to automated closed-loop blade profile motor positioners to correct spatial zone deviations.
Applying standard control limits to raw, un-filtered spatial profile data causes continuous actuator hunting, where motorized blade adjusters constantly move in response to random sensor noise, rapidly wearing mechanical drive screws and introducing high-frequency spatial waves into the coat weight distribution.

Spread
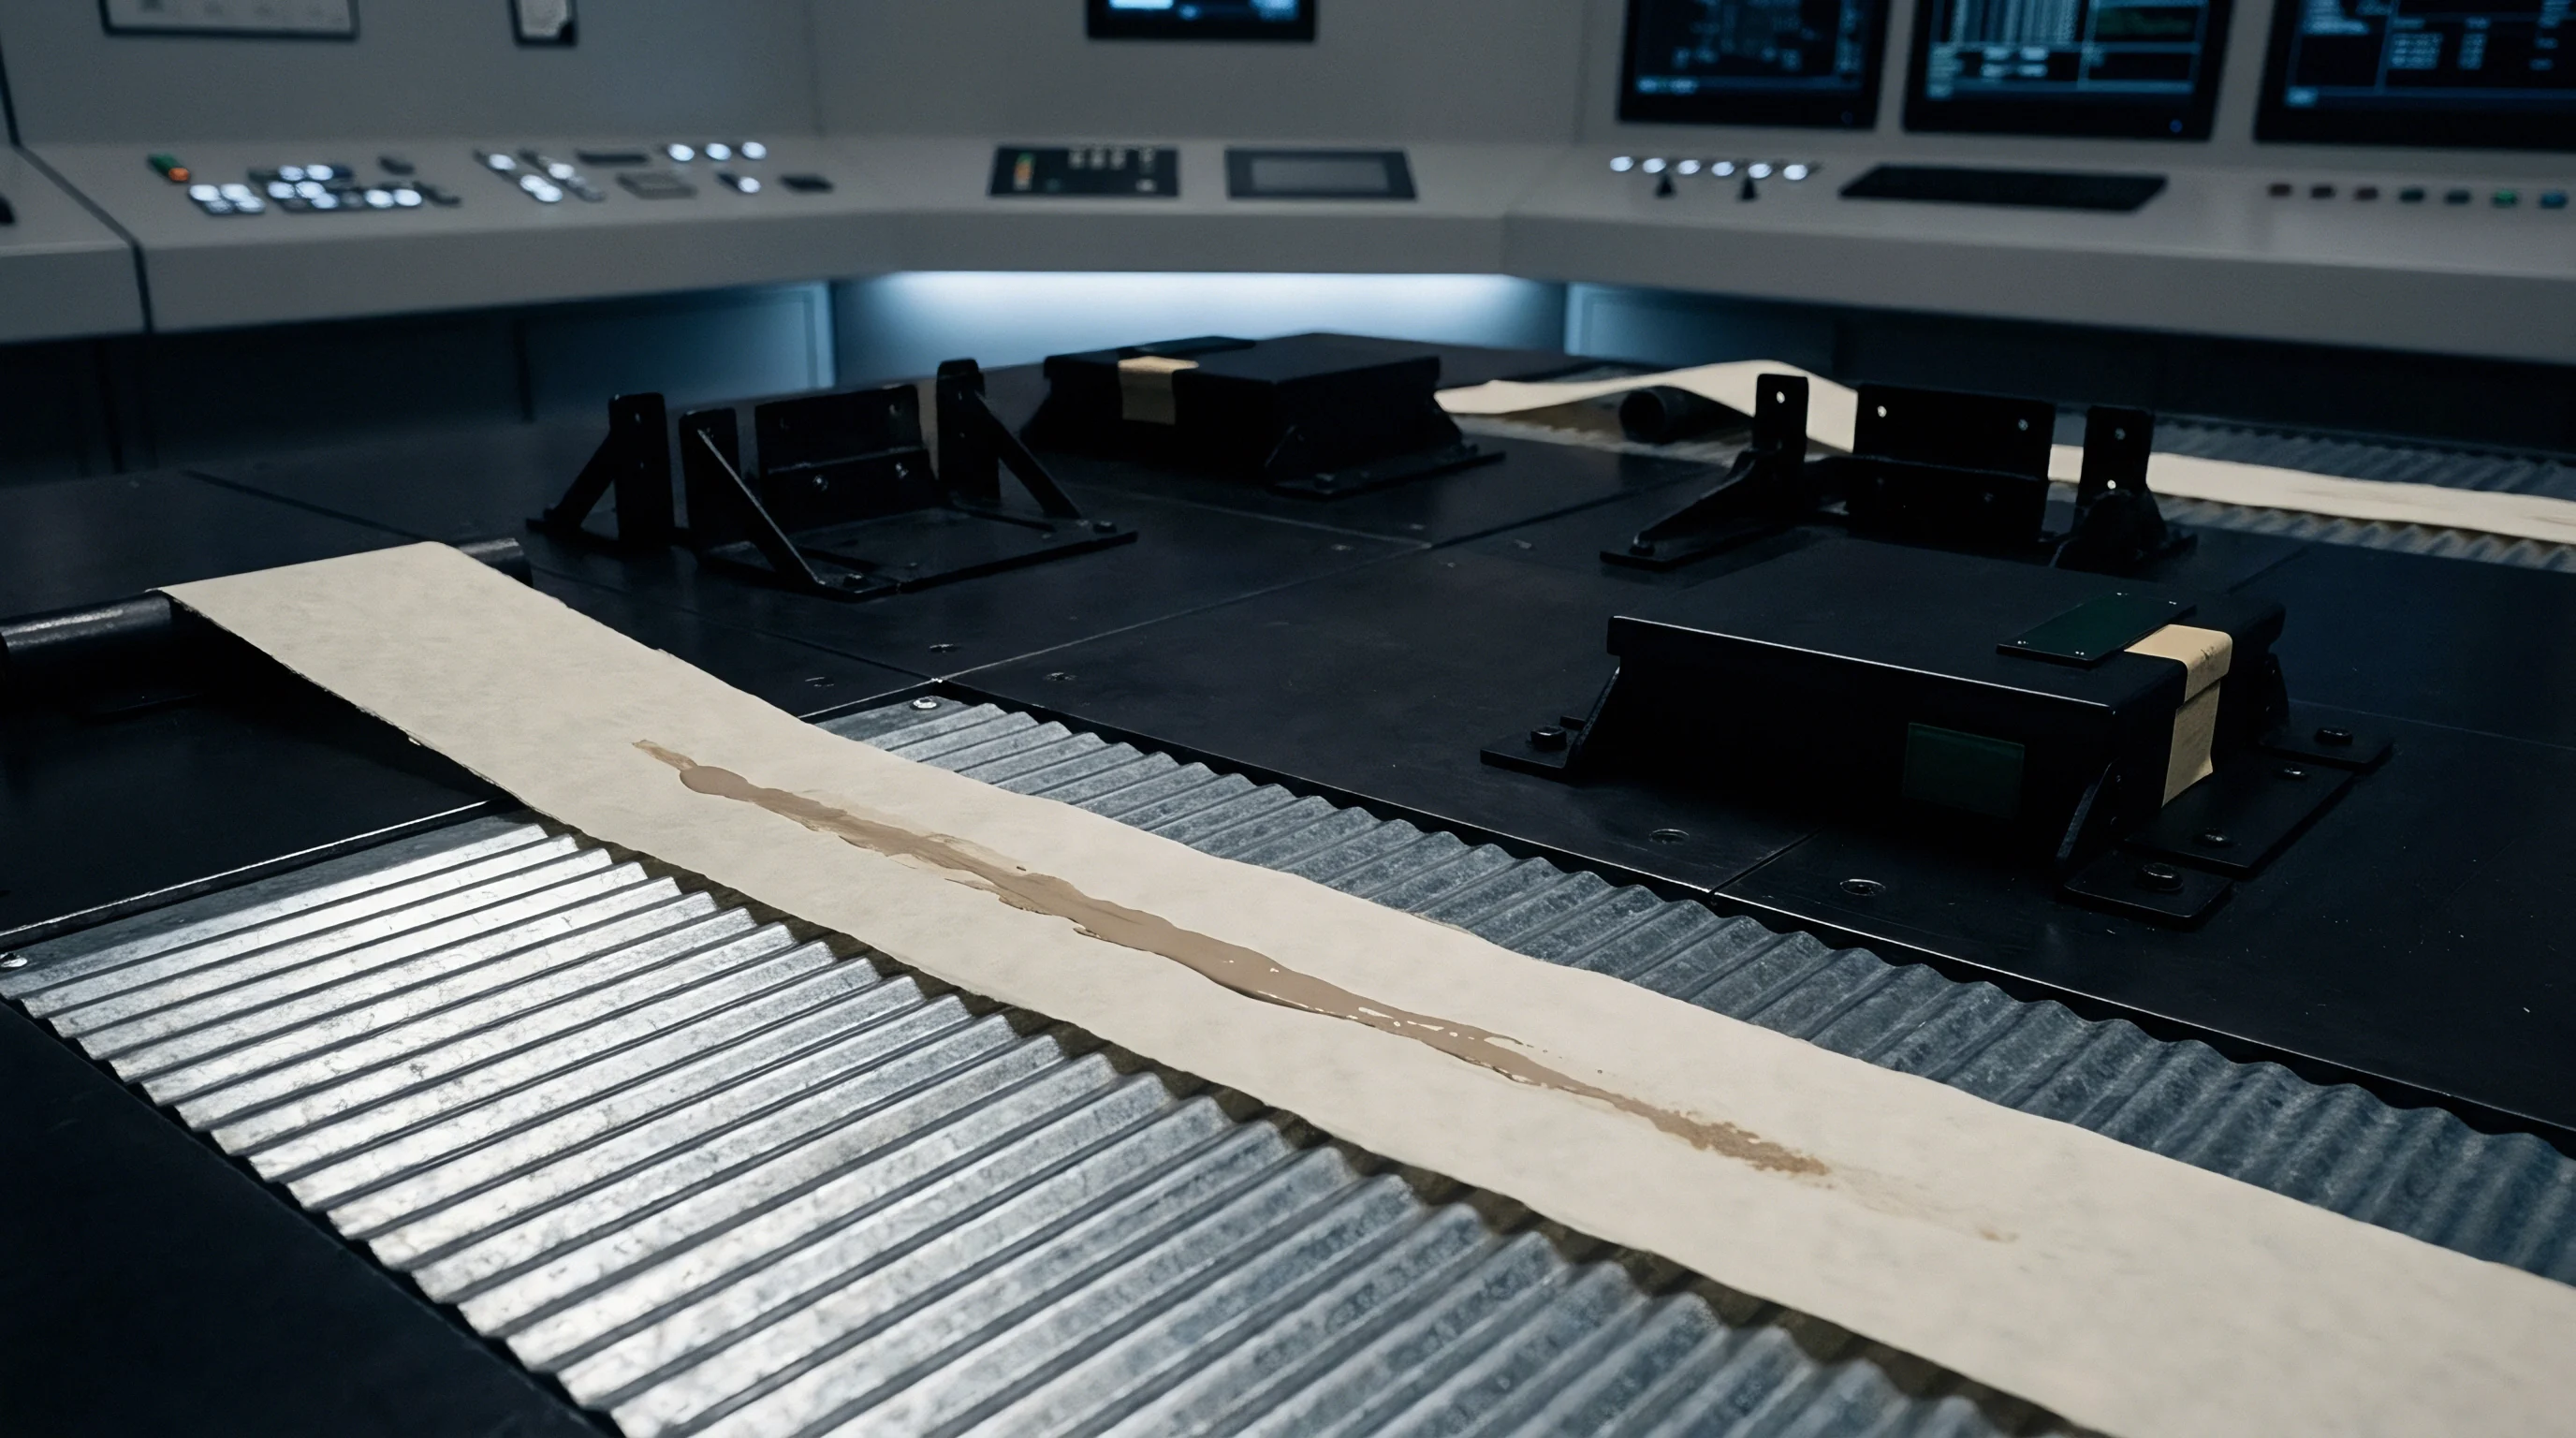
Process capability metrics evaluate whether a coating application reliably meets functional performance specifications. The process capability index Cpk measures the distance between the process distribution mean and the nearest specification limit, scaled by process variability. Standard deviation dictates barrier integrity.
Achieving a high capability index requires tight control over distribution spread and accurate setpoint positioning. For barrier paperboard, coat weight upper limits prevent cracking and drying energy overruns, while lower limits prevent barrier pinholes and ink absorption defects.
Process performance indices Pp and Ppk evaluate long-term population spread including machine shifts, batch changes, and environmental variation. A substantial difference between Cpk and Ppk highlights systemic instability across shift changes or raw material lot switches. Bivariate distribution modeling evaluates coat weight alongside surface property metrics such as Parker Print-Surf roughness or Cobb liquid absorption values.

Barrier Uniformity and Low Coat Weight Tail Risks
Functional barrier coatings, such as aqueous polymer dispersions or polyolefin extrusions, demand absolute surface coverage without structural voids. Coat weight dictates grease resistance. Defect frequency scales exponentially as local coat weight falls below critical application thresholds.
The lower statistical tail of the coat weight distribution determines total pinhole frequency across a finished reel.
When coat weight distribution exhibits negative skewness, localized low-mass areas occur more frequently than predicted by Gaussian normal distribution models. Localized coat weight drops cause pinholes. Water vapor transmission rates increase by orders of magnitude when pinhole frequency exceeds critical density thresholds, ruining board grease and moisture resistance performance.
| Coat Weight Setpoint | Process Std Dev (Sigma) | Lower Specification Limit | Calculated Cpk Index | Pinhole Frequency (per m²) | Barrier Compliance Outcome |
|---|---|---|---|---|---|
| 12.0 g/m² | 0.80 g/m² | 9.0 g/m² | 1.25 | 4.2 | Non-compliant for high-fat food packaging |
| 12.0 g/m² | 0.50 g/m² | 9.0 g/m² | 2.00 | 0.01 | Fully compliant with zero pinhole pass rate |
| 10.0 g/m² | 0.40 g/m² | 8.5 g/m² | 1.25 | 2.8 | Elevated risk of oil migration compliance failure |
| 15.0 g/m² | 0.90 g/m² | 10.0 g/m² | 1.85 | 0.00 | Compliant barrier but excessive drying heat cost |
Audit Checklist for Coating Process Capability Verification
Verifying mill statistical process capabilities requires examining documentary proof and data processing routines behind reported delivery lot numbers.
- Raw Data Sampling Frequency must record continuous scanner profiles at spatial intervals not exceeding 25 millimeters across the full trimmed web width.
- Data Filtering Protocols must preserve raw high-frequency spatial variation without applying excessive spatial moving-average smoothing that hides localized coat weight drops.
- Normality Verification Records must demonstrate statistical testing of profile distribution shapes to confirm Gaussian assumptions before reporting standard Cpk metrics.
- Decoupled Variance Statements must explicitly separate machine-direction temporal variance from cross-direction spatial variance in capability reporting calculations.
- Outlier Exclusion Logs must document every instance where raw sensor data was removed from capability calculations, specifying the exact technical cause.
Converting plants operating at low capability indices experience elevated ink absorption variance that forces press operators to increase ink film thickness beyond regulatory migration thresholds.
Supply contracts specifying minimum process capability indices are binding under standard commercial trade terms, meaning that reels delivered with calculated Cpk values below 1.33 violate warranty clauses and permit the buyer to reject the entire shipment without bearing return freight liabilities.

Conformity
Statistical process control verification links mill floor measurement directly to final packaging regulatory compliance files. Downstream food contact declarations, recyclability certifications, and barrier integrity guarantees depend on proving that coat weight distribution across every square meter of board remained within validated specification boundaries. Certificates of Analysis (CoA) providing simple reel-average coat weight figures fail to guarantee that localized low-weight defects are absent.
Modern verification demands continuous statistical summary files attached to individual reel identification numbers.
Batch acceptance sampling protocols per ISO 2859-1 utilize statistical lot evaluation methods based on Acceptable Quality Limits (AQL). Random sampling of master rolls for off-line destructive verification tests confirms on-line scanner readings. When laboratory test results fall outside statistical tolerance bands, the entire production lot undergoes isolation and secondary evaluation.
Analytical migration testing per EN 1186 confirms that binder and functional additive migration remains below regulatory thresholds when coat weight stays within established control bands.
Regulatory Frameworks and Recyclability Verification
Substrate compliance under the European Union Packaging and Packaging Waste Regulation (PPWR) demands verifiable material composition metrics. Synthetic polymer coat weight limits dictate whether paperboard qualifies for standard paper stream recycling. European paper recycling guidelines set by CEPI establish maximum synthetic binder mass fractions, typically capping total non-paper components at five to ten percent by dry weight.
Excess coat weight pushes board past recyclability thresholds, triggering eco-modulation fee penalties or product delisting.
Food contact compliance under European Regulation 1935/2004 and BfR Recommendation XXXVI requires continuous proof of coating layer consistency. Mineral oil hydrocarbon (MOH) barrier layers fail when local coat weight drops below critical threshold mass per unit area. Documenting continuous statistical control provides legal evidence that non-conforming web zones were successfully identified, flagged, and rejected at the mill slitter-winder stage prior to customer shipment.

Commercial Dispute Resolution and Verification Protocols
Disputes regarding delivered board coat weight arise when converter incoming quality control bench tests contradict mill Certificate of Analysis records. Resolving these technical conflicts requires examining calibration chains, conditioning protocols, and sampling geometries. Converting plants cut small swatches from reel outer layers, which often experience moisture pick-up or mechanical pressure during transit.
Un-conditioned bench testing yields distorted mass figures that do not reflect true dry coat weight applied on the machine deck.
Standardized dispute resolution protocol requires joint laboratory testing on referee samples conditioned strictly per TAPPI T 402 or ISO 187 standards. Both parties must evaluate swatches using identical test protocols, such as high-temperature solvent extraction or ash residue analysis. If off-line referee testing confirms that the mill scanner systematically under-reported coat weight variability, the mill assumes full financial responsibility for rejected converter stock and downstream print downtime costs.
What statistical sampling frequency and data retention architecture will paperboard buyers require from mills when automated, AI-driven customs inspection systems begin cross-referencing digital compliance dossiers against physical package barrier performance at international borders?