Calibrating Chromatic Confocal Height Metrics against Inner Liner Shear Rupture in Multi-Layer Coatings
Chromatic confocal optical height metrics predict inner liner shear rupture when calibrated against real interface depth and sub-surface stress limits.


Depth
Non-contact optical profiling across multi-layer barrier sheets relies on controlled wavelength dispersion to resolve spatial coordinates. Hyperchromatic lens systems focus distinct spectral wavelengths along an elongated optical axis. Red wavelengths focus at greater distances from the sensor head, while blue wavelengths focus closer to the optical assembly.
When a coated substrate sits within this measurement zone, the specific wavelength focused precisely on an optical boundary reflects back through a pinhole aperture onto a spectrometer. Calculating the spectral peak position yields exact vertical height coordinates without physically touching fragile surface coatings.

Refractive Offsets across Multi-Pass Optical Interfaces
Light traveling through transparent polymer films slows down according to the refractive index of each material pass. Multi-layer packaging structures containing polyolefin barrier coatings, latex pigment pre-coats, and clear overprint varnishes create multiple optical interfaces. Each boundary reflects a portion of the chromatic light spectrum back to the detector array.
Converting peak spectrometer readings into physical layer thicknesses demands accounting for the refractive index of every layer. Uncorrected optical path measurements exaggerate film thickness by a factor equal to the refractive index ratio, creating false readings on sub-surface topography.
Peak spectral wavelength return on semi-transparent extrusion coatings shifts by 1.48 nanometers per micron of optical path length under standard 23 degree Celsius testing conditions.
Optical thickness measurements require distinct refractive correction factors across the light spectrum. Standard polyethylene barrier films present a refractive index of approximately 1.51 at 589 nanometers wavelength, whereas acrylic overprint varnishes exhibit indices around 1.49. Profiling sub-surface liner interfaces through these upper passes distorts vertical z-axis coordinates if signal processing algorithms apply a single nominal index.
Modern chromatic sensor software applies chromatic dispersion curves to map individual wavelengths to corrected physical depth coordinates.
Signal attenuation through pigmented layers presents another physical barrier to signal capture. Inorganic pigments like titanium dioxide and calcium carbonate scatter light heavily across visible wavelengths. When top-coat pigment loading exceeds twenty grams per square meter, backscatter noise overwhelms the secondary optical signal reflected from the inner liner interface.
High-power LED sources coupled with high dynamic range spectrometer arrays recover these faint interface reflection peaks, allowing accurate measurement of embedded liner topography beneath opaque coatings.
Unresolved optical reflections occur when internal layer boundaries sit closer together than the axial chromatic resolution of the optical probe. Spatial resolution limits stem directly from the numerical aperture of the sensor lens and the spectral dispersion range. Standard industrial chromatic probes achieve axial resolutions between 10 nanometers and 0.5 microns across measurement ranges from 100 microns to 10 millimeters.
Placing thin functional primer coats under 1 micron thick beneath heavy outer varnishes causes signal peak overlap, where the primary surface reflection merges with the internal interface signal.
Deconvolution algorithms separate these overlapping spectral peaks by fitting Gaussian mathematical functions to the raw intensity distribution curve. Isolating the distinct component signals allows the optical instrument to identify interface locations that appear as a single broad swell in raw data. The physical limit of this technique rests on the signal-to-noise ratio of the reflection spectrum.
How far optical deconvolution algorithms can isolate sub-micron liner interfaces beneath highly scattering pigment layers without generating false depth artifacts remains a subject of active physical metrology research.


Shear
Mechanical stress inside laminated packaging structures concentrates along internal boundaries during conversion processes like scoring, folding, and embossing. When a multi-layer board passes through scoring rules, compressive forces on the outer face generate intense shear stresses along internal ply boundaries and coating interfaces. If local shear stress exceeds the interfacial adhesive bond energy, internal delamination occurs.
This localized separation weakens the mechanical barrier before any visible outer surface cracking appears.
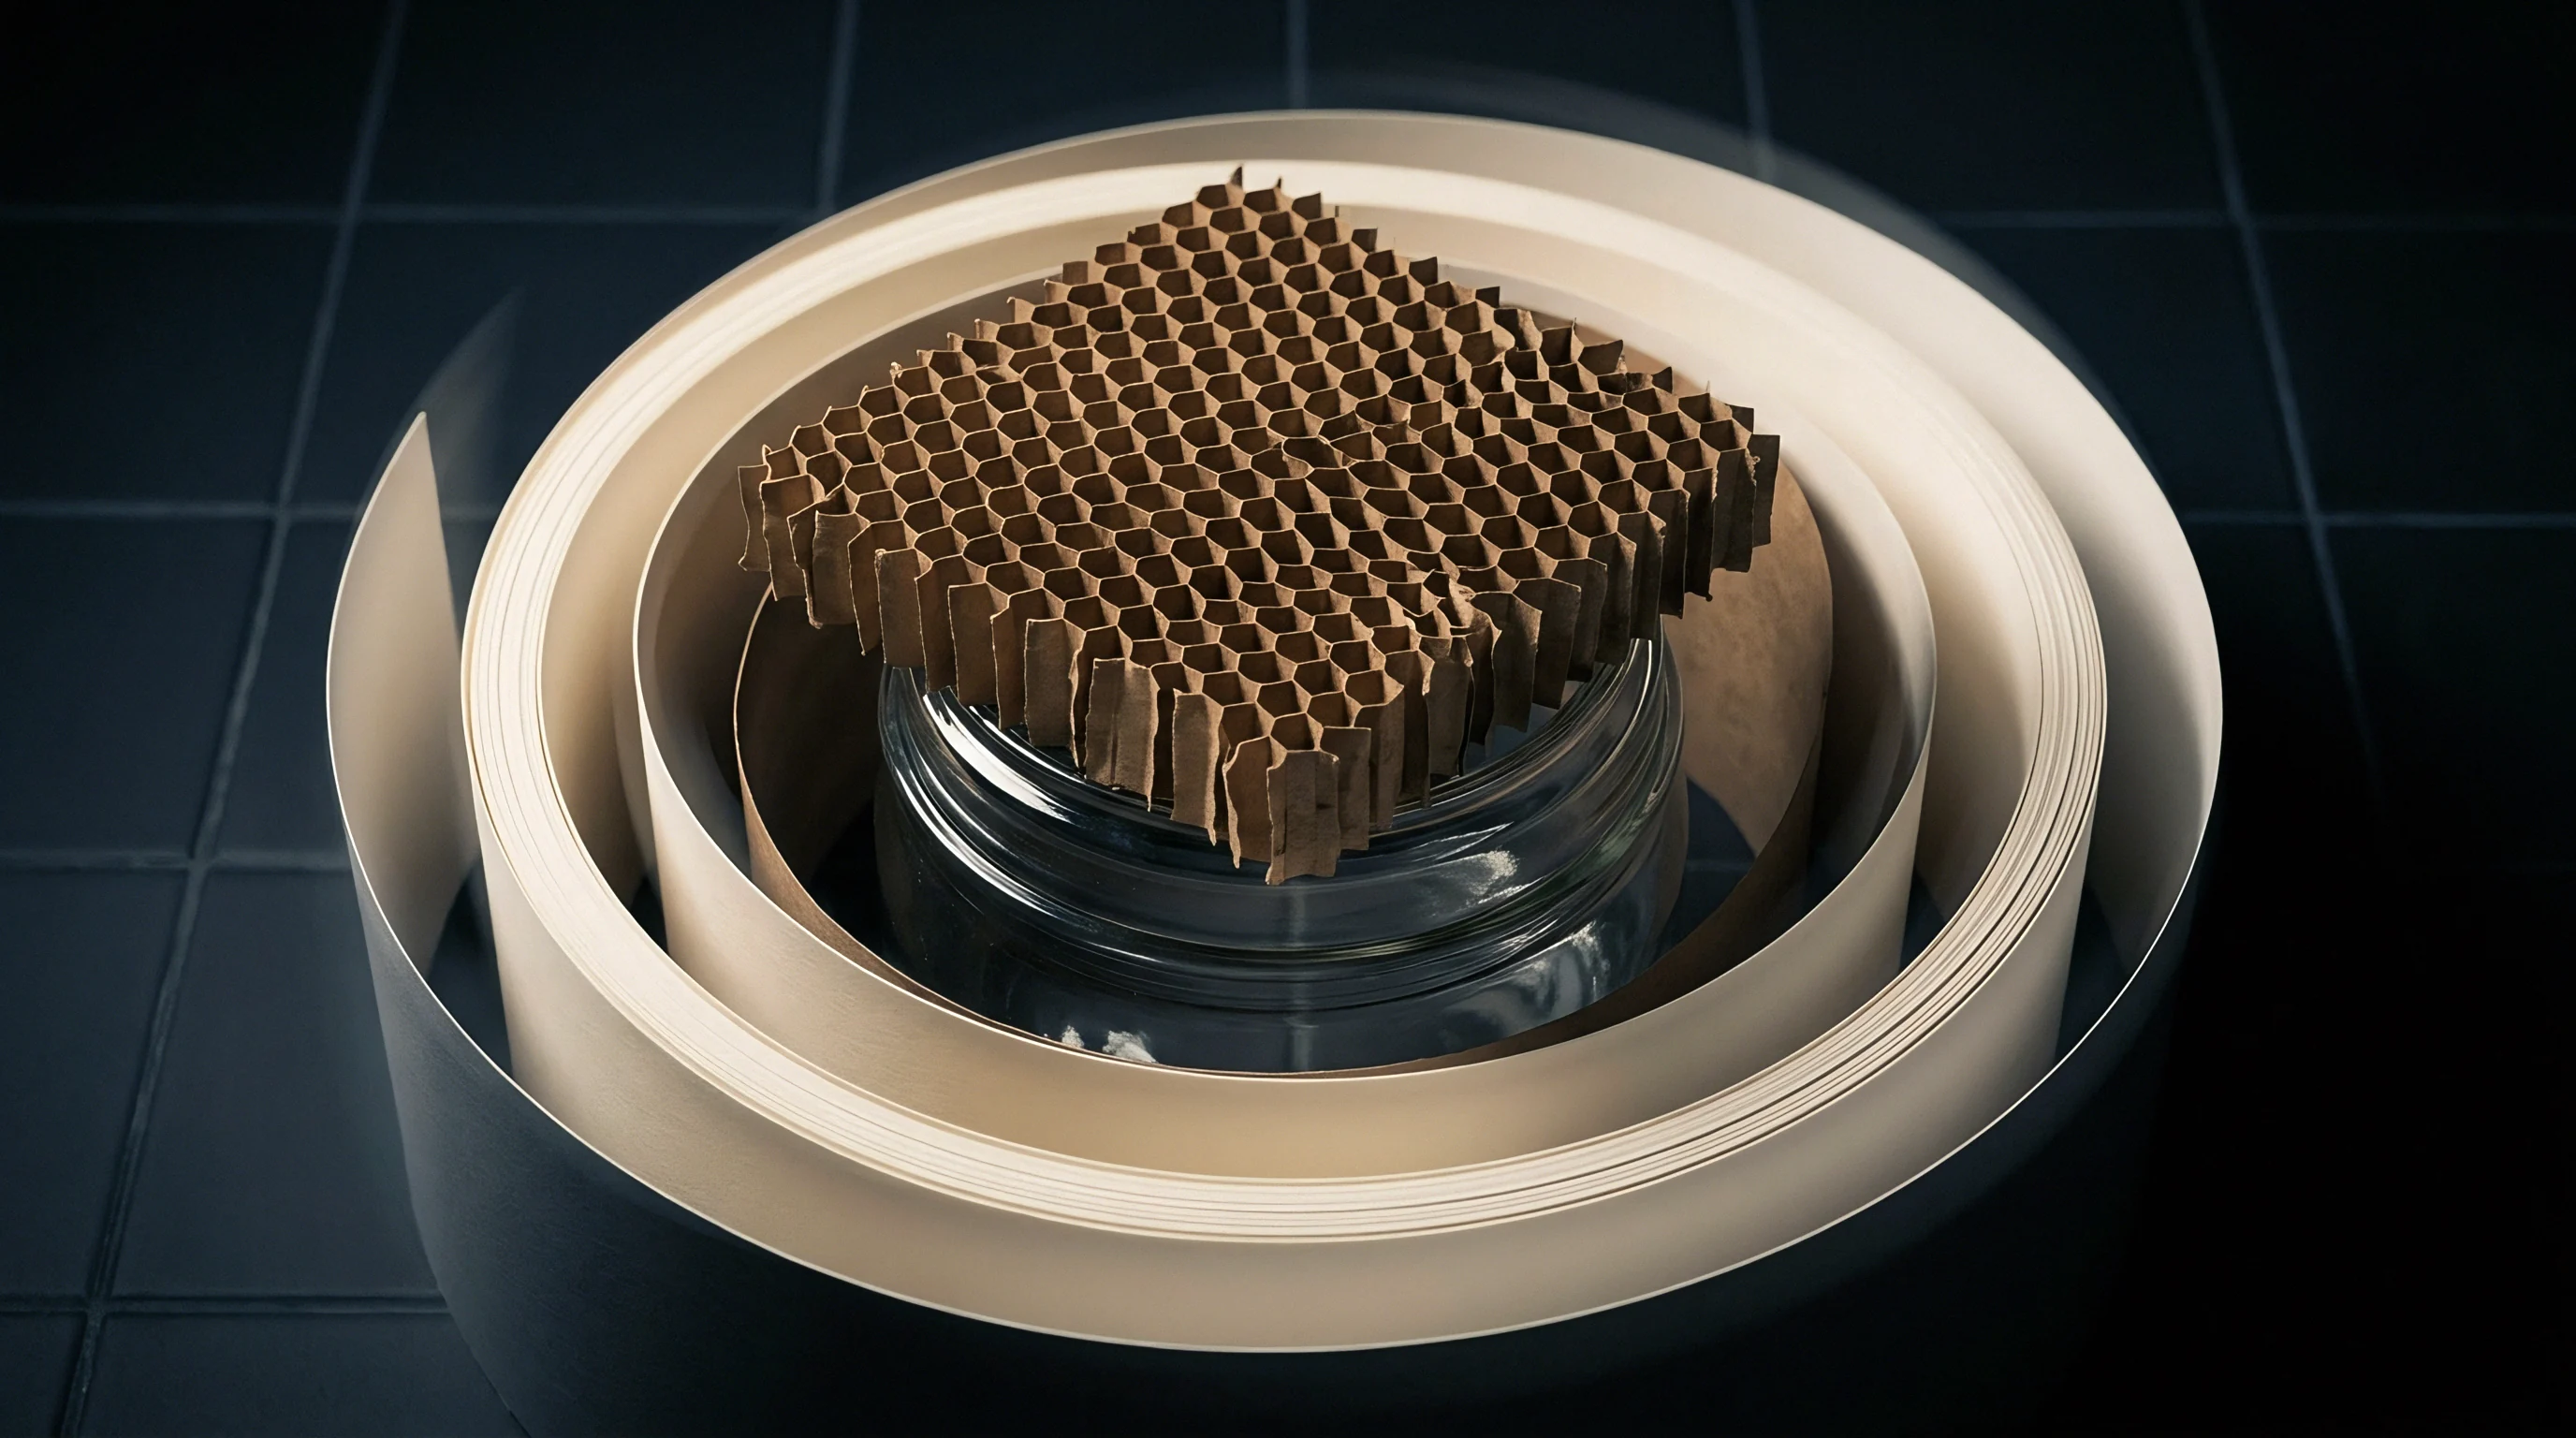
Interfacial Failure Modes in Barrier Coated Paperboard
Delamination along coated board plies happens when localized mechanical load exceeds adhesive bond energy. Outer polymer films often possess high tensile elongation capacity, stretching across score lines without breaking. The internal liner beneath, bound to rigid paperboard fibers through an intermediate mineral coating, experiences severe shear displacement.
Micro-fractures originate within the brittle mineral pigment matrix or at the low-energy polymer interface, expanding laterally under line tension.
According to ISO 1924 test guidelines, board samples conditioned at 50 percent relative humidity exhibit a 15 percent drop in interfacial shear strength when internal moisture content shifts by two percent.
Mechanical failure cascades through distinct structural zones under converting stresses:
- Cohesion breakdown within pigment pre-coat occurs when binder concentration falls below critical pigment volume limits, leaving mineral particles susceptible to micro-cleavage under cross-web shear force.
- Adhesion loss at polymer interface manifests when low surface energy extrusion coatings detach from hydrophilic fiber networks under intense local bending strain.
- Fiber tear in base board plies develops when interfacial bond strength exceeds internal fiber-to-fiber bond capacity, pulling structural cellulose fibers away from the primary liner matrix.
- Coating rupture along creasing axes materializes when extreme compressive displacement pushes rigid mineral structures past their strain limit, severing continuous barrier performance.
Quantifying shear rupture boundaries demands analyzing both tensile elongation limits and compressive stress distribution. Creasing matrices crush the paperboard base while pushing the inner liner into a formed channel. Outer plies extend under tension while inner plies compress under high lateral shear gradients.
If the inner barrier liner cannot accommodate this lateral shear displacement, internal tearing breaks the barrier integrity while the outer printed surface remains intact.
Sub-surface shear rupture remains invisible to conventional vision inspection systems during high-speed converting runs. Surface inspection optical cameras capture only exterior ink and varnish integrity, missing underlying layer separation. Liquid penetrant testing reveals barrier failure post-conversion, but destroys test samples and delays floor feedback.
Surface height profile anomalies, detected optically prior to catastrophic failure, serve as early indicators of internal structural deformation.
Internal layer detachment creates subtle surface displacement signatures before complete film rupture takes place. As internal shear forces pull the liner away from the paperboard base, stress relaxation causes localized optical swelling or depression on the outer coating face. Measuring these micro-topographical shifts through non-contact height profiling provides a non-destructive method for detecting sub-surface shear rupture early in production.
Keeping score depth within 1.2 times the total board caliper prevents internal shear rupture on standard folding lines.


Focus
Optical sensor positioning dictates signal clarity when capturing subtle topographic variations across complex multi-pass coatings. Maintaining correct stand-off distance places the measurement area squarely within the linear region of chromatic aberration. Operating near the outer limits of the optical sensor range reduces signal intensity and broadens spectral reflection peaks.
Precision mounting fixtures isolate sensor heads from frame flexure and thermal expansion during extended converting runs.

Sensor Calibration and Spectral Peak Extraction Procedure
Engineers setup chromatic optical systems by standardizing signal intensity thresholds relative to background scatter. Ambient light leakage and dark current noise lower spectrometer dynamic range if uncorrected. Routine calibration against certified optical mirror targets sets baseline intensity curves across the entire operational wavelength spectrum.
Optical gain settings must balance weak signal returns from low-reflectance inner interfaces against saturation from highly specular top coats.
- Mount the chromatic optical probe perpendicular to the target web path within 0.05 degrees of absolute axial alignment.
- Position the optical sensor at its calibrated working distance using a micro-adjustment stage referenced against a master block.
- Perform dark-spectrum subtraction by closing the optical path shutter and recording residual sensor cell intensity across all wavelengths.
- Calibrate spectral intensity scale using a certified front-surface silver reference mirror positioned at the midpoint of the measuring range.
- Adjust LED light source power and integration time until peak signal reflection reaches 85 percent of maximum detector saturation.
- Set dynamic peak extraction thresholds above background noise floor levels to eliminate optical reflection artifacts.
Choosing proper numerical aperture balances spatial height resolution against working distance and tilt tolerance. Sensors with higher numerical apertures collect scattered light across wider angles, improving performance on rough or tilted surfaces. However, high numerical aperture optics reduce stand-off distance, increasing the risk of web contact during momentary tension drops.
Lower numerical aperture heads offer generous clearance but lose signal return when target surfaces tilt past three degrees relative to the optical axis.
| Probe Class | Measuring Range (mm) | Working Distance (mm) | Numerical Aperture | Axial Resolution (um) | Max Tilt Angle (deg) |
|---|---|---|---|---|---|
| High-Precision Micro | 0.10 | 4.5 | 0.60 | 0.008 | 30.0 |
| Standard Industrial | 1.00 | 12.5 | 0.30 | 0.040 | 14.0 |
| Long Range Process | 10.00 | 75.0 | 0.12 | 0.350 | 5.5 |
| Extended Clearance | 25.00 | 120.0 | 0.08 | 1.100 | 3.0 |
| Data measured under controlled laboratory conditions at 20 degrees Celsius using dark-subtracted reference optical mirrors. | |||||
Coating suppliers frequently claim that surface roughness variation below 0.5 microns has no effect on barrier integrity. Field inspection reveals that micro-topographical variations beneath that threshold frequently act as stress concentration points under high nip pressure. Ignoring sub-micron optical variations allows early shear propagation to pass quality gates unnoticed.


Correlations
Connecting surface roughness metrics to internal mechanical strength demands precise empirical mapping across varied production batches. Standard areal height parameters like average roughness Sa and ten-point height Sz capture overall surface texture but miss localized sub-surface deformation. Advanced statistical parameters like surface skewness Ssk and valley void volume Vvv track structural changes associated with inner liner failure more reliably.

Mapping Areal Surface Metrics to Interfacial Shear Rupture
Statistical height distributions shift predictably as inner liner shear rupture develops beneath multi-layer coatings. Surface skewness Ssk measures the asymmetry of the height distribution profile around the mean plane. Negative Ssk values indicate a surface dominated by deep valleys or local depressions, characteristic of sub-surface delamination zones where internal support has yielded under shear stress.
Spatial parameter Spd, tracking peak density, identifies localized coating bucking surrounding shear zones.
A material lot meeting surface average roughness Sa specifications under ISO 25178 can still contain local sub-surface shear failures if valley void volume Vvv exceeds 0.08 cubic microns per square micron.
Correlating optical surface data with physical shear failure requires controlled laboratory testing. Multi-layer board samples undergo progressive mechanical shear loading inside specialized testing rigs while chromatic confocal sensors continuously log surface profile shifts. Graphing peak-to-valley height changes against applied shear load reveals clear transition points where elastic coating deformation shifts into irreversible interfacial rupture.
| Surface Metric | ISO Metric Code | Baseline Range | Rupture Threshold | Correlation Coefficient (R2) |
|---|---|---|---|---|
| Average Height | S_a (um) | 0.45 – 0.85 | > 1.35 | 0.42 |
| Ten-Point Height | S_z (um) | 2.10 – 4.50 | > 8.20 | 0.68 |
| Surface Skewness | S_sk | -0.15 – +0.30 | < -1.25 | 0.89 |
| Valley Void Volume | V_vv (um3/um2) | 0.012 – 0.035 | > 0.082 | 0.94 |
| Peak Density | S_pd (1/mm2) | 1200 – 2500 | < 650 | 0.79 |
Valley void volume Vvv shows the strongest mathematical correlation with inner liner shear failure. As internal plies separate, localized collapse of the supporting paperboard matrix forms micro-depressions on the outer face. Standard roughness averages dilute these isolated features across the entire sampling area, whereas valley volume metrics isolate deep localized structural flaws directly.
Tracking Vvv values across converting shifts gives operators early warning of internal bond deterioration.

Where Does Metrology Drift Standardize Yield Thresholds?
Production limits drift when optical height metrics decouple from physical bond performance. Standard quality contracts often specify minimum tensile bond strengths measured via destructive z-direction peel tests. Inserting non-contact chromatic height limits into purchase specifications requires linking specific Vvv and Ssk thresholds directly to contractually defined peel values.
Aligning metrology parameters with physical failure points protects converters from accepting board lots susceptible to inner liner shear rupture.
Standard quality documentation specifies that board lots exhibiting surface metric deviations beyond three standard deviations from reference baselines trigger immediate hold procedures. Under standard EN 13430 packaging compliance guidelines, establishing non-destructive metrology thresholds as binding quality criteria requires verifying statistical correlation against physical destructive bond measurements across at least five consecutive production runs.


Interference
Web handling variables introduce acoustic vibrations and micro-flexures that disturb high-precision non-contact measurements. Plant floor environments present structural vibration frequencies between 10 Hertz and 500 Hertz, originating from press drives, rotary die cutters, and air handling equipment. Unisolated optical heads record these machine movements as surface height variations, obscuring real coating topography.
Air currents across open web gaps also alter the local optical refractive index, introducing high-frequency noise into spectral peak location processing.

Inline Metrology Integration on Converting Lines
Stabilizing packaging webs against non-contact inspection probes demands specialized mechanical restraint hardware. Precision vacuum backing rolls pull paperboard tight against ground steel drums directly beneath the optical sensor location, suppressing web flutter within a two-micron vertical window. Non-contact air bearings stabilize flexible film webs without scratching delicate outer barrier varnishes, keeping optical path lengths constant during high-speed production runs.
Integrating air-bearing web stabilizers maintains vertical web position within plus or minus 1.5 microns across line speeds reaching 400 meters per minute.
Converting operators utilize structured decision protocols to isolate metrology faults from actual material defects on running lines:
- Check mechanical web stabilization vacuum pressure to ensure continuous physical contact against the inspection reference roll before logging height metrics.
- Verify optical probe lens cleanliness by checking total return signal intensity against master mirror baseline records.
- Inspect web guide tracking alignment to prevent lateral sheet wander from moving target paths outside the calibrated optical field.
- Validate real-time speed compensation factors so signal integration time scales correctly with web movement velocity.
- Cross-reference height anomaly coordinates with rotary die cylinder rotation periods to rule out mechanical roll impression damage.
Temperature fluctuations on converting floors cause optical mounting structures to expand or contract across multi-hour production runs. Aluminum mounting brackets display thermal expansion coefficients around 23 microns per meter per degree Celsius. A five-degree temperature shift on a half-meter sensor support arm shifts the optical probe position by nearly six microns, completely invalidating sub-micron layer thickness measurements.
Invar alloy mounting frames or active thermal compensation sensors eliminate thermal position drift during long jobs.
Failing to isolate metrology hardware from press frame vibration causes continuous false failure alarms during high-speed runs. Unfiltered vibration signals register as artificial surface roughness peaks, forcing press operators to slow production lines unnecessarily. Unresolved mechanical motion corrupts height dataset metrics, making reliable calibration against inner liner shear rupture impossible.


Valuation
Financial losses from unpredicted coating delamination emerge directly at customer filling plants. When inner barrier liners suffer shear rupture during converting, modified atmosphere packaging loses gas tightness, causing food product spoilage before retail expiration dates. Converting operations face massive commercial penalties, including full job credit allowances, destroyed product claims, freight recovery charges, and immediate suspension from active supplier lists.

Yield Loss Calculations across Sub-Surface Quality Failures
Converting plants calculate net scrap by combining physical web waste with customer returns. High-speed folding boxboard lines running at 300 meters per minute generate significant financial risk if sub-surface liner shear rupture remains undetected across multiple master rolls. Spotting structural coating failure via inline chromatic metrology before shipping finished carton blanks protects converting operating margins.
| Cost Component | Uncalibrated Inspection Baseline | Calibrated Chromatic Control | Variance Per 100k Packs ($) |
|---|---|---|---|
| Make-Ready Waste Board | 1,850 kg ($3,330) | 620 kg ($1,116) | -2,214 |
| Inline Spoilage Blanks | 4.2 percent ($5,040) | 0.8 percent ($960) | -4,080 |
| Customer Claim Exposure | 1.5 percent lot risk ($12,500) | 0.0 percent ($0) | -12,500 |
| Optical Probe Maintenance | $450 amortized | $850 amortized | +400 |
| Net Production Cost | $21,320 per run | $2,926 per run | -18,394 |
Consider a practical converting run producing 500,000 liquid packaging cartons using multi-layer polyolefin barrier board valued at 1,800 dollars per metric ton. Assume baseline substrate caliper sits at 450 microns with a total run weight of 45 metric tons. Running without calibrated optical metrology risks passing micro-delaminated carton blanks that fail at customer filling lines under hot-fill thermal stress.
Standard commercial contracts assign liability for lost product, line downtime, and disposal costs directly to the board converter.
Calibrating chromatic confocal optical sensors to detect inner liner shear rupture adds initial metrology tooling costs and requires technical operator training. Sensor hardware, vacuum stabilization units, and signal processing software demand an upfront line investment of roughly 68,000 dollars per converting lane. Operating cost additions include routine sensor lens cleanings, optical reference recalibrations, and periodic light source replacements.
Yield savings offset capital metrology expenditures rapidly on high-speed lines. Detecting sub-surface liner detachment during make-ready allows press operators to adjust creasing rule depth, nip pressure, and web tension before running thousands of scrap sheets. Reducing job waste by three percent pays off the inline metrology investment within four months of steady operation.
Precision height calibration converts unpredictable field failure risk into controlled floor process performance.