Quantifying Surface Elevation Variance along Score Lines Using Optical Profilometry
Optical profilometry quantifies score elevation variance down to sub-micron resolution, identifying die wear and coating micro-fractures before carton assembly.
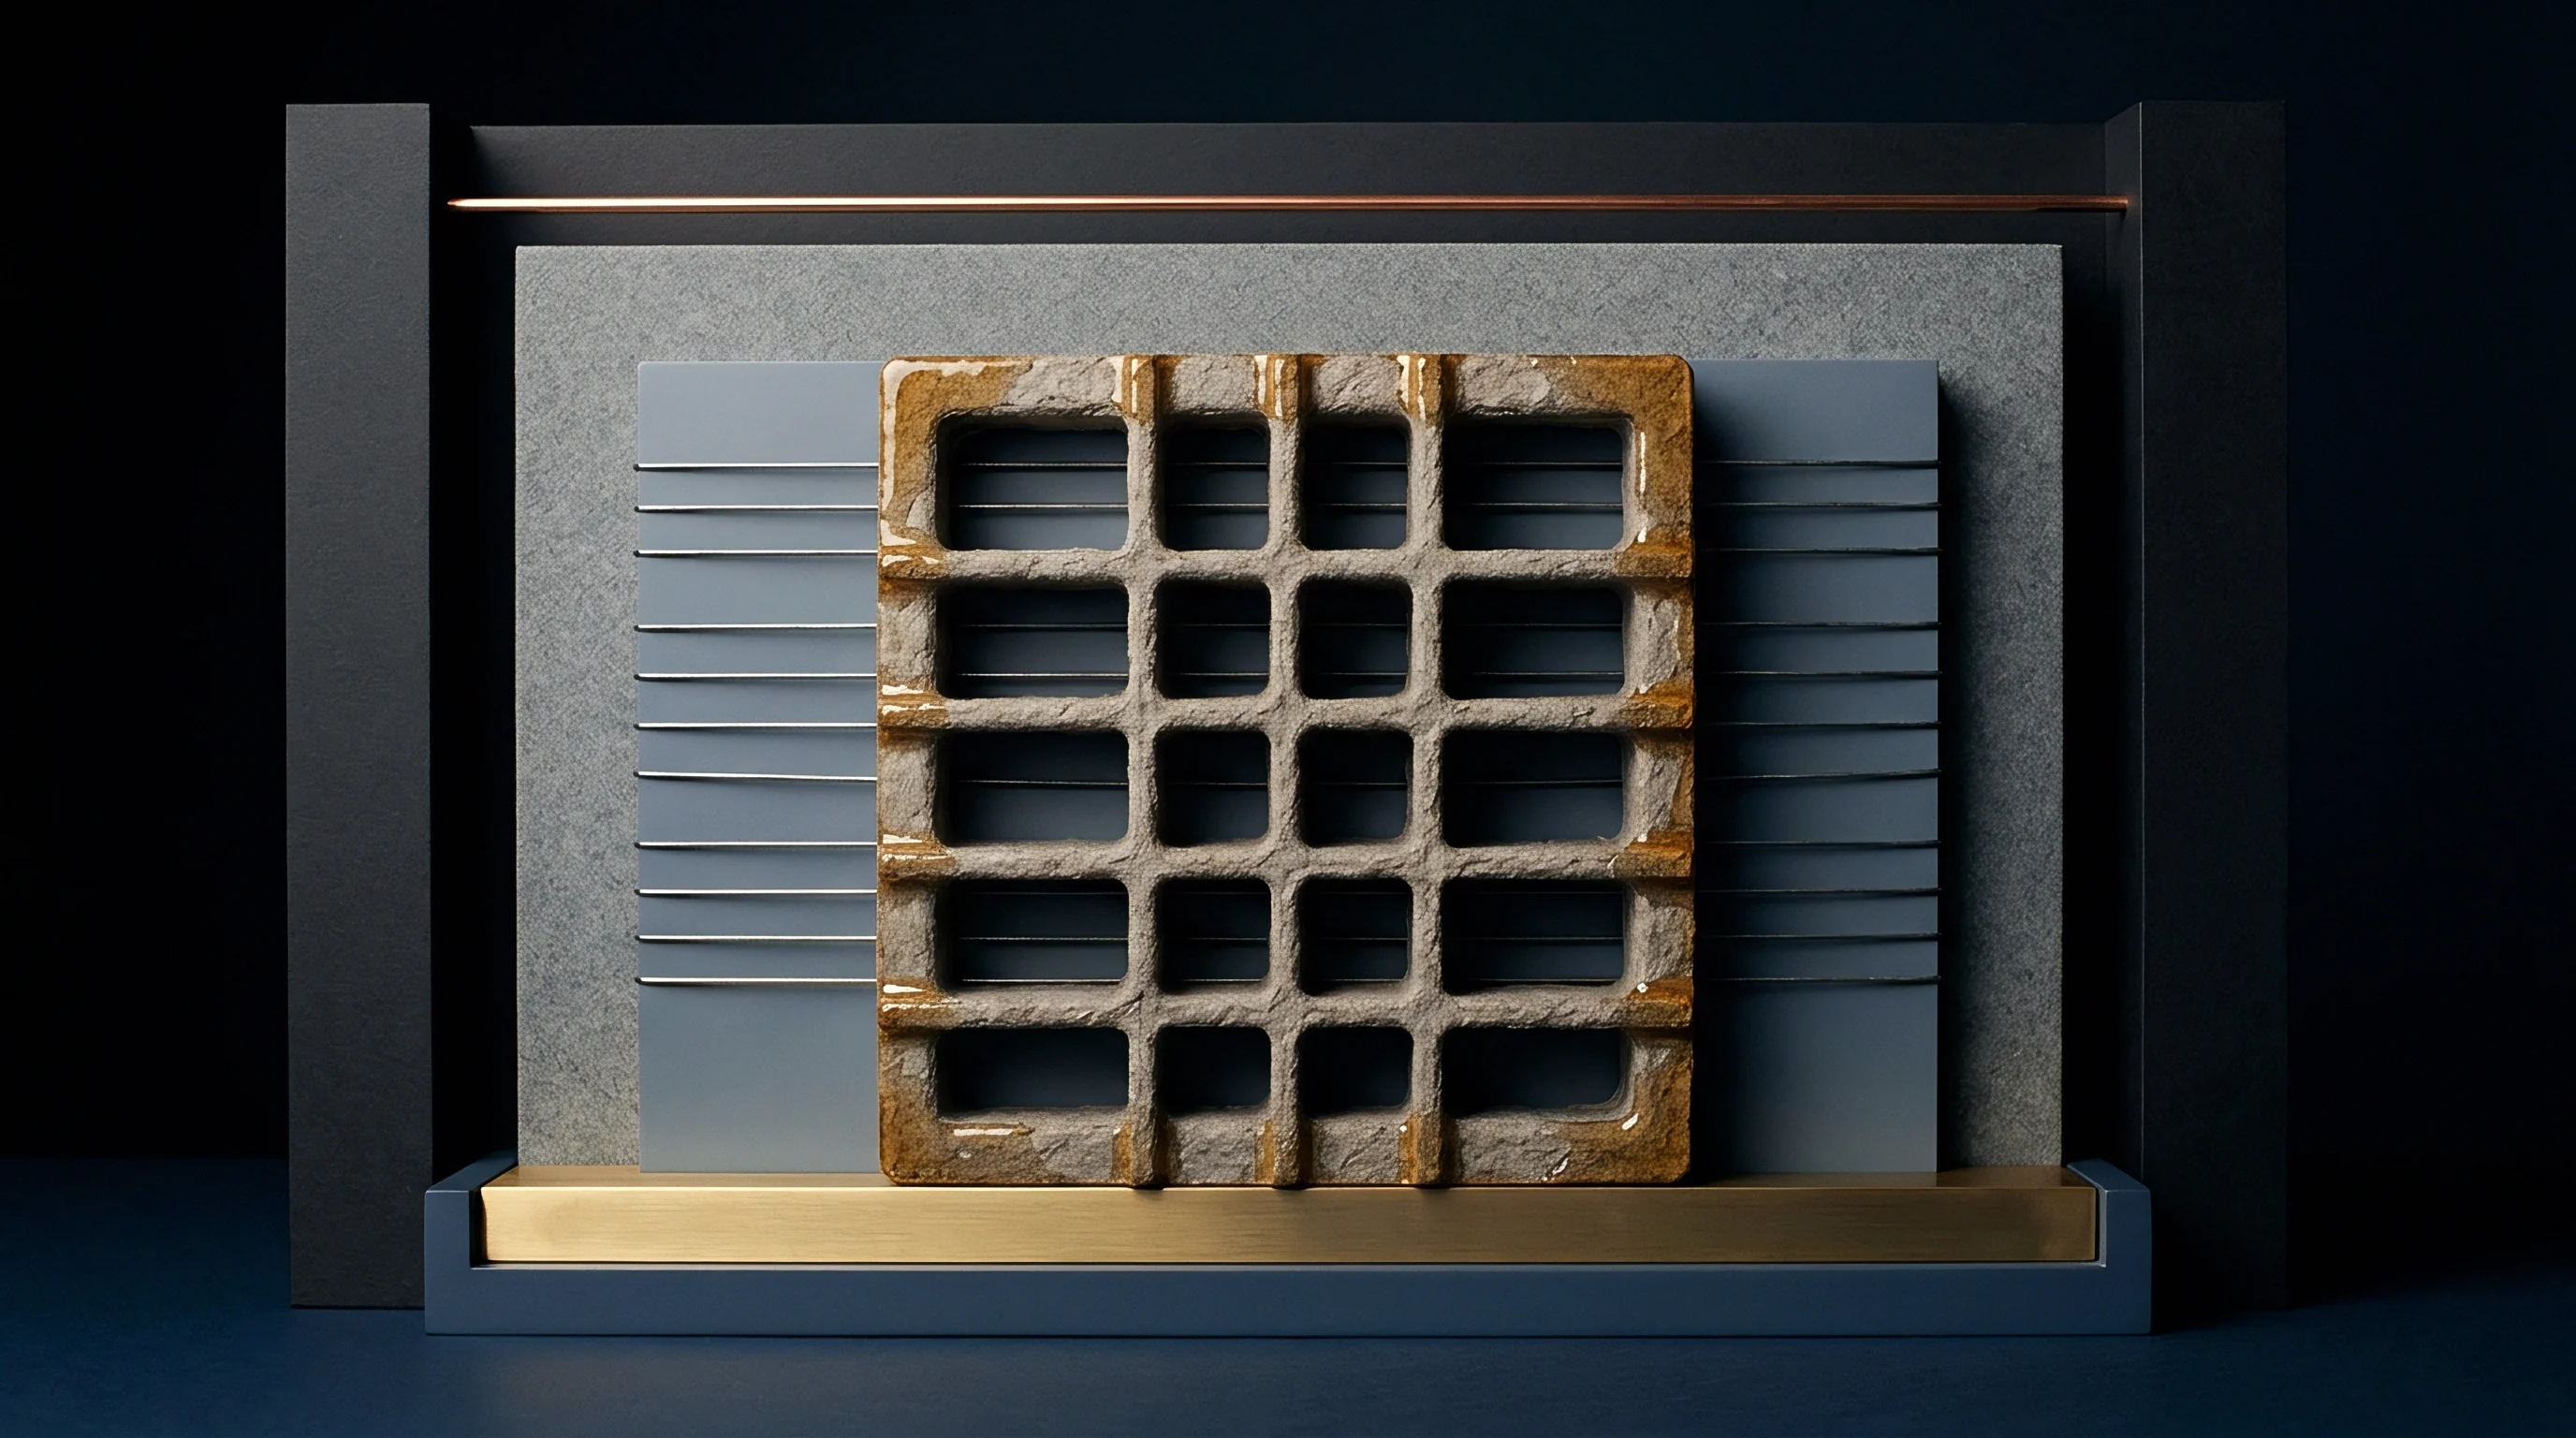

Topography
Score lines form through localized matrix displacement during mechanical penetration. When a steel creasing rule strikes paperboard against a female matrix channel, the multi-ply cellulose structure undergoes targeted shear breakdown. Internal delamination allows the paperboard sheet to fold along a defined axis without uncontrolled cracking of the outer liners.
Matrix depth governs delamination. When anvil matrix channel width or rule penetration varies across the bed of a flatbed die cutter, the height profile along the creasing track becomes inconsistent. Surface elevation measurement captures these spatial deviations along the score axis in three dimensions without damaging the fragile paper structure.
Contact stylus profilometers exert mechanical forces between 0.5 mN and 2 mN during raster sweeps. Soft mineral coatings, low-density top liners, and thermoplastic barrier layers deform under stylus pressure, altering peak-to-valley profile values. Optical surface measurement bypasses physical contact errors.
Non-contact three-dimensional profiling maps surface height distribution across both the male bead crest and the adjacent shoulder valleys, identifying non-uniform rule penetration before folded cartons reach high-speed conversion equipment.
At 50 percent relative humidity, a 15-micron variance in score depth alters carton opening force by 18 percent.
Target elevation profiles depend on substrate caliper, fibre orientation, and total coating coat weight. Measuring surface elevation variance along score lines exposes local variations caused by uneven die impression pressure, worn counter-matrix grooving, or thickness variations within the mill substrate. Monitoring elevation deviations along the score track provides early detection of tool degradation across extended converting runs.
| Substrate Grade | Nominal Caliper (µm) | Crease Depth Target (µm) | Maximum Elevation Variance Sa (µm) | Acceptable Shoulder Slope (deg) |
|---|---|---|---|---|
| Solid Bleached Sulfate (SBS) | 350 | 140 | 2.5 | 38 – 42 |
| Folding Boxboard (FBB) | 450 | 185 | 3.8 | 35 – 40 |
| Coated Recycled Board (CRB) | 500 | 195 | 5.2 | 32 – 38 |
| Barrier Coated Board | 400 | 160 | 3.0 | 36 – 41 |
Uncontrolled variance in score elevation leads directly to erratic folding resistance, causing skew during high-speed carton erecting and unpredicted seam failures on automated packaging lines.
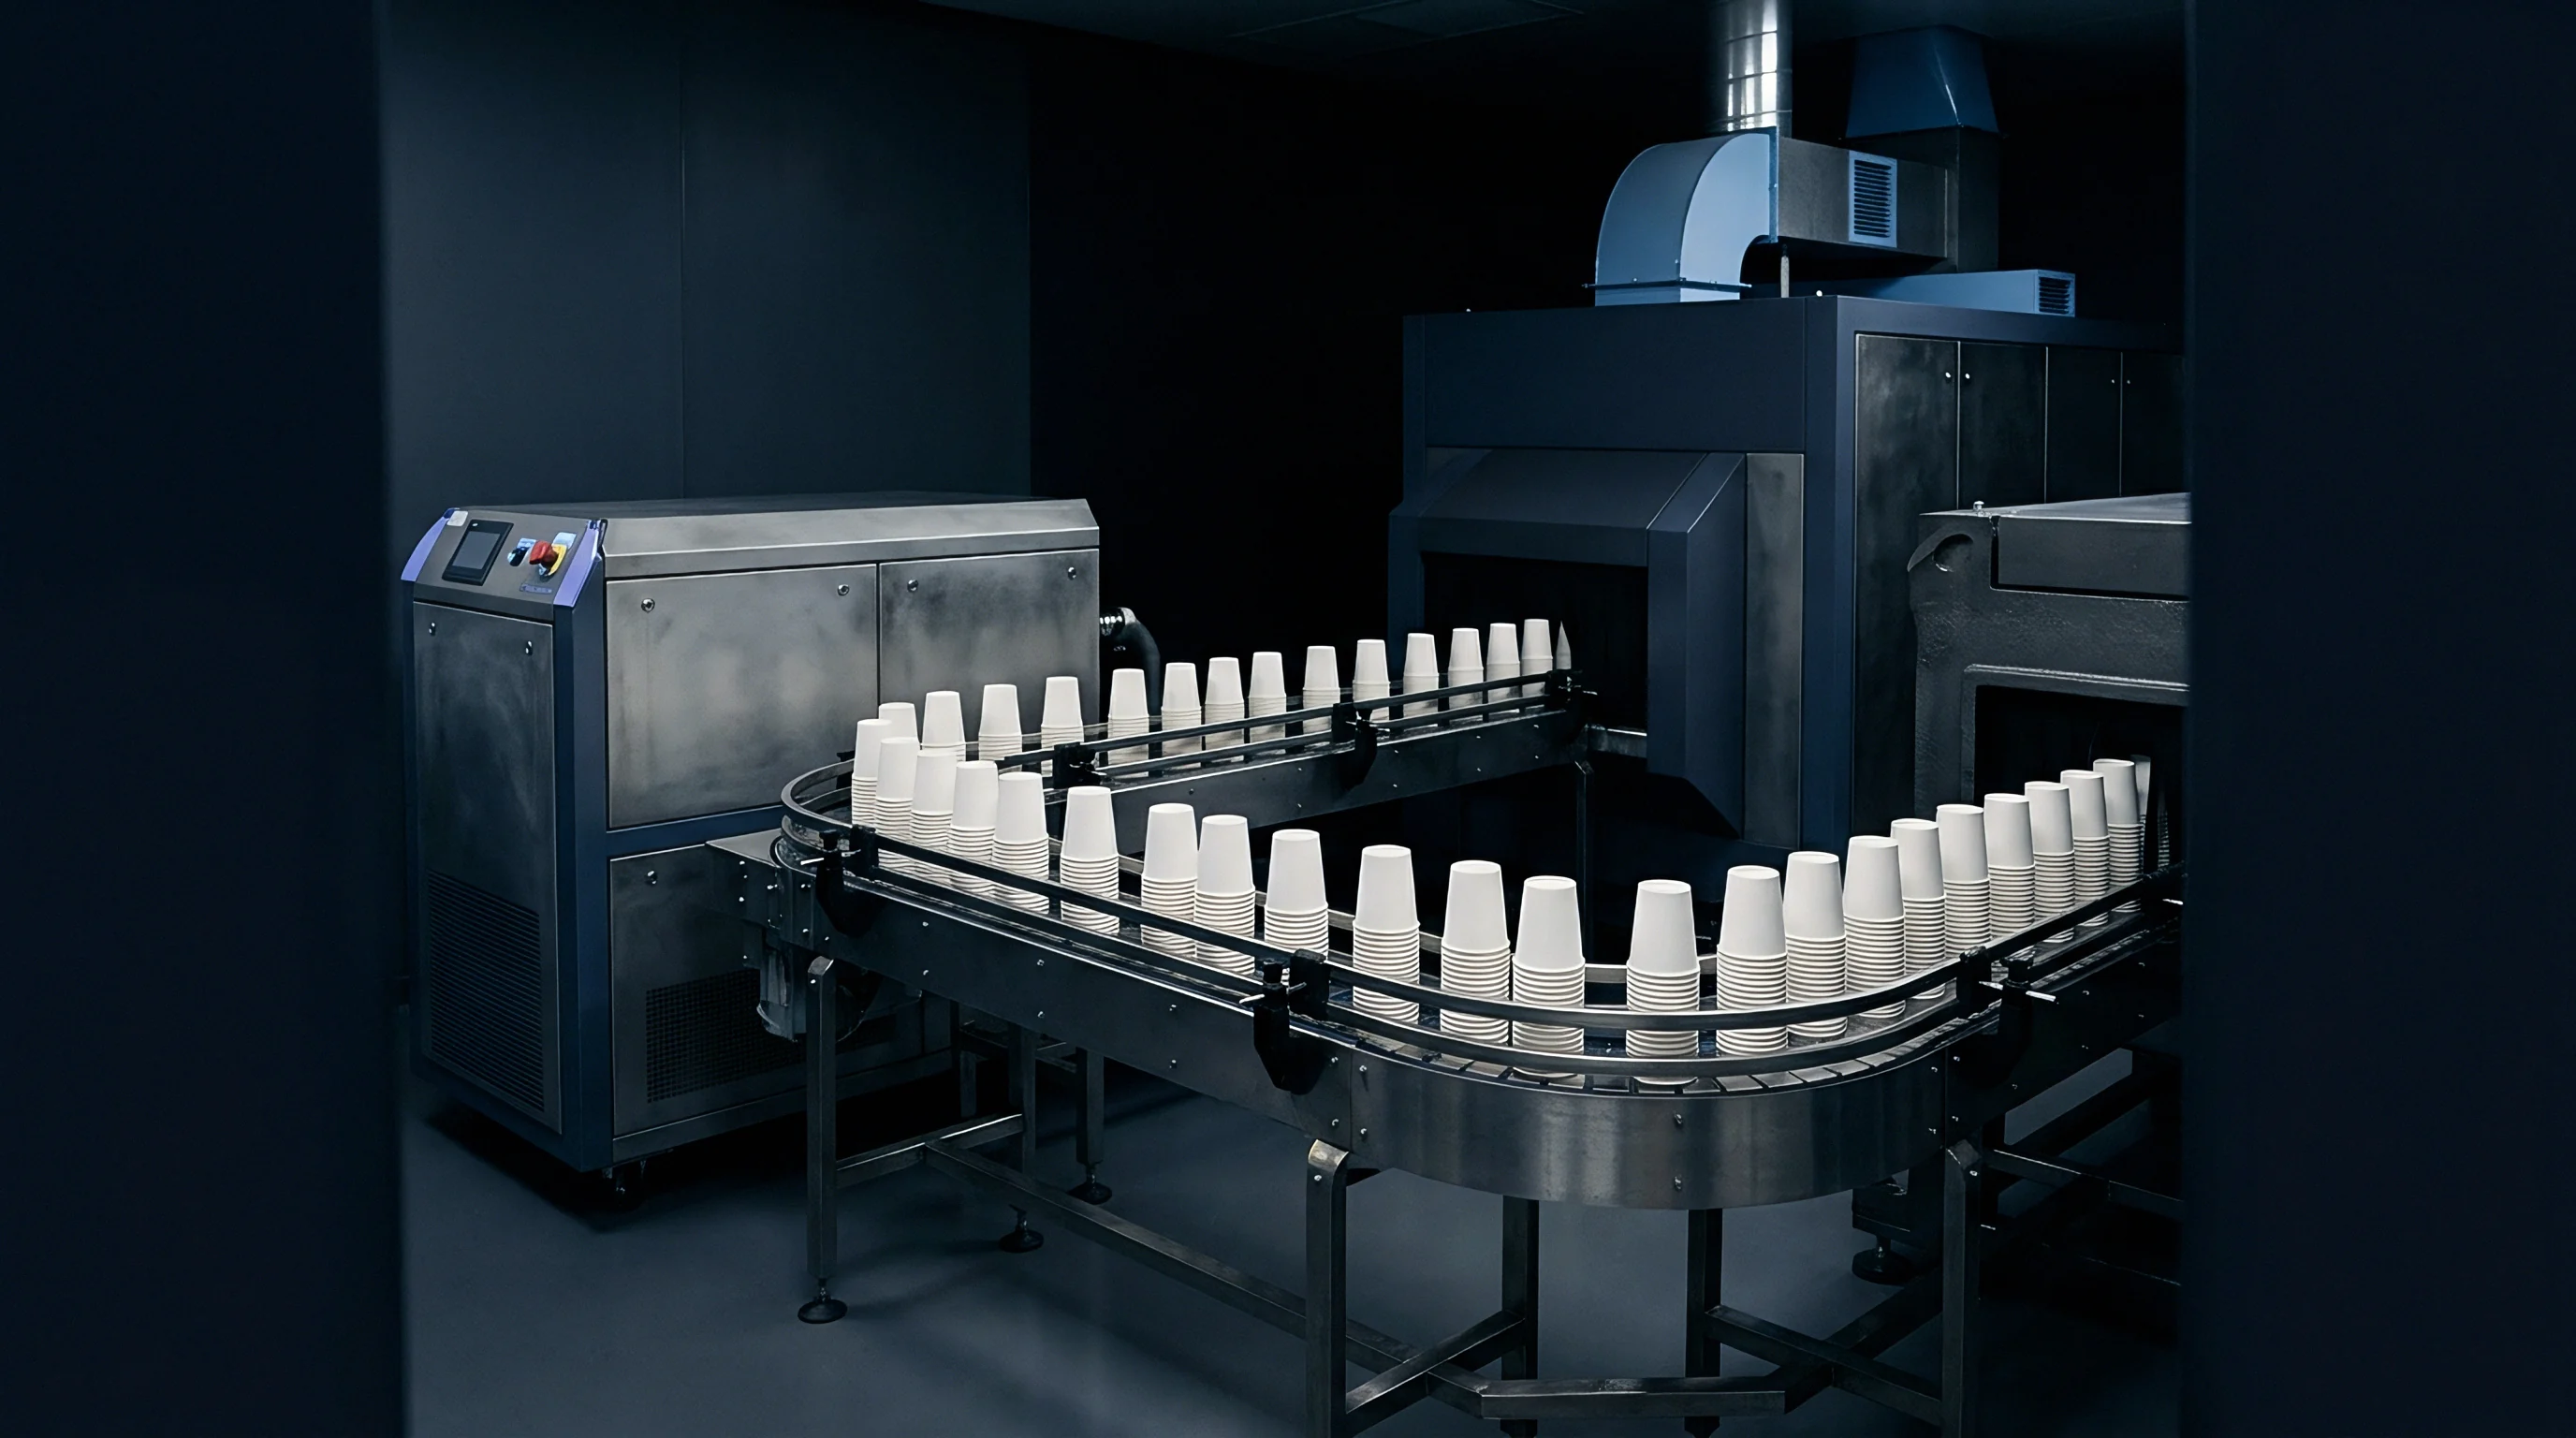
Optics
Chromatic confocal sensor heads isolate wavelength spectral shifts to measure vertical displacement without physical contact. Dispersive lens systems within the optical head focus different light wavelengths at precise spatial focal planes along the optical axis. Reflected light from the paper surface returns through a calibrated pinhole spectrometer, mapping specific wavelengths directly to absolute surface height.
This chromatic mapping technique achieves sub-micron z-axis resolution across steep crease slopes, where traditional laser triangulation sensors encounter shadowing effects.
Focus variation metrology presents a distinct non-contact approach by coupling optics of low depth-of-field with vertical mechanical scanning. Image sharpness algorithms determine focal height for individual camera pixels across adjacent spatial regions. High-gloss UV lacquers and cold foil stampings present measurement challenges for focus variation systems: specular reflection from metallic foils saturates digital image sensors, generating artificial noise spikes along score shoulders.
Polarization filters and dynamic illumination control reduce sensor saturation, enabling true elevation extraction on highly reflective packaging finishes.
- Specular Glare Blindness Sensor saturation across metallic foil boundaries creates false elevation voids along the score ridge.
- Lateral Resolution Decay Spatial sampling step sizes exceeding 2 microns fail to resolve sub-surface micro-cracks along the tensile shoulder.
- Refractive Index Distortion High-build clear varnishes alter light propagation speed, bending returned focal points and underreporting actual coating thickness.
- Vibration Artifacts Unisolated bench vibrations during vertical z-axis sweeps introduce artificial high-frequency noise into surface elevation metrics.
Evaluating surface elevation variance requires selecting parameters suited to spatial topography rather than single line profiles. Areal surface roughness parameter Sa calculates the arithmetic mean height over the complete score area, while parameter Sz captures the maximum peak-to-valley distance within the defined measurement area. Because steep wall angles scatter light rays, measuring score line variance with chromatic confocal optics requires numerical apertures above 0.50 to capture scattered rays returning from 40-degree crease slopes.
Signal loss along steep crease walls stems from either substrate absorbency or limited sensor numerical aperture.

Ridge
The raised bead forming on the reverse side of a creased paperboard sheet establishes the mechanical pivot during 90-degree folding operations. Compression from the male creasing rule forces paperboard layers into the female matrix channel, generating internal shear stress. Symmetrical bead geometry yields uniform folding resistance.
Platen die-cutting equipment exhibits dynamic deflection across wide sheet footprints, dropping impression pressure near the center of wide platen beds and altering crease bead height across side-by-side carton blanks on a single press sheet.
Quantifying local elevation variance along the crease track isolates mechanical tooling drift from paperboard caliper inconsistency. Consider a worked example on a flatbed die cutter running a 40,000-sheet order of 450-micron folding boxboard at 6,500 sheets per hour. Tooling setup specifies a 0.71 mm steel creasing rule working into a 1.4 mm matrix groove.
Initial production sheets show a mean crease bead height of 185 microns with an elevation variance Sa of 1.8 microns along a 200 mm score segment. By sheet 25,000, matrix groove wear and channel adhesive creep reduce average bead height to 142 microns while elevation variance Sa rises to 5.4 microns. The 43-micron reduction in average bead elevation reduces internal ply delamination depth by 23 percent.
This structural change increases carton folding force from 120 mN to 195 mN, exceeding the 160 mN operational threshold set for automatic side-seam folder-gluer operations. Adjusting die impression pressure mid-run without replacing worn matrix channels fails to restore bead symmetry, as paper memory shifts the score centerline by up to 35 microns.
Standard specification ISO 8791 surface roughness testing fails to capture localized elevation gradients within creased score channels.
Evaluating the elevation profile across the transverse axis of the crease ridge reveals structural eccentricity. Asymmetric creasing rules generate unequal shoulder slopes, forcing the folded carton panel off its intended fold line. High-resolution optical profiling records cross-sectional elevation profiles at 100-micron increments along the longitudinal score axis, tracking slope symmetry variations that cause skewed package geometry on retail shelves.
Crease bead height uniformity matters more for automated folding stability than absolute channel depth.


Fissure
Tensile stress concentrated on the outer score shoulder during 90-degree and 180-degree folding frequently ruptures surface mineral coatings and barrier films. Microscopic surface ruptures form long before visual cracking degrades brand graphics or package appearance. Non-contact optical profiling detects micro-fractures by identifying sharp, narrow drops in elevation along the tensile shoulder zone.
While linear profile roughness Ra averages distinct peak voids into flat line values and masks localized failures, areal spatial parameters Sa and Sz isolate micro-fissures by mapping peak-to-valley elevation drops across the entire shoulder area.

Is Surface Elevation Decay Predictive of Barrier Failure?
Moisture conditioning alters paperboard elasticity and cracking thresholds. Testing unconditioned paperboard under ambient room conditions yields false elevation profiles. Substrates tested according to ISO 187 at 23°C and 50 percent relative humidity maintain true moisture content, preventing premature brittleness during creasing trials.
Water-based dispersion coatings and extruded polyethylene layers stretch over score shoulders, hiding internal fiber separation until optical elevation mapping reveals sub-surface structural collapse.
- Condition paperboard test specimens at 23°C and 50 percent relative humidity according to ISO 187 prior to optical scanning.
- Mount the scored specimen flat using a vacuum hold-down stage to eliminate macro-scale board curvature distortion.
- Orient the score line parallel to the instrument y-axis with a spatial sampling pitch not exceeding 1.5 microns.
- Extract areal surface parameters Sa and Sz across a 2 mm by 10 mm bounding box centered on the tensile outer shoulder.
- Compare shoulder elevation profiles against baseline uncreased board data to calculate local elongation strain.
Surface elevation variance spikes immediately prior to visible coating rupture along outer score shoulders.
Polymer film lamination alters score shoulder elevation behavior during high-speed folding operations. Oriented polypropylene and polyester films exhibit higher tensile elongation at break than underlying mineral-coated paperboard layers. The underlying cellulose structure delaminates under creasing loads while the elastic plastic film bridges physical micro-cracks.
Optical profilometry records localized surface necking in the polymer film layer, registering local elevation depressions of 4 to 8 microns along the crease shoulder before film tearing occurs.
Whether sub-micron elevation variations along polymer barrier coatings reliably predict micro-channel moisture vapor transmission rate increases remains unsettled across paperboard testing laboratories.
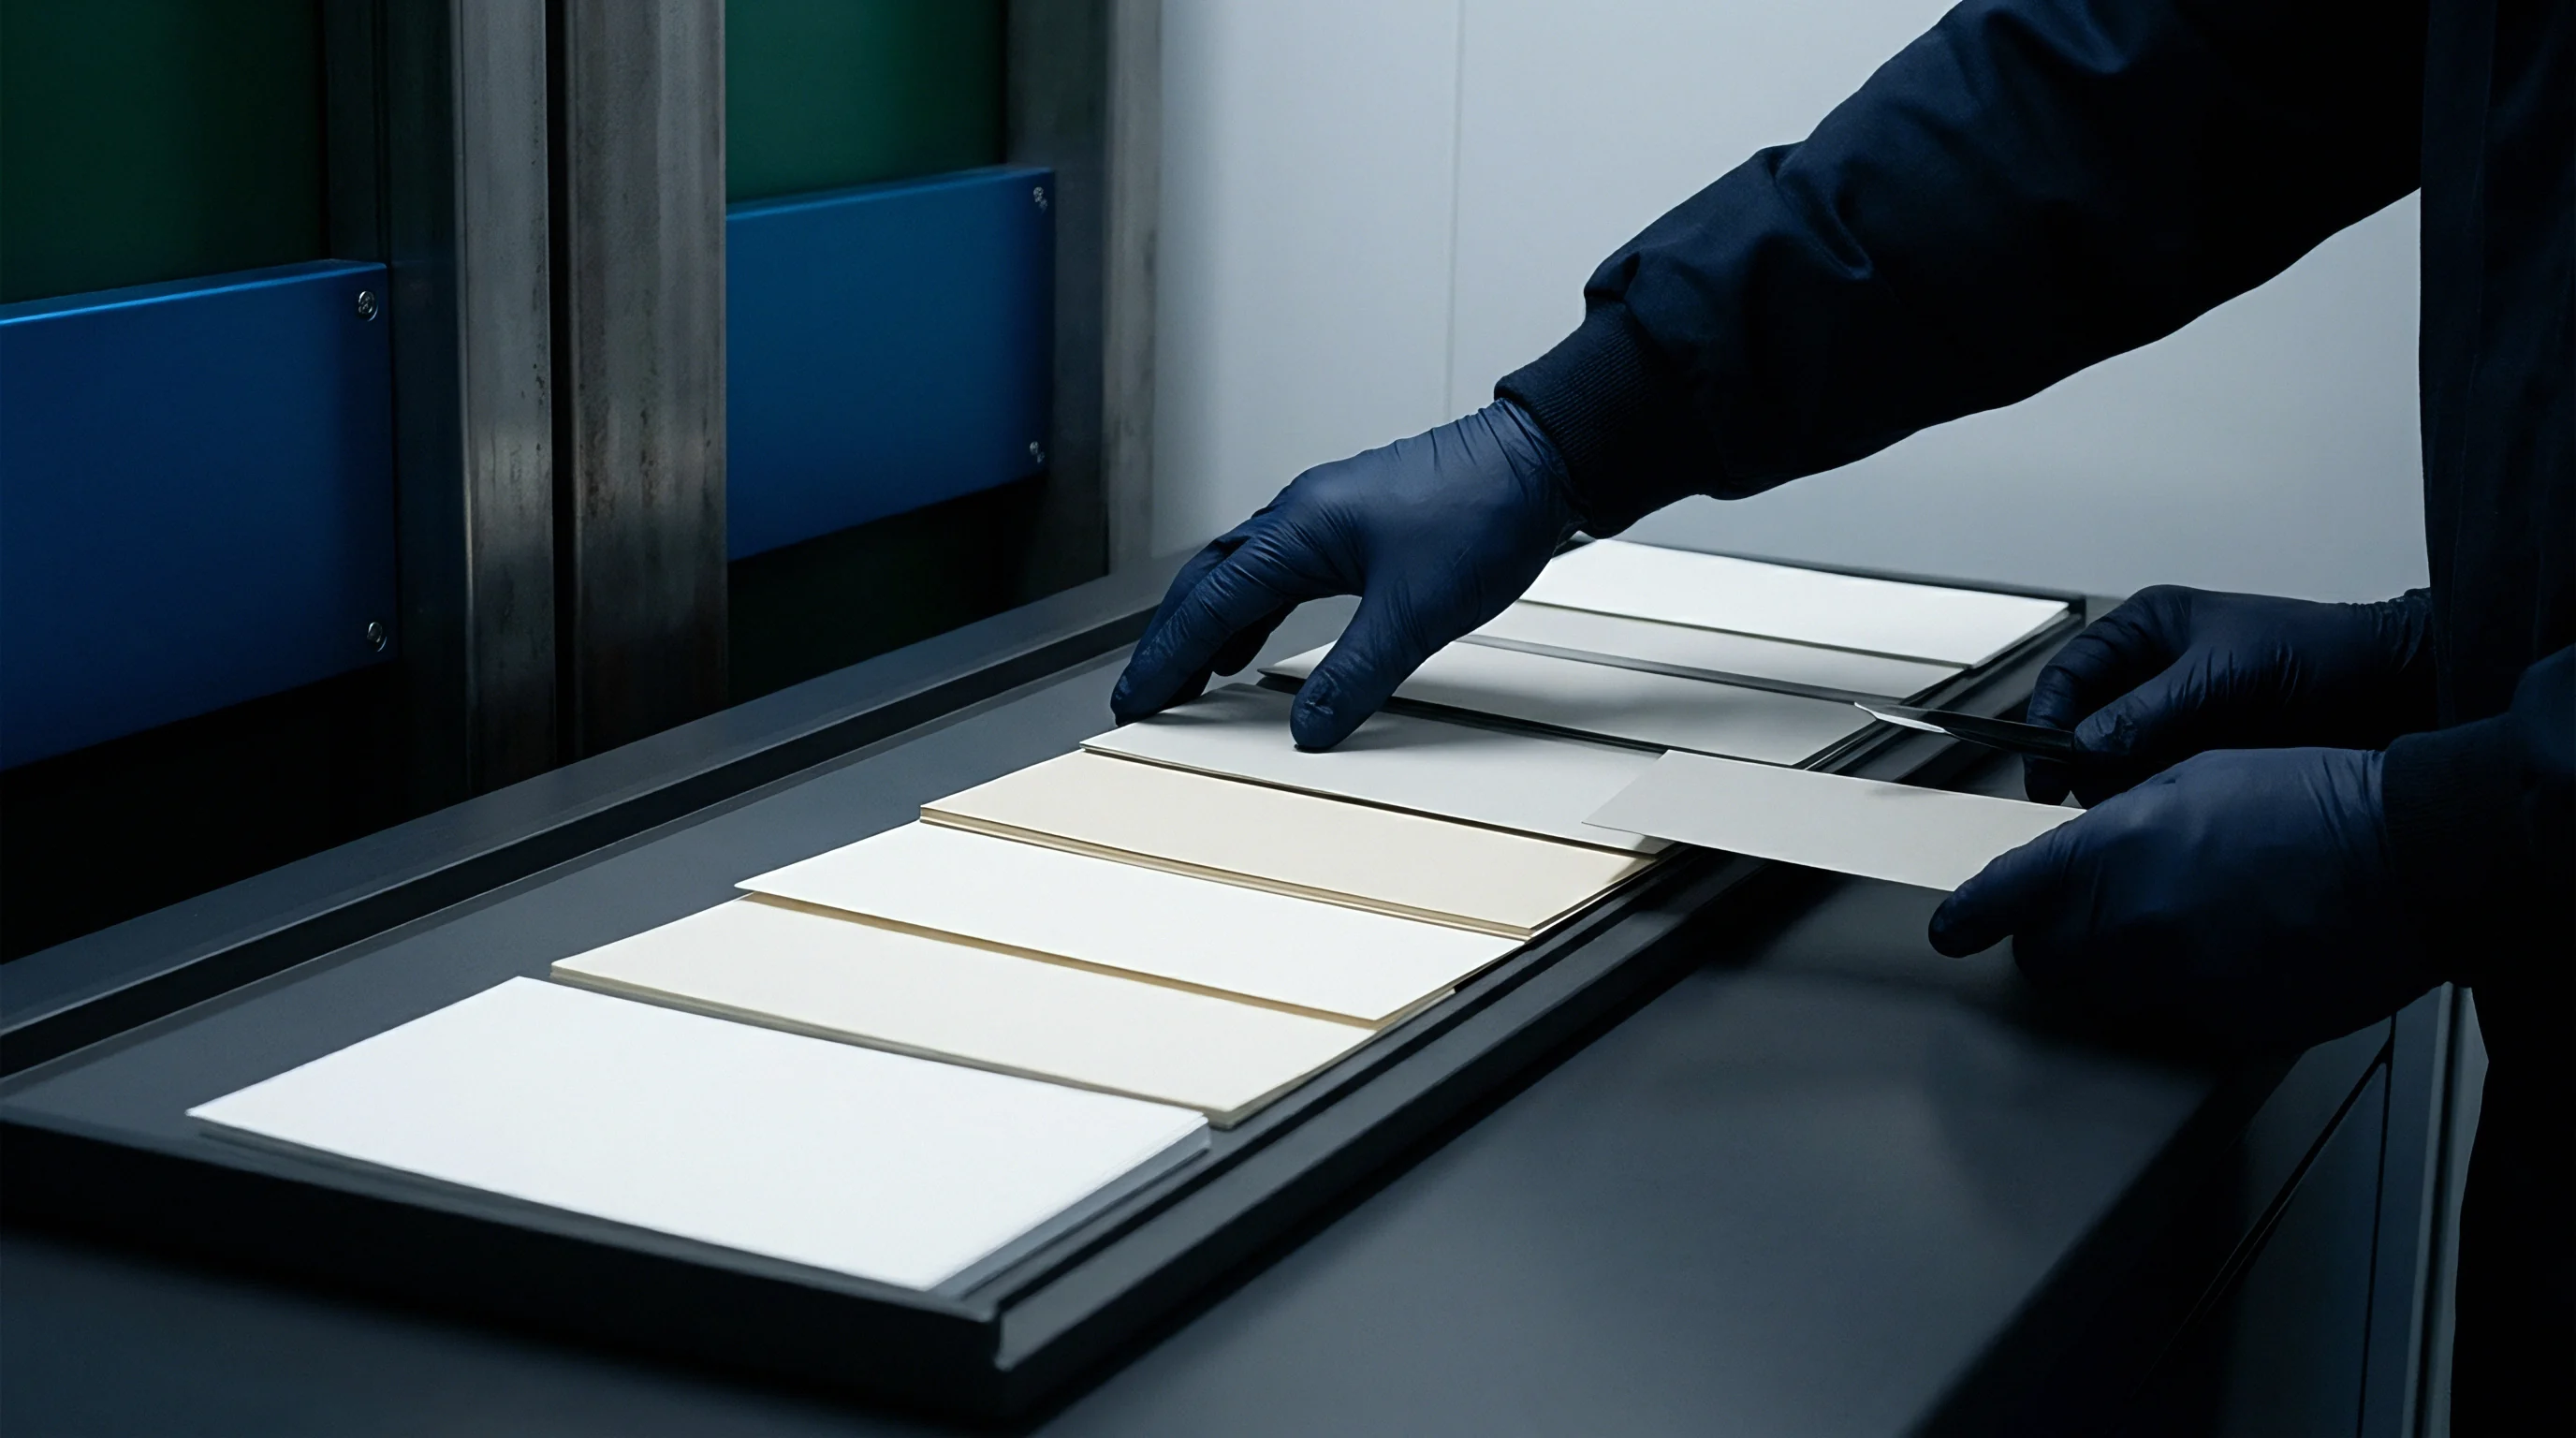
Yield
Tooling wear, machine speed variations, and board caliper fluctuations generate surface elevation variance across finished packaging runs. High-speed cartoning machines running at 450 packs per minute tolerate narrow variations in crease geometry before panel bowing causes line jams. Integrating optical profilometry metrics into tooling qualification protocols establishes verifiable pass criteria before running production volumes.
| Quality Management Method | Average Make-Ready Time (min) | Carton Gluer Jam Rate (per 100k) | Tooling Wear Detection Window | Waste Percentage Per Run |
|---|---|---|---|---|
| Manual Tactile & Visual Check | 45 | 14.2 | Post-Failure Rejection | 3.8% |
| Contact Stylus Depth Gauge | 30 | 6.5 | Late Stage Degradation | 2.1% |
| Inline Chromatic Optical Profilometry | 12 | 0.8 | Real-Time Variance Tracking | 0.4% |
Tooling setup optimization relies on direct measurement data rather than empirical press adjustments. Make-ready operators using optical surface maps identify specific matrix rule misalignment instantly, eliminating time-consuming carbon paper pull tests. Setting maximum spatial variance limits on score dockets prevents defective printed inventory from reaching automatic filling lines.
- Make-Ready Time Reduction Laser profilometry mapping eliminates manual carbon paper pull testing, cutting die setup time on folding carton presses.
- Substrate Scrap Reduction Early detection of score elevation variance prevents thousands of defective sheets from reaching high-speed folding gluers.
- Tooling Life Extension Identifying local matrix groove wear allows targeted counter-die replacement rather than premature scrapping of entire tooling plates.
- Supplier Docket Defense Objective profilometry data provides indisputable evidence when settling board delamination or score cracking disputes with converting mills.
Incorporating DIN 55437 score depth tolerance clauses into substrate purchasing dockets shifts financial responsibility for high-speed cartoner downtime back to the trade converter.