Non Contact Laser Profiling Verification Limits in High Speed Packaging Board Converting Lines
Non-contact laser profiling accuracy on board converting lines depends on blue laser selection, dynamic vibration damping, and proper spatial filter settings.


Beam
Optical triangulation on converting lines running at seven hundred meters per minute hits clear physical limits when inspecting heavy-caliper paperboard. Semiconductor laser diodes at four hundred five nanometers project narrow lines across moving webs of three hundred fifty gram per square meter folding boxboard to capture surface profiles in real time. Reflection behavior shifts fast across multi-layer board structures, where smooth double-pigment clay coatings sit over mechanical pulp cores.
Specular flash from high-gloss coatings oversaturates charge-coupled complementary metal-oxide-semiconductor sensors, while dark unbleached kraft layers absorb incident light, dropping signal-to-noise ratios below acceptable thresholds. Triangulated sensor geometry relies on fixed standoff distances, typically forty to eighty millimeters, with sub-micron vertical resolution. If web displacement moves beyond the focal depth of field, the beam defocuses, spreading the optical spot across multiple photodetector pixel columns and degrading spatial sampling precision from two micrometers down to fifteen micrometers.
Optical displacement sensors measure cross-directional profile features like score line depth, embossed pattern heights, and sheet caliper variations despite severe web instability. Line speeds over ten meters per second draw a boundary layer of air underneath the board. This aerodynamic lift causes flutter amplitudes above two hundred micrometers at frequencies between ten and eighty Hertz.
Mechanical web stabilization using vacuum drums or air-cushion bars keeps the sheet within the sensor’s depth of field; without it, optical triangulation algorithms interpret web vibration as dynamic thickness drift, triggering false failure signals in monitoring software.
A four hundred nanometer blue laser diode achieves a vertical measurement resolution of zero point eight micrometers under static laboratory conditions at twenty-three degrees Celsius and fifty percent relative humidity.
Integrating these sensors requires tight synchronization with high-resolution rotary optical encoders mounted directly on line web rollers. Phase jitter between the spatial encoder and the laser photodetector sampling clock causes spatial smearing along the machine direction. At high web velocity, a timing skew of five microseconds shifts the profile measurement point by three point five millimeters along the sheet.
Converting lines manufacturing folding cartons demand spatial registration within fifty micrometers to verify scoring and die-cutting accurately. Laser profiling systems compensate for machine-direction movement by linking trigger pulses to high-frequency pulse trains, though high-speed sampling introduces harmonic sensor noise during rapid acceleration.
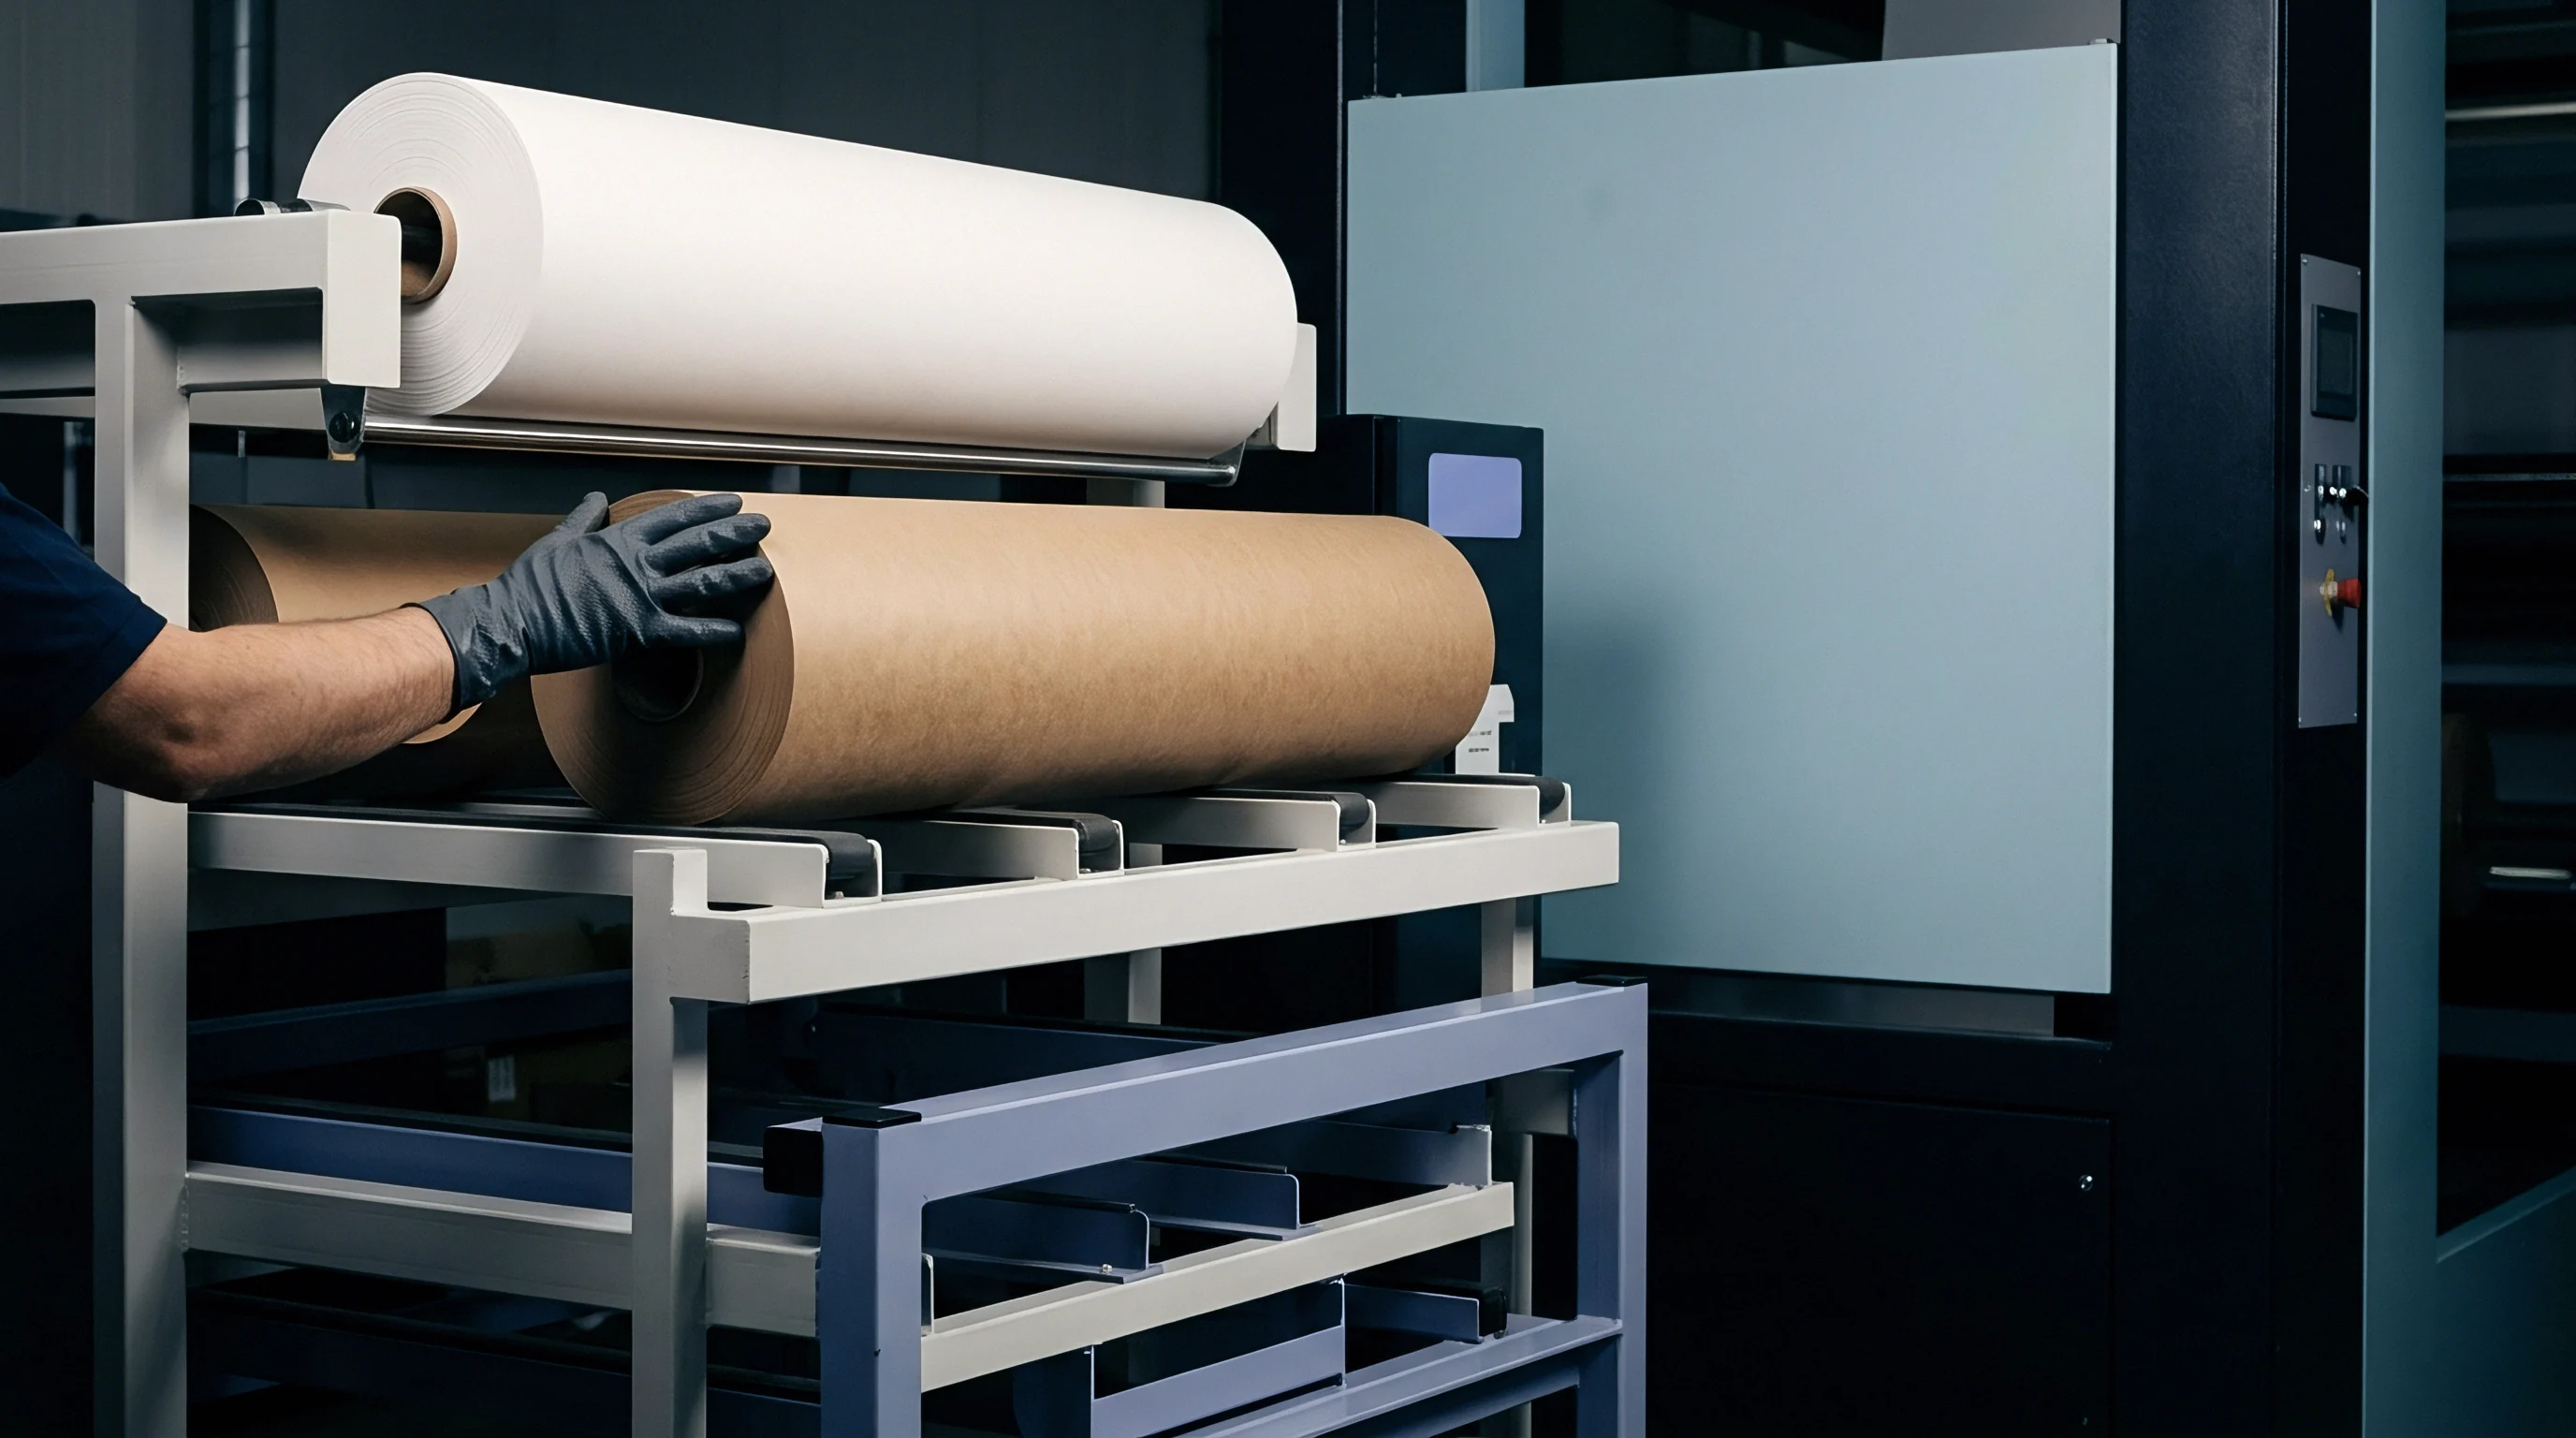
Wavelength Selection and Surface Absorption Mechanics
Red laser diodes emitting at six hundred fifty nanometers penetrate deep into porous unbleached recycled board. Light scattering within the fibrous network broadens the reflected spot, introducing phase uncertainty into triangulation calculations. By contrast, short-wavelength blue lasers at four hundred five nanometers reflect mainly off top pigment layers, minimizing internal scattering and producing sharper profile contours.
| Substrate Grade | Grammage (g/m²) | Laser Wavelength (nm) | Sampling Frequency (kHz) | Vertical Accuracy (µm) |
|---|---|---|---|---|
| Solid Bleached Sulfate (SBS) | 280 | 405 | 100 | ±1.2 |
| Folding Boxboard (FBB) | 350 | 405 | 80 | ±1.8 |
| Coated Recycled Board (CRB) | 400 | 650 | 50 | ±4.5 |
| Uncoated Kraft Liner | 300 | 650 | 40 | ±6.0 |
Coating formulation also alters light dispersion during high-speed scanning. Calcium carbonate coatings scatter incident light more uniformly than kaolin clay. During blade coating, kaolin clay particles align parallel to the sheet surface, creating anisotropic specular reflections that distort profile calculations on curved creases.
When uncalibrated red lasers misread specular glare on glossy packaging board as severe crease cracking, erroneous scrap costs reached twelve thousand Euros in a single shift.


Speckle
Coherent laser light hitting a rough substrate creates high-contrast interference patterns that corrupt elevation calculations. Mutual interference among backscattered light waves produces intensity fluctuations across the sensor array, hiding fine surface details. High-speed packaging board shows surface roughness values from one point two to five point zero micrometers under Parker Print-Surf testing at ten kilopascals clamping pressure.
Micro-variations in fiber distribution act as phase diffusers, creating graininess that degrades profiling accuracy. Profilometry algorithms then interpret these intensity peaks as physical displacement, adding artificial surface roughness values up to eight micrometers above baseline caliper measurements.
Polarization filtering helps control diffuse speckle noise during dynamic scans. Sensors fitted with linear polarizing filters isolate backscattered light matching the incident beam’s orientation, stripping out cross-polarized rays reflected from subsurface fibers. Multi-wavelength projection also helps by superimposing non-interfering reflection channels.
Dual-diode illumination setups project overlapping blue and green beams onto the exact same web coordinates, using optical averaging to smooth interference peaks without washing out high-frequency elevation data.

Optical Reduction Algorithms and Spatial Filtering
Digital signal processing filters help clean up optical interference in real-time inspection architectures. Finite impulse response spatial filters sweep profile datasets along cross-directional lines to strip away high-frequency intensity spikes. Averaging over small sample windows reduces measurement variance across coarse recycled substrates, though excessive filtering blurs sharp crease boundaries and score edges.
- Spatial Median Filtering suppresses isolated speckle intensity spikes while preserving steep profile edges at box scores.
- Adaptive Wavelet Thresholding separates true surface roughness from optical interference patterns across changing web speeds.
- Polarized Image Accumulation combines orthogonal polarization channels to eliminate noise from internal fiber scattering.
- Dynamic Exposure Integration adjusts camera shutter speed automatically to prevent pixel saturation on clay-coated board surfaces.
Substrate speed changes speckle behavior during inline measurement. At line speeds under two hundred meters per minute, stationary speckle patterns persist across sequential sensor exposures, causing repetitive elevation errors. Above six hundred meters per minute, web velocity decorrelates speckle patterns between frames.
This higher speed allows temporal image averaging to smooth out interference, provided exposure times stay under ten microseconds to prevent motion blur across the sheet.
Standard ISO 25178 defines non-contact optical surface texture metrics, requiring specific spatial filter cut-offs to separate structural profile height from optical measurement artifacts.
Moisture variations in the substrate alter surface reflection during high-speed runs. Board containing seven percent moisture absorbs more light at the surface than dry board at five percent moisture. These sudden absorption shifts change backscattered laser intensity, prompting automatic gain control circuits to adjust exposure times mid-scan.
Those rapid adjustments introduce transient height offset errors up to three micrometers along the board edge. Although sensors are frequently promoted as immune to surface color shifts, test runs showed five micrometer elevation drifts when transitioning from printed ink bands to raw coated board.

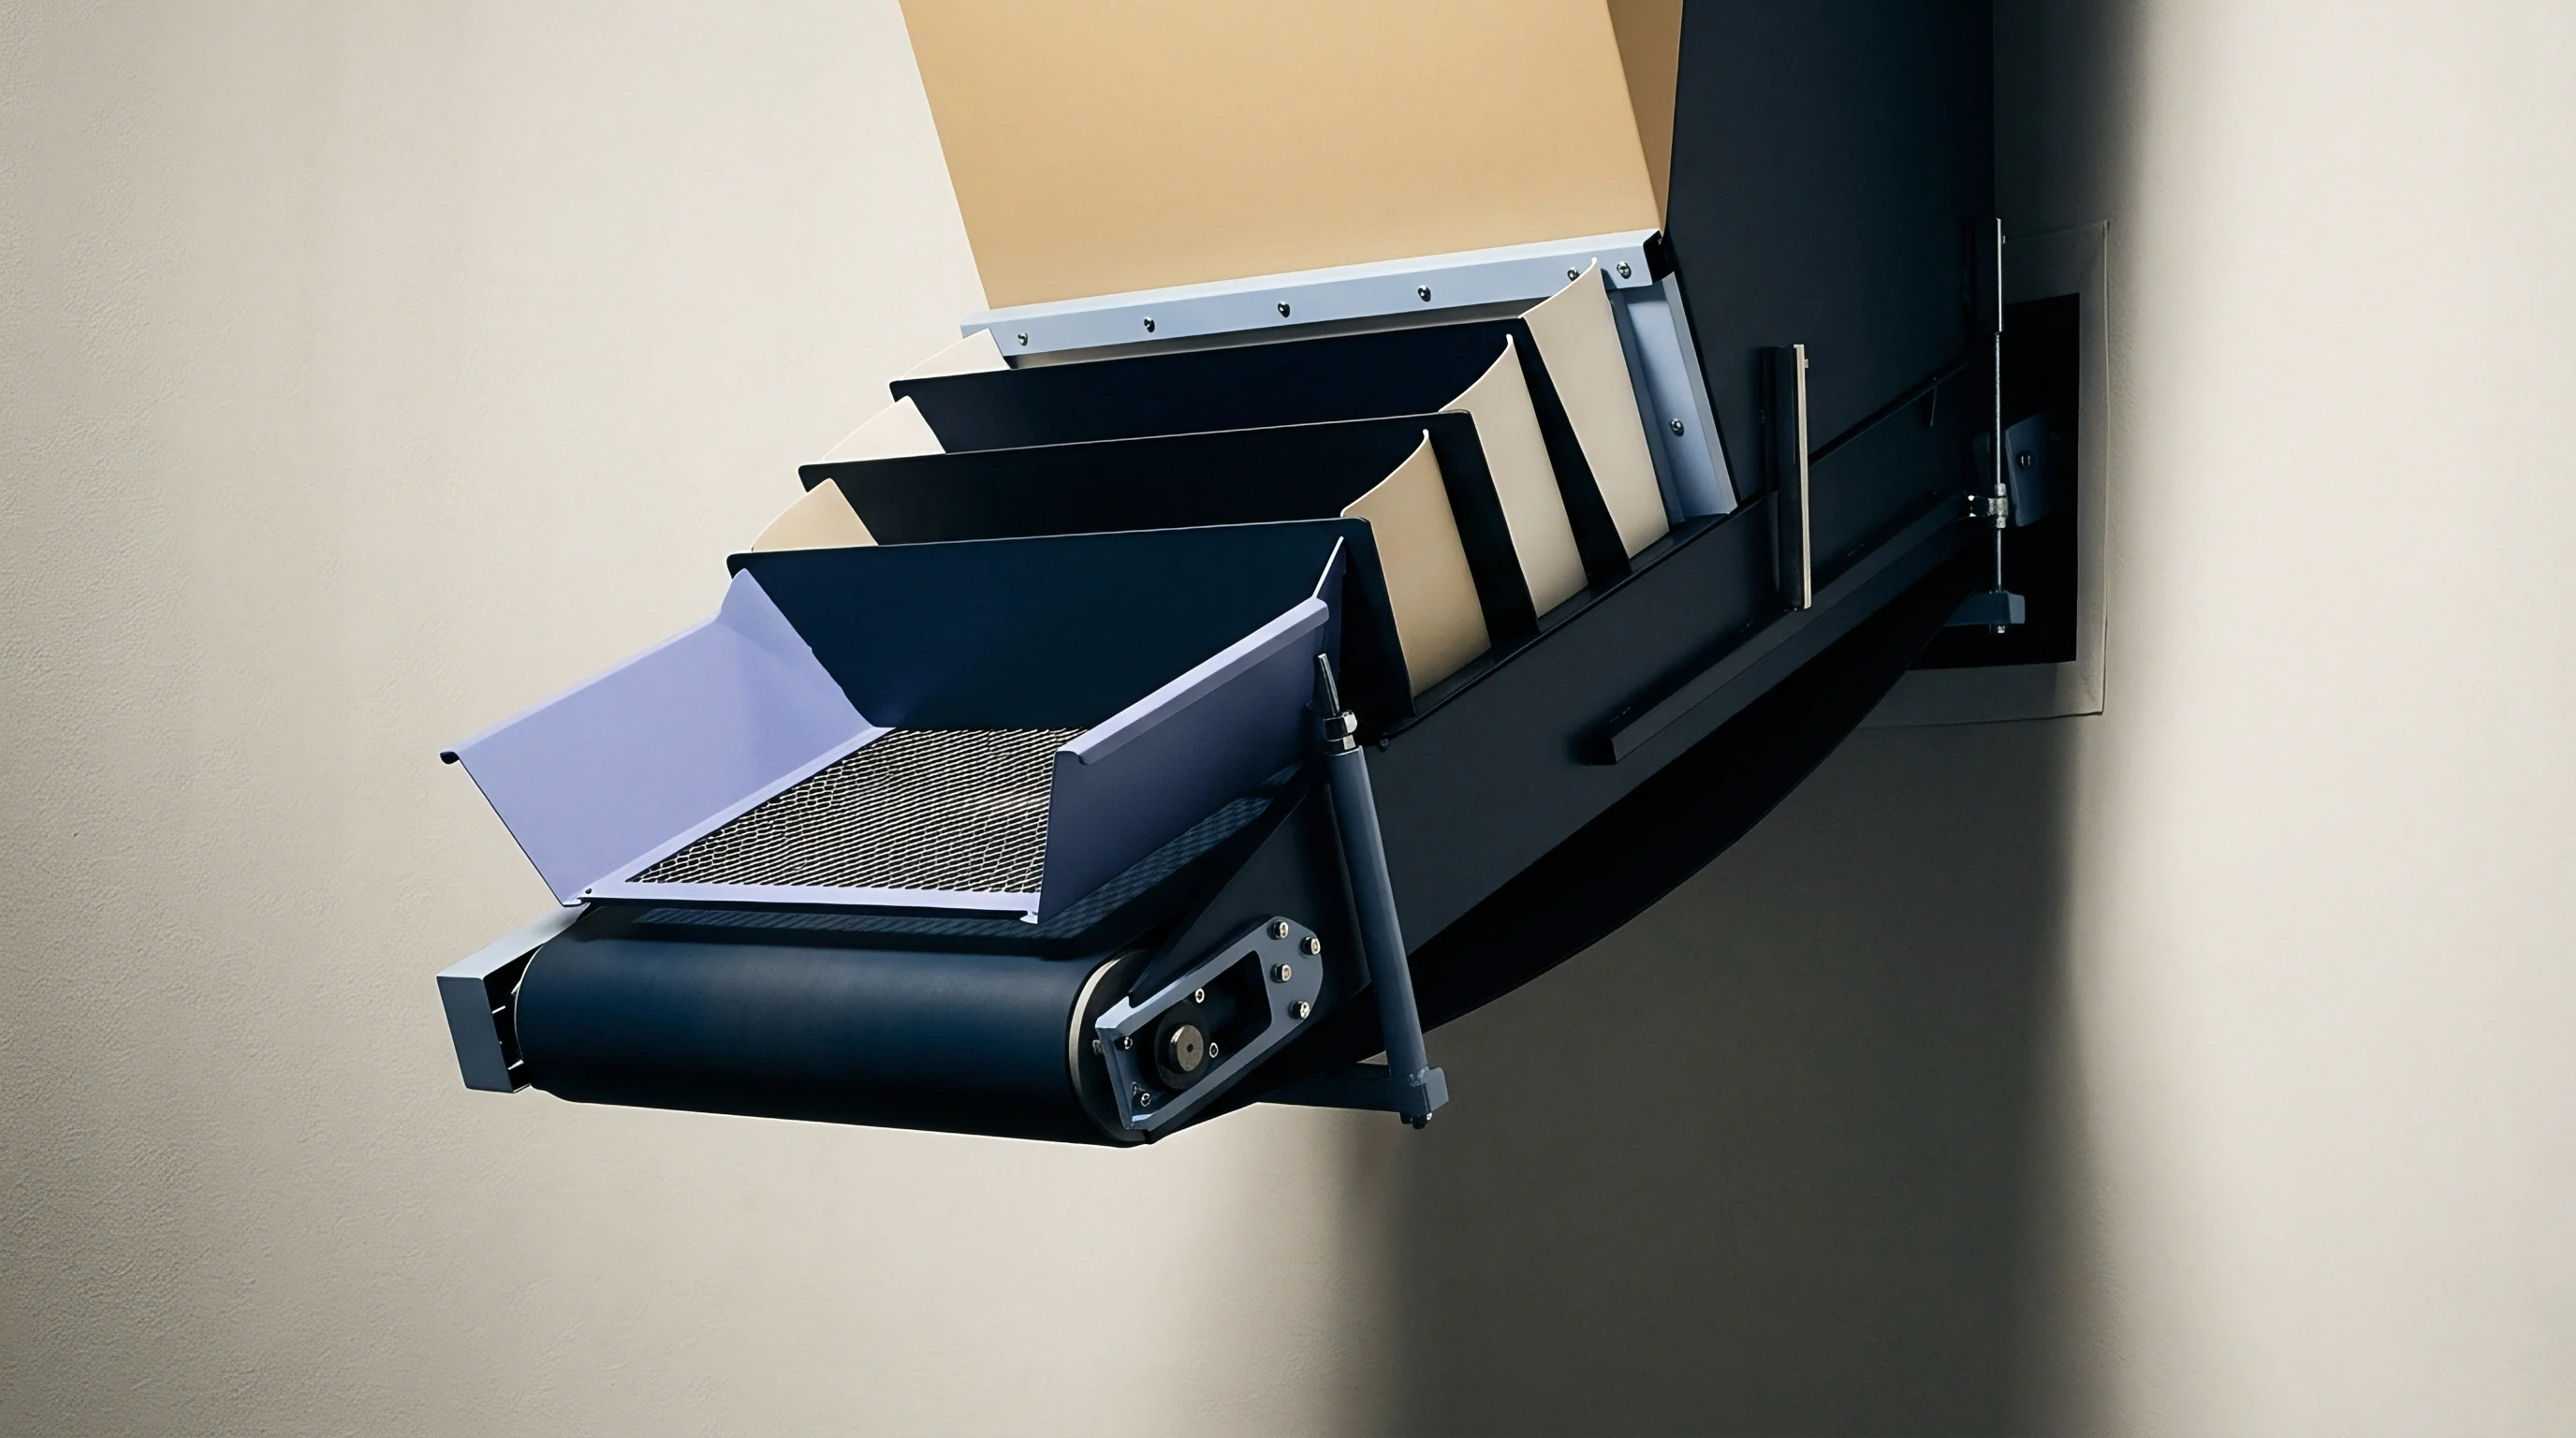
Jitter
Mechanical vibration in converting equipment distorts optical profile measurements across high-speed webs. Rotary die-cutters, creasing cylinders, and sheath cutters send mechanical harmonics between fifteen and five hundred Hertz through the machine frame. Sensors mounted on cantilevered supports experience displacement amplitudes over forty micrometers during fast runs.
This movement between the laser head and the passing sheet introduces elevation errors that mask true caliper variations and score line depths.
High-speed lines rely on isolated mounting frames and active vibration compensation. Accelerometers attached directly to sensor heads detect instantaneous movement across three axes, allowing compensation algorithms to calculate head motion in real time and subtract acceleration-derived displacement from profile measurements. Dual-sensor differential configurations eliminate vibration errors by placing matching optical heads directly opposite each other across the web.
These differential systems measure net thickness continuously, canceling out vertical web flutter and frame movement at the same time.
Differential laser displacement configurations cancel dynamic web flutter by calculating net substrate thickness from opposing sensor distance measurements.

Encoder Synchronization and Angular Motion Errors
High-resolution rotary encoders track sheet movement through the converting line. However, web slippage over pull rollers creates a phase lag between encoder pulses and actual web displacement. These timing errors stretch or compress measured surface profiles along the machine direction, distorting calculated crease geometry and flap fold angles.
- Mount high-resolution optical encoders directly to non-driven web tension rolls to minimize belt slip errors.
- Calibrate phase alignment between encoder index pulses and laser sensor frame triggers using precision test target boards.
- Configure real-time phase-locked loop tracking to smooth out minor encoder line chatter during speed changes.
- Validate spatial sampling integrity by cross-checking optical profile lengths against physical sample measurements taken offline.
Tension variations in the web cause transient thickness changes during high-speed processing. Paperboard under high machine-direction tension thins out through Poisson strain. A tension spike from two hundred to four hundred Newtons per meter decreases caliper by up to one point five percent on low-density folding boxboard.
Optical profiling systems record these thin regions accurately, but process control logic frequently misinterprets tension-induced necking as mill caliper defects. Technical supply contracts specifying board caliper tolerances mandate that thickness measurements be verified under static conditions governed by TAPPI T 411 at fifty-kilopascal pressure.


Margin
Inline laser profiling limits directly dictate profitability on high-capacity packaging lines. Converting lines producing five hundred thousand folding cartons per day run on tight material yields. Microscopic scoring defects, incomplete folds, or minor thickness variations trigger automatic ejection of finished blanks.
When optical profiling errors drive false defect detection, waste rates climb and unit costs rise. Setting tolerance bands too tight creates false reject loops that ruin line efficiency; setting them too loose lets non-conforming board reach high-speed cartoning machines, causing mechanical jams and shutdowns.
Economic optimization depends on setting statistical process control boundaries that match physical sensor capabilities. Laser measurement uncertainty needs to stay below ten percent of the specified board tolerance window. For instance, inspecting a crease depth specified at zero point three zero millimeters with a tolerance of plus or minus zero point zero two millimeters requires sensor accuracy within two micrometers.
If line vibration and speckle noise push uncertainty out to six micrometers, the process capability index drops below one point zero, driving false reject rates up to four percent of total production.
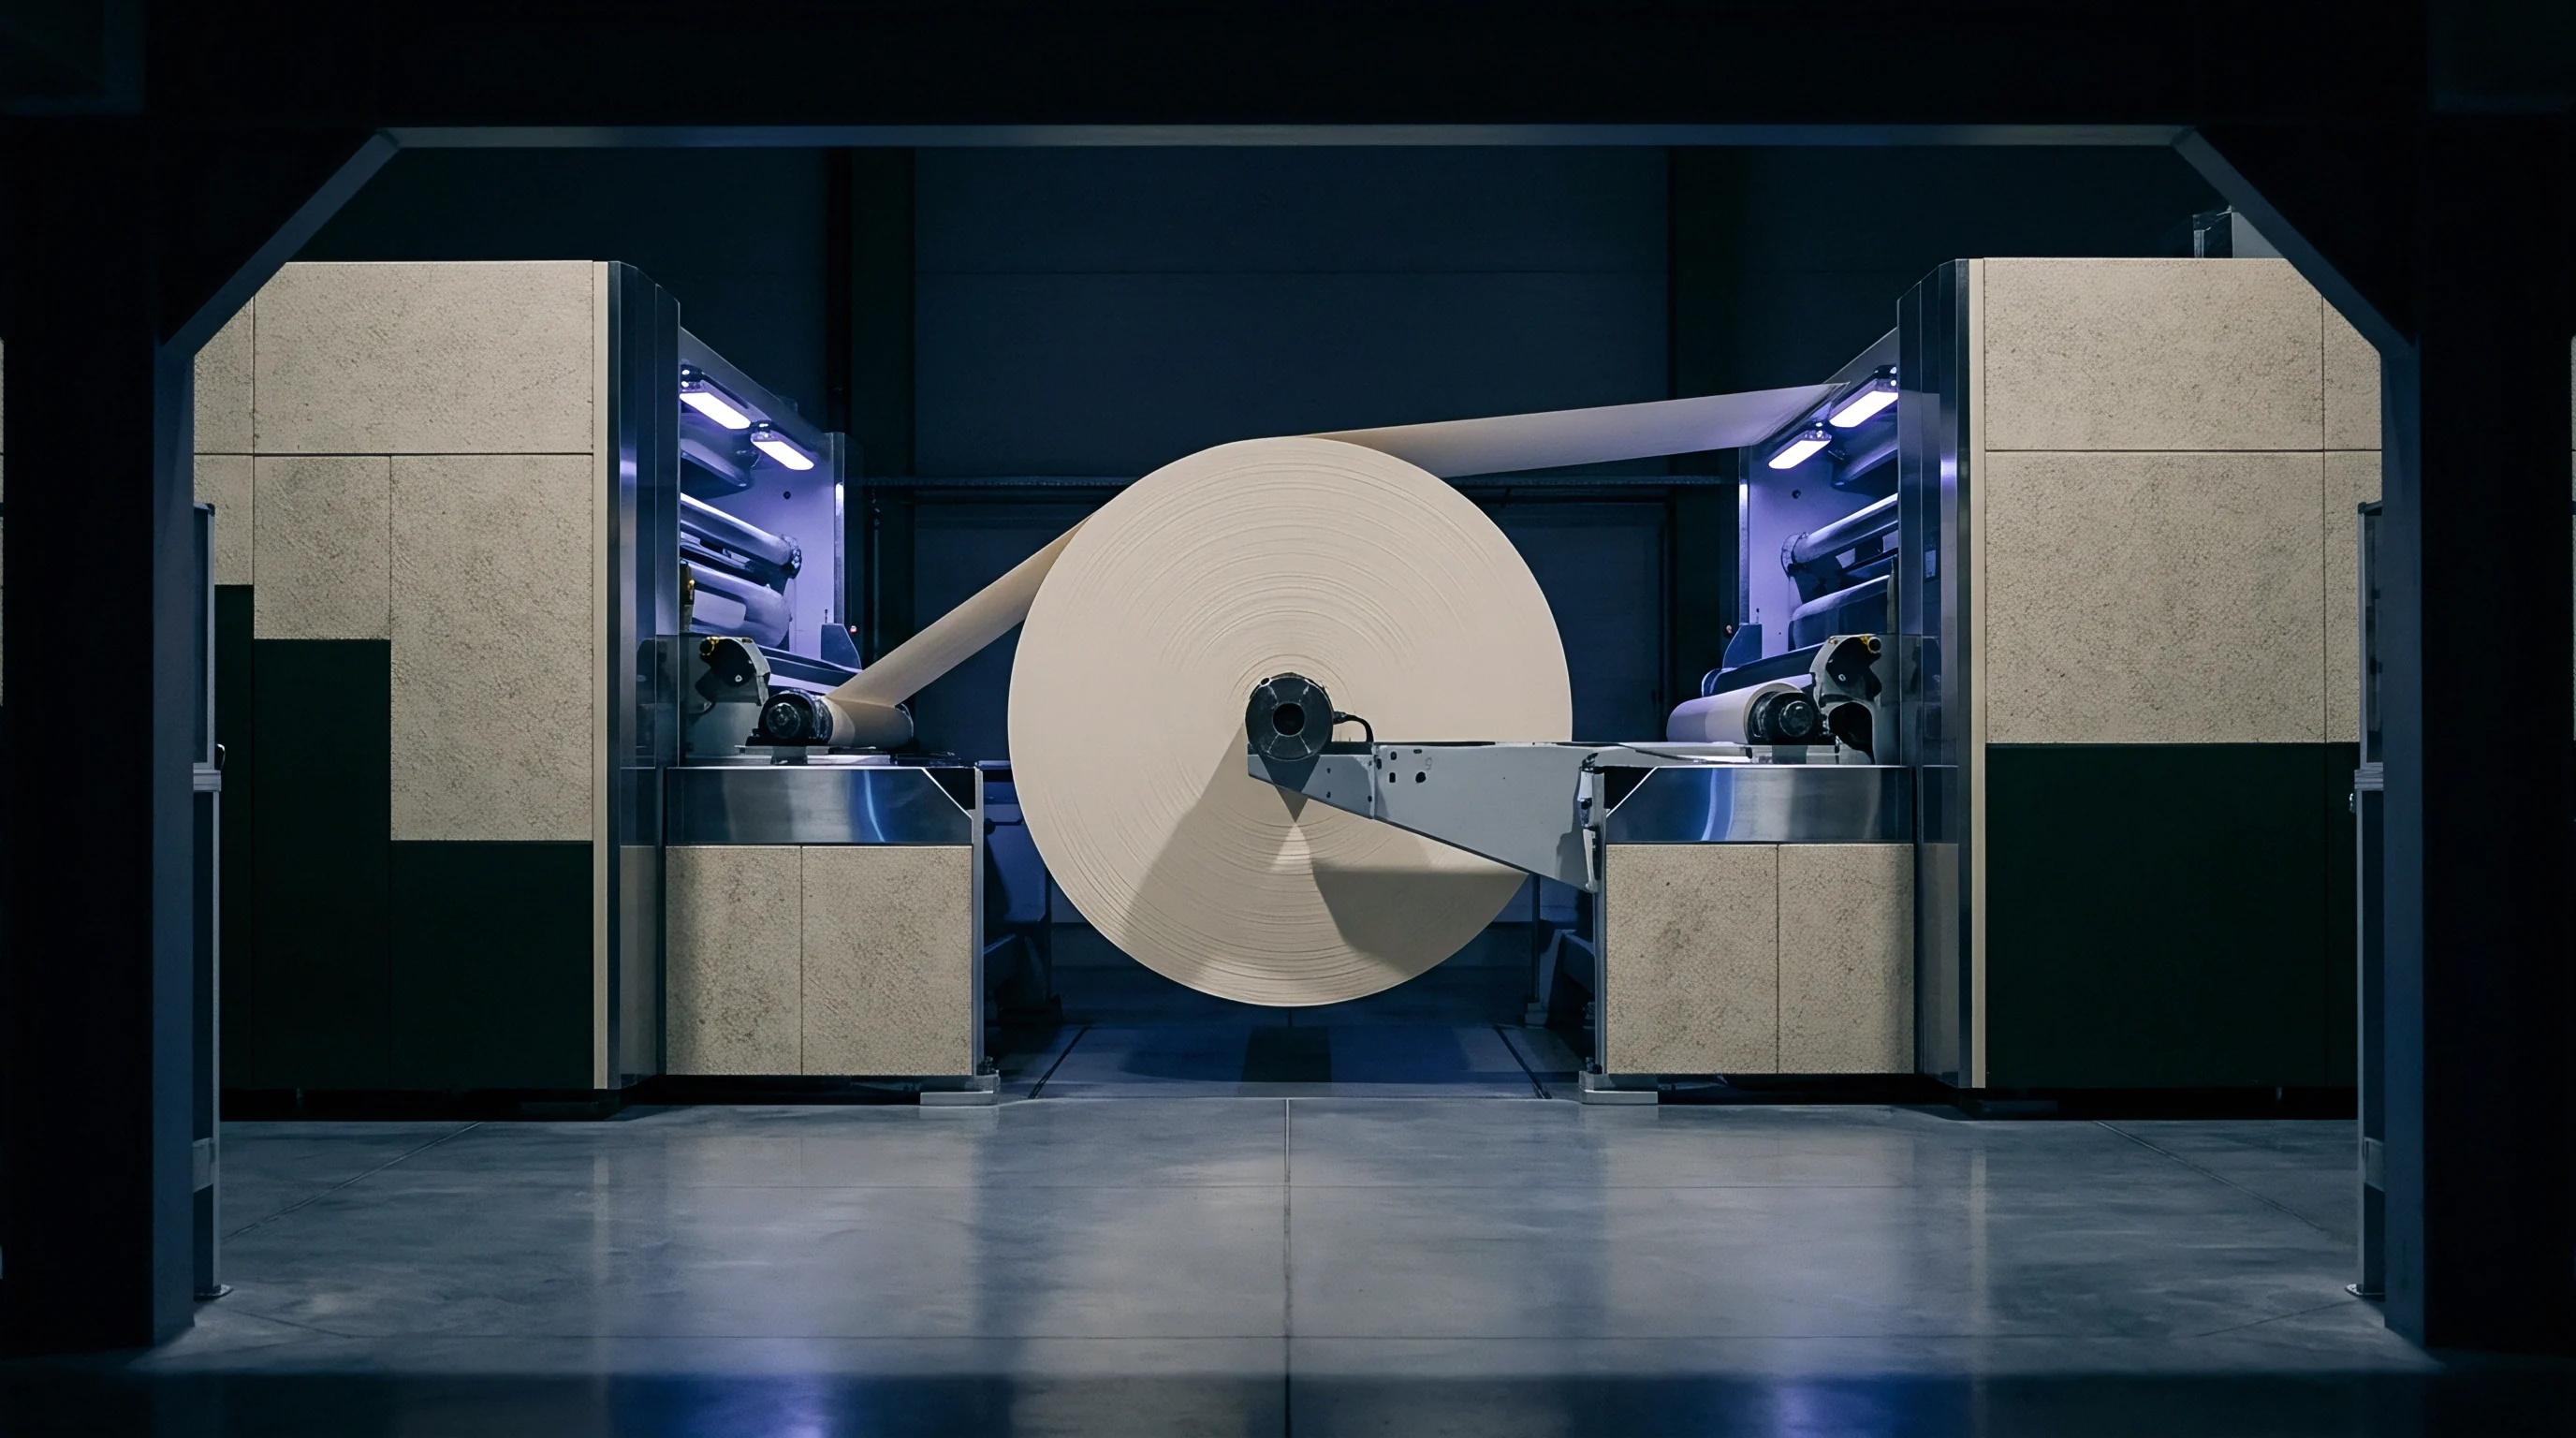
Waste Arithmetic and Conversion Cost Curves
Material costs dominate folding carton manufacturing, accounting for sixty-five percent of total unit cost. A converting line running three hundred fifty gram folding boxboard at seven hundred meters per minute processes roughly forty thousand Euros worth of board every hour. Substrate spoilage from false defect calls cuts straight into operating profit.
| Measurement Uncertainty (µm) | False Reject Rate (%) | Monthly Waste Tonnage (t) | Direct Material Loss (€) | Net Line Efficiency (%) |
|---|---|---|---|---|
| ±1.5 | 0.12 | 4.2 | 5,880 | 98.5 |
| ±3.0 | 0.45 | 15.8 | 22,120 | 97.2 |
| ±6.0 | 1.80 | 63.0 | 88,200 | 94.1 |
| ±10.0 | 4.20 | 147.0 | 205,800 | 89.8 |
High line speeds turn minor measurement errors into significant financial losses. Lowering measurement uncertainty from six micrometers down to one point five micrometers saves over eighty thousand Euros per month on high-speed boxboard lines. Advanced non-contact inspection systems demand substantial upfront capital, but short payback periods justify the investment through waste reduction alone.
Switching substrates requires recalibrating inline laser parameters. Transitioning a line from virgin fiber solid bleached sulfate to coated recycled board alters sheet stiffness, surface roughness, and reflectance. Recycled boards show larger density fluctuations and localized thickness variations than virgin stock.
Lines must adjust profilometry rejection thresholds to account for inherent material variations under shifting ambient humidity without compromising finished box integrity.