Unbundled Energy Surcharge Pass through Allocation across Recycled Containerboard Mill Contracts
Unbundled containerboard energy surcharges require fixed baseline consumption caps and index hedging rules to prevent mill efficiency losses passing into board prices.
Heat
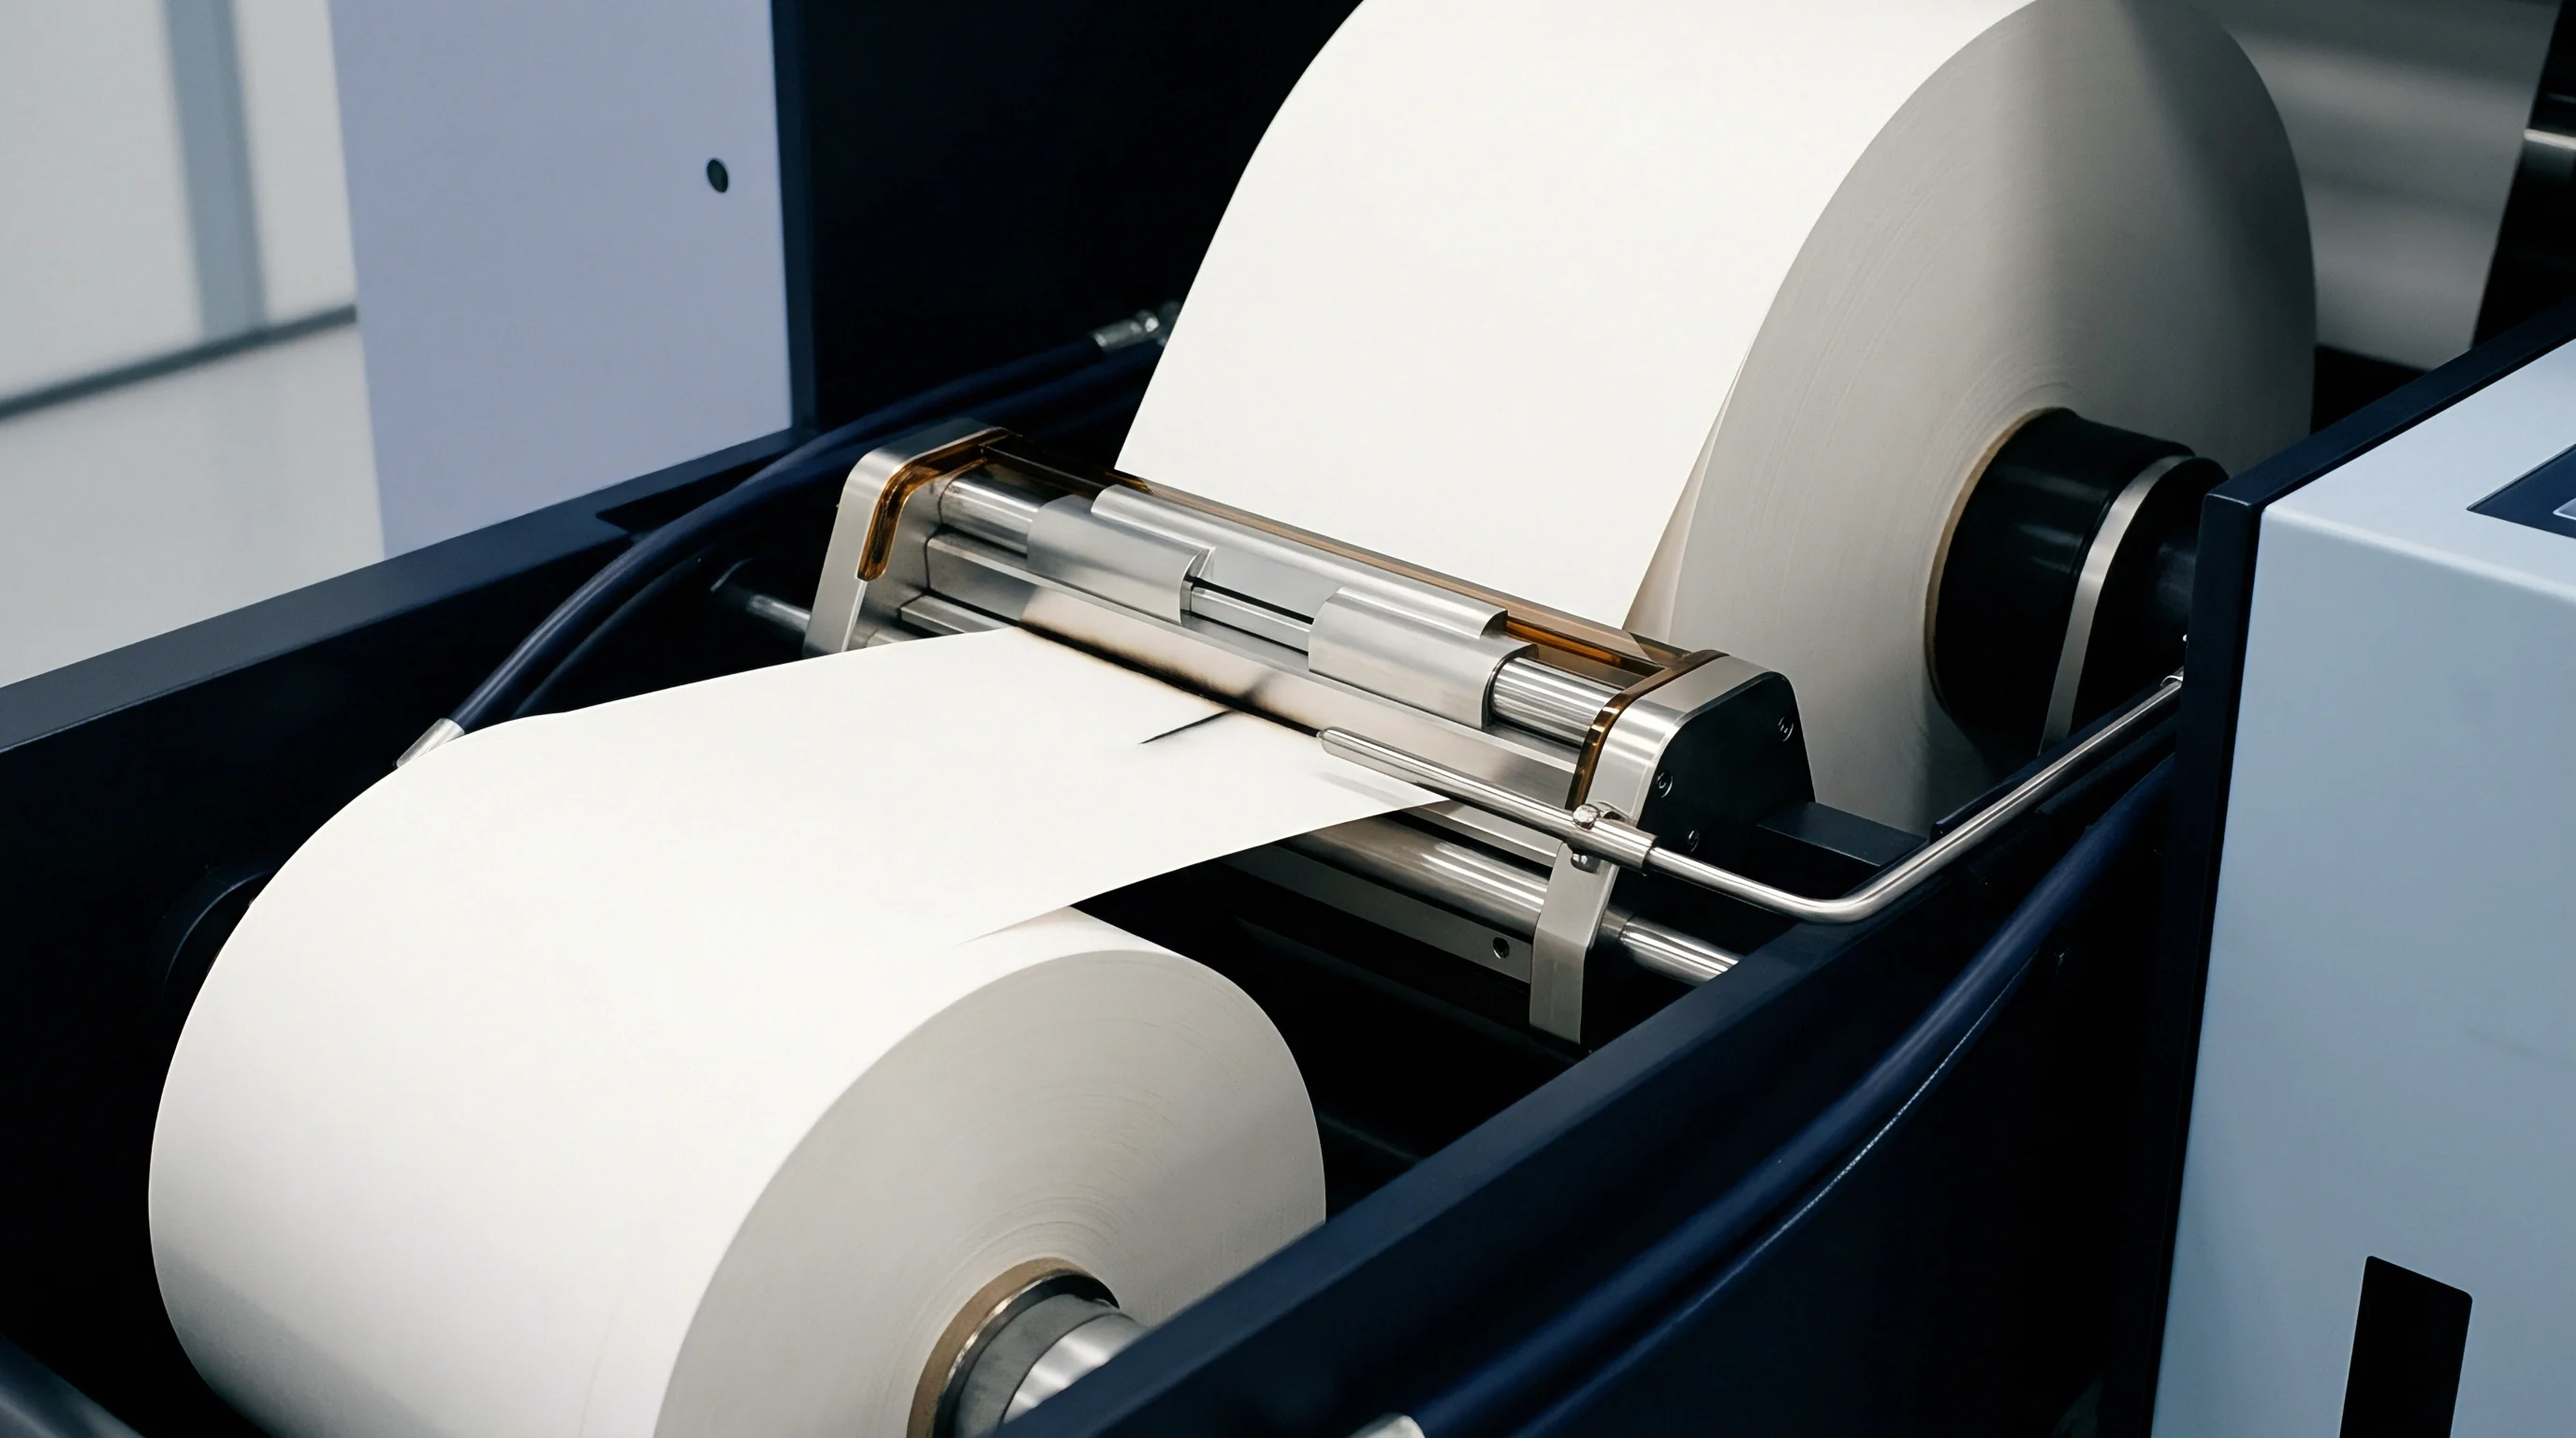
Drying the paper web consumes more variable operating cash than any other step in recycled containerboard manufacturing. Converting recovered fiber into linerboard or fluting medium demands continuous heat to pull moisture from the forming sheet. Historically, paper mills rolled steam generation and electrical expenses directly into a single fixed price per metric tonne.
But severe swings across natural gas markets and electric grids broke that convention. Most manufacturers have since unbundled their contracts, passing energy movements through as standalone surcharges tied to public market indexes. Evaluating these contracts requires looking straight into the underlying thermodynamics to separate genuine conversion requirements from passed-through mill inefficiencies.
A recycled containerboard mill operates on low-pressure steam for thermal demands and high-voltage electricity for mechanical drives. Steam represents 70 to 80 percent of overall energy input, tracked in gigajoules or megawatt-hour equivalents per metric tonne of finished board. That thermal energy heats the battery of cast-iron drying cylinders that evaporate moisture from the passing sheet.
Electricity runs the front end: high-density pulpers, screens, mechanical refiners, vacuum pumps, and machine drives. Standard mill thermal efficiency is calculated via enthalpy balances across the dryer hood, referenced against ISO 187 conditioning standards of 23 degrees Celsius and 50 percent relative humidity.
Thermal Energy Inputs in Web Dewatering
Mechanical press sections pull the wet web down to roughly 55 percent moisture before it reaches the steam cylinders. Mechanical water removal requires only a fraction of the energy that thermal evaporation demands. Evaporation has a hard thermodynamic floor: the sensible heat needed to bring the incoming water to boiling point, plus a latent heat of vaporization of around 2,260 kilojoules per kilogram.
For multi-cylinder dryer sections running 100 percent recycled testliner, steam consumption typically falls between 1.4 and 1.9 tonnes of steam per tonne of water evaporated, translating to 1.85 to 2.45 megawatt-hours of thermal energy per net metric tonne of finished board.
Basis weight shifts thermal requirements considerably. Lightweight grades like 90 to 110 grams per square metre fluting take more thermal energy per unit mass than 175 to 200 grams per square metre linerboard. Boundary air layers, web speed limits, and higher specific edge evaporation all degrade lightweight drying efficiency.
In practice, running a lightweight sheet on a high-speed machine can demand up to 15 percent more steam per tonne than producing heavyweight liner on that same machine at lower speed.
Recycled containerboard drying consumes 1.85 megawatt-hours of steam per metric tonne when sheet entry dryness equals 42 percent solids at 23 degrees Celsius ambient conditions.
Electrical Power Demand across Stock Preparation
Repulping and refining recovered paper draws heavy motor loads to separate fibers without cutting them down. A stock preparation line processing European OCC (Old Corrugated Containers) uses between 220 and 380 kilowatt-hours of power per metric tonne of accepted fiber. Double-disc refining accounts for most of that load, brushing the fiber walls to encourage swelling and inter-fiber bonding for burst strength.
Pushing refining too hard cuts the secondary fibers, produces fines, and slows drainage across the Fourdrinier wire.
Vacuum infrastructure and machine drives draw the rest of the electrical load. Liquid ring vacuum pumps on suction couch rolls and vacuum boxes draw 40 to 70 kilowatt-hours per metric tonne. Main drive arrays pull another 50 to 90 kilowatt-hours per tonne depending on trim width, machine speed, and mechanical drag.
Across a 100 percent recycled containerboard operation, total electrical draw ranges between 350 and 550 kilowatt-hours per net metric tonne, or 0.35 to 0.55 megawatt-hours per tonne.

Furnish Refining Effects on Dewatering Efficiency
Because recycled fibers degrade with each repulping cycle, the generated fines directly slow drainage on the forming table. Drainage resistance is measured in degrees Schopper-Riegler (°SR) under ISO 5267-1 or Canadian Standard Freeness (CSF) via TAPPI T227. When drainage slows, machine operators lower wet-end consistency, which carries excess water into the press and dryer sections.
The thermal penalty is steep: a single percentage point drop in sheet dryness leaving the press section increases steam demand in the dryer cylinders by roughly 4 to 5 percent per finished tonne.
Chemical wet-end additives further shift water retention and drying behavior. Cationic starches boost internal bond strength (z-direction tensile) without additional mechanical refining, but heavy chemical dosages tighten the sheet structure and alter evaporation under the hood. When pass-through formulas ignore furnish quality, drainage metrics, and press solids, mills are effectively allowed to transfer the operating costs of degraded raw materials directly onto the buyer.
| Containerboard Grade | Nominal Grammage (g/m²) | Stock Refining Power (kWh/t) | Dryer Steam Consumption (MWh/t) | Total Energy Intensity (MWh/t) | Press Dryness (% Solids) |
|---|---|---|---|---|---|
| Recycled Fluting (Medium) | 90 | 240 | 2.25 | 2.62 | 41.5 |
| Recycled Fluting (Medium) | 120 | 220 | 1.95 | 2.29 | 43.0 |
| Testliner 3 (Recycled) | 125 | 310 | 2.05 | 2.48 | 42.0 |
| Testliner 2 (Recycled) | 140 | 340 | 1.90 | 2.36 | 43.5 |
| Kraft Top Recycled Liner | 170 | 380 | 1.80 | 2.28 | 44.0 |
Dryer inefficiencies are often attributed to ambient seasonal humidity or low-grade OCC, though pass-through terms frequently bundle these operational variables into standard invoice adjustments.

Formula
An unbundled energy mechanism isolates baseline fuel and power consumption from the mill’s fixed converting margin, tying invoice adjustments directly to published energy indexes. Designing a fair, auditable formula requires four defined parameters: published reference fuel indexes, agreed baseline consumption caps, thermal conversion efficiencies, and the mathematical pass-through multipliers. If any parameter is vaguely defined, the surcharge mechanism can easily inflate mill margins under the guise of cost recovery.
The reference index dictates the volatility of the final board price. European agreements generally index natural gas against Title Transfer Facility (TTF) day-ahead or month-ahead settlement figures published by ICIS or Powernext (€/MWh). North American contracts rely on NYMEX Henry Hub natural gas futures ($/MMBtu).
Electrical components link to regional wholesale platforms, such as the EPEX SPOT day-ahead auction in Europe or regional ISO locational marginal pricing across North America.

Indexation Frameworks for Gas and Power
Published benchmark indexes serve as the baseline for variable adjustments. A contract must specify how values are sampled: calendar-month arithmetic averages, volume-weighted figures, or a single settlement day prior to shipping. Surcharges can track gas and electricity through separate line items or combine them into a single thermal-equivalent index.
Merging them converts power consumption into equivalent natural gas units via a fixed heat rate, which simplifies auditing.
Weighting coefficients reflect the operational split between gas and electricity per net tonne. A standard calculation for the energy surcharge (S) per metric tonne uses the formula:
S = Baseline_Gas × (Index_Gas_Current – Index_Gas_Base) + Baseline_Power × (Index_Power_Current – Index_Power_Base)
Here, Baseline_Gas represents the agreed gas allowance in MWh per metric tonne, Index_Gas_Current is the active monthly benchmark in €/MWh, and Index_Gas_Base is the fuel cost already baked into the baseline paper price. Baseline_Power and Index_Power apply the same calculation to electrical consumption. A contractual floor prevents negative surcharges unless both parties have agreed to a fully symmetric two-way mechanism.
Standard paperboard purchase contracts that tie unbundled energy surcharges to spot natural gas prices without fixed baseline efficiency caps expose buyers to mill boiler operational downtime.

Baseline Consumption Caps and Efficiency Floors
Contracts establish energy intensity allowances in gigajoules or megawatt-hours per net finished metric tonne. Suppliers tend to ask for elevated baseline caps to buffer internal process waste, while buyers require caps pegged to verified engineering benchmarks. Leaving baselines open or variable lets mills pass the costs of worn equipment, steam leaks, fouled boiler tubes, and unplanned machine shutdowns directly down the supply chain.
Setting fixed efficiency caps establishes maximum energy allowances per grade. A well-run 100 percent recycled mill operates within a thermal baseline cap of 2.00 MWh of gas and an electrical cap of 0.45 MWh per metric tonne. Omission of these fixed thresholds leaves converters paying for internal operational shortfalls.
Common structural flaws in energy surcharge formulas include:
- Gross Reel Calculation Bias occurs when mills apply surcharge rates to gross paper machine reel weight before slitting, charging buyers for trim waste retained by the mill for repulping.
- Double Index Inflation arises when base board prices increase alongside an unbundled surcharge without deducting the baseline energy cost embedded in the original base price.
- Unadjusted Efficiency Slippage allows thermal consumption baselines to float upward during mill start-ups, web breaks, or mechanical downtime, penalizing buyers for operational delays.
- Non-Thermal Fuel Inclusion applies natural gas index multipliers to biogenic waste fuel or biomass consumption that carries zero natural gas procurement cost.
- Lag Disconnect Surcharges occur when mills select historical high-index months for surcharge calculation while purchasing natural gas on cheaper forward fixed-price contracts.

Worked Surcharge Derivation across Gas Scenarios
A concrete example demonstrates how baseline caps keep index movements bounded. Take a contract for 125 g/m² Testliner 3 at a base price of €650.00 per metric tonne, indexed against baseline figures of €25.00/MWh for TTF natural gas and €70.00/MWh for electricity. The agreed baselines are fixed at 2.10 MWh of natural gas and 0.40 MWh of power per tonne.
If natural gas doubles to €50.00/MWh while electricity moves to €110.00/MWh, the formula calculates the cost delta cleanly. The natural gas increase yields 2.10 MWh × €25.00/MWh = €52.50 per tonne. The electricity increase yields 0.40 MWh × €40.00/MWh = €16.00 per tonne.
Combined, the total energy surcharge is €68.50 per metric tonne, taking the landed board price from €650.00 to €718.50 per tonne.
| TTF Gas Index (€/MWh) | EPEX Power Index (€/MWh) | Gas Cost Delta (€/t) | Power Cost Delta (€/t) | Total Surcharge (€/t) | Landed Board Price (€/t) | Effective Price Increase (%) |
|---|---|---|---|---|---|---|
| 25.00 (Base) | 70.00 (Base) | 0.00 | 0.00 | 0.00 | 650.00 | 0.00 |
| 40.00 | 90.00 | 31.50 | 8.00 | 39.50 | 689.50 | 6.08 |
| 60.00 | 120.00 | 73.50 | 20.00 | 93.50 | 743.50 | 14.38 |
| 80.00 | 150.00 | 115.50 | 32.00 | 147.50 | 797.50 | 22.69 |
| 100.00 | 180.00 | 157.50 | 44.00 | 201.50 | 851.50 | 31.00 |
Unhedged fuel exposures bring rapid volatility. Without explicit baseline caps, established efficiencies, and dual-index structures, an unbundled formula becomes an open-ended financial risk that steadily eats into converting margins.


Boiler
On-site combined heat and power (CHP) installations supply high-pressure steam and generate electricity simultaneously, changing how a mill interacts with spot power markets. Modern recycled board mills routinely run gas-turbine or boiler-driven CHP units that achieve total thermal efficiencies between 80 and 90 percent, well above the 35 to 50 percent efficiency typical of central utility plants. Applying full spot-grid power indexes to a mill that generates its own electricity creates artificial cost inflation.
A mill’s fuel mix dictates its actual exposure to natural gas markets. Older package boilers burn 100 percent natural gas, but integrated recycled mills run on diversified sources. They utilize process side-streams: anaerobic digestion biogas from effluent plants, separated plastic rejects, and bark or wood residuals from virgin lines.
A modern mill can displace 15 to 35 percent of its fossil energy demand with these biogenic fuels. Formulas must scale natural gas indexing to exclude this non-fossil fraction.

Why Does Cogeneration Efficiency Shift Surcharge Calculations?
Cogeneration reduces primary energy requirements per metric tonne by capturing waste heat. Gas turbines generate electricity while directing hot exhaust into heat recovery steam generators (HRSGs) to supply the dryer section. Because of this heat recovery, self-generated electricity costs far less than grid purchases.
If a contract indexes electricity to spot power prices while separately indexing steam to gas benchmarks, the buyer is billed twice for the same primary energy.
Proper accounting gives credit for on-site generation. The mill establishes its net heat rate and divides natural gas input between electrical and steam outputs based on useful heat content or thermodynamic exergy. Using an exergy allocation ensures that savings from reduced grid reliance during peak price events flow through as lower net surcharges.
Biomass boiler co-generation shields mill base energy surcharges from natural gas volatility during winter peak demand spikes.

Biomass Integration and Fuel Mix Allocation
Burning bark, wood residues, or anaerobic biogas displaces purchased fossil fuel with stable, fixed-cost thermal energy. When regional gas benchmarks spike, steam costs on a biomass boiler remain largely unchanged. If a containerboard contract applies market gas surcharges to drying steam generated from solid biomass, the paper manufacturer captures windfall profits while the buyer absorbs unincurred costs.
Auditing a mill’s real fossil exposure involves calculating its Fuel Allocation Ratio (FAR), which determines the split between natural gas and alternate fuels over an annual operating cycle. Supply agreements apply a Fossil Pass-Through Factor (FPF) to weight the gas surcharge accordingly. An FPF of 0.70 means natural gas accounts for 70 percent of thermal energy, restricting gas index adjustments to that specific 70 percent fraction.
Auditing mill cogeneration setups and declared fuel allocations involves several key verification steps:
- Fuel Purchase Audits cross-check actual volumes of natural gas, biomass, and biogas purchased by the mill against declared baseline formula inputs.
- Grid Export Accounting identifies whether electrical power generated on site is sold back to the public grid during high-price spot events while charging buyers full surcharge rates.
- Boiler Efficiency Verification measures thermal conversion efficiency across recovery boilers and HRSG units under ISO 50001 energy management audit protocols.
- Biogas Allocation Checks ensure internal wastewater treatment biogas volume is credited against thermal natural gas baselines rather than treated as free mill profit.
- Steam Export Deductions subtract thermal energy piped to third-party industrial facilities adjacent to the paper mill from total fuel consumption formulas.
Mills with integrated biomass co-generation boilers carry substantially less fossil fuel price exposure than facilities that rely entirely on natural gas package boilers and external grid power.


Clause
Contract language sets the triggers, reset frequencies, and audit protocols governing energy adjustments. Tight legal drafting prevents disputes over when surcharges apply, how true-up reconciliations run, and what documentation is required to support an invoice adjustment. Loose clauses allow suppliers to adjust billing methods mid-contract during energy market spikes.
Trigger mechanisms prevent small index shifts from constantly resetting prices. Agreements often specify a neutral deadband around the baseline gas price, typically set at plus or minus 5 to 10 percent. Fluctuations inside this corridor trigger no adjustment, avoiding unnecessary administrative work for both parties.
Surcharges take effect only when index prices move outside the deadband.

Index Reset Frequencies and Lag Periods
Monthly adjustments track the market closely, while quarterly resets absorb short-term swings. The time between index publication, board production, and invoice generation is the lag period. A standard one-month lag contract sets May surcharges using April index averages, providing converting plants with the predictable numbers they need when pricing finished boxes for the month ahead.
A two- to three-month lag exposes mills to working capital stress when gas prices climb fast. Conversely, when markets fall, rapid index adjustments return savings to buyers without delay. Contracts must specify whether calculations rely on daily spot settlements, forward futures, or trailing moving averages, which smooth price volatility at the cost of delaying the benefit of falling energy costs.
True-Up Adjustments and Audit Rights
True-up clauses reconcile estimated monthly surcharges against audited mill utility expenses on a quarterly or annual cycle. If a mill collects €1.2 million in energy surcharges across six months while its actual energy expense increases totaled €1.0 million, the clause requires a €200,000 credit on subsequent deliveries.
In quarterly negotiations, transparent fuel indexing prevented a 14 percent surcharge overcharge. Comprehensive audit terms grant buyers access to independent ISO 50001 energy records, utility invoices, meter logs, CHP heat rates, and net production tonnage to verify invoice accuracy. These reviews are typically limited to once per calendar year, with the buyer paying the audit costs unless a billing error exceeding 3 percent is uncovered, in which case the supplier covers the expense.
Verifying monthly energy surcharges on delivered containerboard involves a standard audit sequence:
- Extract published TTF natural gas and EPEX electrical power index monthly averages for the applicable lag calculation period.
- Cross-check index values against contract reference definitions to confirm correct arithmetic averaging methods.
- Verify delivered reel weights against mill certificate net tonnage records, excluding core weight and packaging wrap.
- Apply baseline gas and power consumption caps specified in the contract agreement per grade category.
- Calculate gas and electricity cost deltas relative to contract base index reference points.
- Multiply consumption baselines by respective cost deltas and sum the results to determine maximum allowable surcharge per metric tonne.
- Reconcile calculated surcharge against line-item surcharge figures on supplier invoices.
- Issue formal discrepancy notices to supplier billing departments within thirty calendar days of invoice receipt.
| Reset Frequency | Lag Period | Index Calculation Base | Volatility Exposure | Administrative Burden | Converter Cost Pass-Through Feasibility |
|---|---|---|---|---|---|
| Monthly | 1 Month | Prior Month Average TTF Spot | High | Moderate | High (Direct Monthly Adjustment) |
| Monthly | 2 Months | Trailing 30-Day Futures Settlement | Moderate | Moderate | Moderate (Lagged Cost Recovery) |
| Quarterly | 1 Quarter | Prior Quarter Average TTF/EPEX | Low | Low | Low (Delayed Volatility Catch-Up) |
| Bi-Annual | 1 Month | 6-Month Trailing Moving Average | Very Low | Very Low | Very Low (Smoothing Obscures Spot Signal) |
The standard contract clause reads: “Seller shall calculate the monthly Unbundled Energy Surcharge using verified net delivered board metric tonnages multiplied by the baseline thermal energy allowance of 2.0 MWh/t, indexed strictly to the trailing one-month arithmetic average TTF gas settlement price exceeding the neutral corridor threshold of €30.00/MWh.”

Margin
Box plants buy containerboard reels by weight in metric tonnes or short tons, convert the board into corrugated sheets, and sell the finished packaging by surface area or per thousand boxes. Converting an unbundled mill surcharge of €50.00 per metric tonne into an area cost per thousand square metres (€/k m²) requires accounting for sheet grammages, fluting take-up ratios, and plant scrap rates to protect operating margins.
Grammage determines how heavily a tonnage surcharge hits corrugated board costs. Heavy combinations, like a double-wall 200 Testliner / 150 Fluting / 200 Testliner construction, contain substantial paper mass per square metre, magnifying metric-tonne surcharges when translated to surface area. Downgauging reduces mass, mitigating the absolute financial impact of mill energy surcharges per finished box.
Translating Tonnage Surcharges into Area Costs
Area costs per thousand square metres are calculated using paper grammages and flute take-up factors. For example, a C-flute single-wall board made with 140 g/m² Testliner 2 liners and a 120 g/m² recycled medium requires a take-up factor of approximately 1.42, meaning each square metre of finished board consumes 1.42 square metres of fluting. Total paper weight comes to (140 g/m² × 2) + (120 g/m² × 1.42) = 280 + 170.4 = 450.4 grams per square metre, or 0.4504 kilograms per square metre.
If the paper mill applies an energy surcharge of €60.00 per metric tonne (€0.060 per kilogram), the raw energy charge per square metre of corrugated board is 0.4504 kg/m² × €0.060/kg = €0.027024, or €27.02 per thousand square metres. Factoring in an 8 percent converting scrap rate raises that exposure to €29.37 per thousand square metres, which directly compresses margins if not passed through to the end packaging buyer.
Lightweight linerboard requires higher thermal energy input per unit mass during web drying than heavyweight packaging grades.

Lightweighting Trade-Offs and Energy Exposure
Reducing paper grammage cuts total mass per box, lowering freight costs and fiber usage, but it increases the thermal energy needed per metric tonne at the mill. Replacing a 150 g/m² testliner with a 110 g/m² high-performance recycled liner reduces board weight by 26.6 percent, though running lighter sheets often requires slower machine speeds. At the same time, the mill’s thermal drying baseline rises from 1.90 MWh/t to 2.25 MWh/t due to lower drying contact efficiency, increasing the energy surcharge rate per metric tonne.
Even with that higher per-tonne surcharge rate, the 26.6 percent reduction in paper mass results in a net decrease in total energy surcharge exposure per thousand boxes, even as moisture specifications alter steam demand. Packaging engineers balance mill thermal intensity, sheet grammage, and plant scrap rates to optimize packaging costs during energy price spikes.
What unhedged contractual risks remain when multi-mill containerboard suppliers reallocate high-cost energy surcharges across regional converting networks operating disparate boiler fuels?