Flexographic Aqueous Latex Barrier Coating Viscosity Measurement Fundamentals
Flexographic aqueous latex barrier coating viscosity requires multi-shear rotational measurement to ensure accurate anilox transfer and barrier film continuity.

Rheology
When synthetic latex dispersions pass through flexographic printing units, their non-Newtonian flow depends heavily on solid particle volume fractions, surfactant shells, and co-binder interactions. Water-borne barrier coatings formulated with styrene-acrylic copolymers, ethylene acrylic acid, or polyvinylidene chloride emulsions run very differently from solvent- or oil-based inks. High molecular weight polymers suspended in water shear-thin under mechanical force, shedding fluid resistance as deformation rates climb.
Matching fluid behavior to press geometry requires quantifying viscosity across several orders of magnitude of shear.
Inside storage tanks under light agitation, latex emulsions experience low shear rates between 0.1 and 10 reciprocal seconds. Shear rises to around 1,000 reciprocal seconds inside the ink pan and chambered doctor blade system. As the metering blade wipes excess coating from the anilox roll and forces fluid into the cells, shear rates surge past 100,000 reciprocal seconds, topping 500,000 at the nip between the anilox roll and plate.
Static bench viscosity readings reveal very little about how the fluid will transfer, empty from cells, or level across these vastly different shear regimes.
Non-Newtonian Mechanics in Polymer Dispersions
Suspended in water, polymer particles stay in constant Brownian motion and remain randomly distributed at rest. Applied shear stress aligns these spherical particles and their hydration layers along parallel streamlines, dropping hydrodynamic resistance. Barrier latex emulsions usually display pseudoplastic behavior modeled by the Ostwald-de Waele power-law equation.
The power-law index stays below unity for shear-thinning coatings; once it drops below 0.5, the fluid becomes sharply shear-sensitive ~ flowing readily under blade pressure, then firming up almost immediately after hitting paper.
Dilution or over-dispersion alters the steric stabilization layer on each latex sphere. While hydration forces and electrostatic repulsion prevent coagulation during storage, extreme shear at the doctor blade tip can strip weakly bound surfactant molecules and trigger micro-flocculation. This mechanical disruption spikes local internal friction, creating an apparent viscosity surge under shear.
Operators seeing streaks or blade lines often mistake shear-induced coagulation for low coat weight, making fluid adjustments that only worsen the problem.
Extensional viscosity sets another boundary in flexographic coating. When the liquid film splits upon exiting the plate-to-substrate nip, it undergoes rapid elongational strain. Formulations with high extensional viscosity pull into long liquid filaments that snap into airborne droplets ~ a defect known as misting.
Balancing extensional viscosity against shear viscosity stops atomization without sacrificing leveling on folding boxboard or linerboard.
Time-Dependent Structure Breakdown and Recovery
Thixotropy dictates how fast a fluid breaks down under shear and rebuilds once stress stops. Barrier performance relies on rapid, controlled recovery after coating the substrate. Instant structural recovery freezes blade marks and cell patterns directly into the film, leaving microscopic pinholes that degrade water vapor transmission rates.
Delayed recovery, on the other hand, lets the liquid sink deep into the porous matrix of unbleached kraft paper, draining the surface coat and dropping oil and grease resistance.
Rheometers measure thixotropy using step-shear experiments or hysteresis loop sweeps. Ascending shear ramps break weak hydrophobic associations between rheology modifiers and latex particles; descending ramps track network rebuild kinetics. The area enclosed between the ascending and descending curves quantifies the formulation’s thixotropic energy density.
At application speeds around 300 meters per minute, target hysteresis areas must stay within narrow bounds to balance film leveling against substrate strike-through.
Viscosity values measured under low shear conditions fail to forecast fluid transport through anilox cells operating at elevated production speeds.
Associative thickeners like hydrophobically modified ethylene oxide urethane resins modify recovery kinetics by building dynamic networks across adjacent latex particles. Under high shear, the hydrophobic ends detach from particle surfaces, allowing the fluid to align. Leaving the nip, those hydrophobic ends re-attach within 50 to 500 milliseconds.
Evaluating these transient networks using rotational rheometry confirms whether structural recovery matches substrate drying speeds.
| Process Zone | Shear Rate Range (s⁻¹) | Dominant Rheological Mechanism | Target Viscosity Range (mPa·s) | Primary Measurement Tool |
|---|---|---|---|---|
| Storage & Tank Agitation | 0.1 – 10 | Zero-shear viscosity, anti-settling stability | 1,500 – 4,500 | Rotational Viscometer (Low Speed) |
| Chamber & Pump Circulation | 100 – 1,000 | Initial structural breakdown, yield stress | 250 – 600 | Efflux Cup / Rotational Viscometer |
| Doctor Blade Metering | 10,000 – 100,000 | High-shear thinning, hydrodynamic lubrication | 35 – 80 | High-Shear Capillary Rheometer |
| Anilox Cell Transfer & Nip | 100,000 – 1,000,000+ | Extensional viscosity, filament splitting | 15 – 45 | Ultra-High Shear Rheometer |
| Substrate Leveling | 1 – 50 | Thixotropic recovery, pinhole sealing | 400 – 1,200 | Oscillatory Amplitude / Time Sweep |
Polymer solids concentration marks the transition from dilute dispersion behavior to a crowded suspension regime. Near maximum packing, minor increases in non-volatile content trigger huge jumps in low-shear viscosity. Barrier coatings operating around 55 percent volume solids undergo severe shear-thickening if the particle size distribution is monodisperse.
Formulators blend bimodal particle distributions to improve packing efficiency, holding operational viscosity down while maximizing delivered dry coat weight per pass.
Fluid memory controls droplet relaxation right after transfer. Polymer chains store elastic energy during high-shear blade passage; if pressure releases too fast and the aqueous phase cannot relax alongside the polymer, rapid elastic recoil creates surface micro-cavitation. Oscillatory shear testing separates the storage modulus from the loss modulus.
Maintaining the loss modulus above the storage modulus across high frequencies prevents elastic fracturing during high-speed application.
Emulsions with high low-shear viscosity resist pumping and starve chambered doctor blades. Air trapped in a starved chamber generates micro-foam, introducing voids into the dried film. Continuous viscosity control means balancing low-shear pumpability against high-shear blade behavior: the coating needs enough low-shear body to keep pigment and wax from settling, yet must thin cleanly under blade pressure.
A coating that thins predictably under high shear levels smoothly on the surface without sinking deep into the paper substrate.
Bench
Off-line quality control relies on standardized test methods to verify batch consistency before liquid barrier formulations head to press kettles. Sample conditioning under ISO 187 rules at 23 degrees Celsius and 50 percent relative humidity establishes a repeatable baseline. Because a shift of just two degrees Celsius changes measured efflux times for aqueous acrylic latex by up to eight percent, bench instruments require strict thermal control to yield reliable numbers.
Efflux Cup Kinematic Measurements
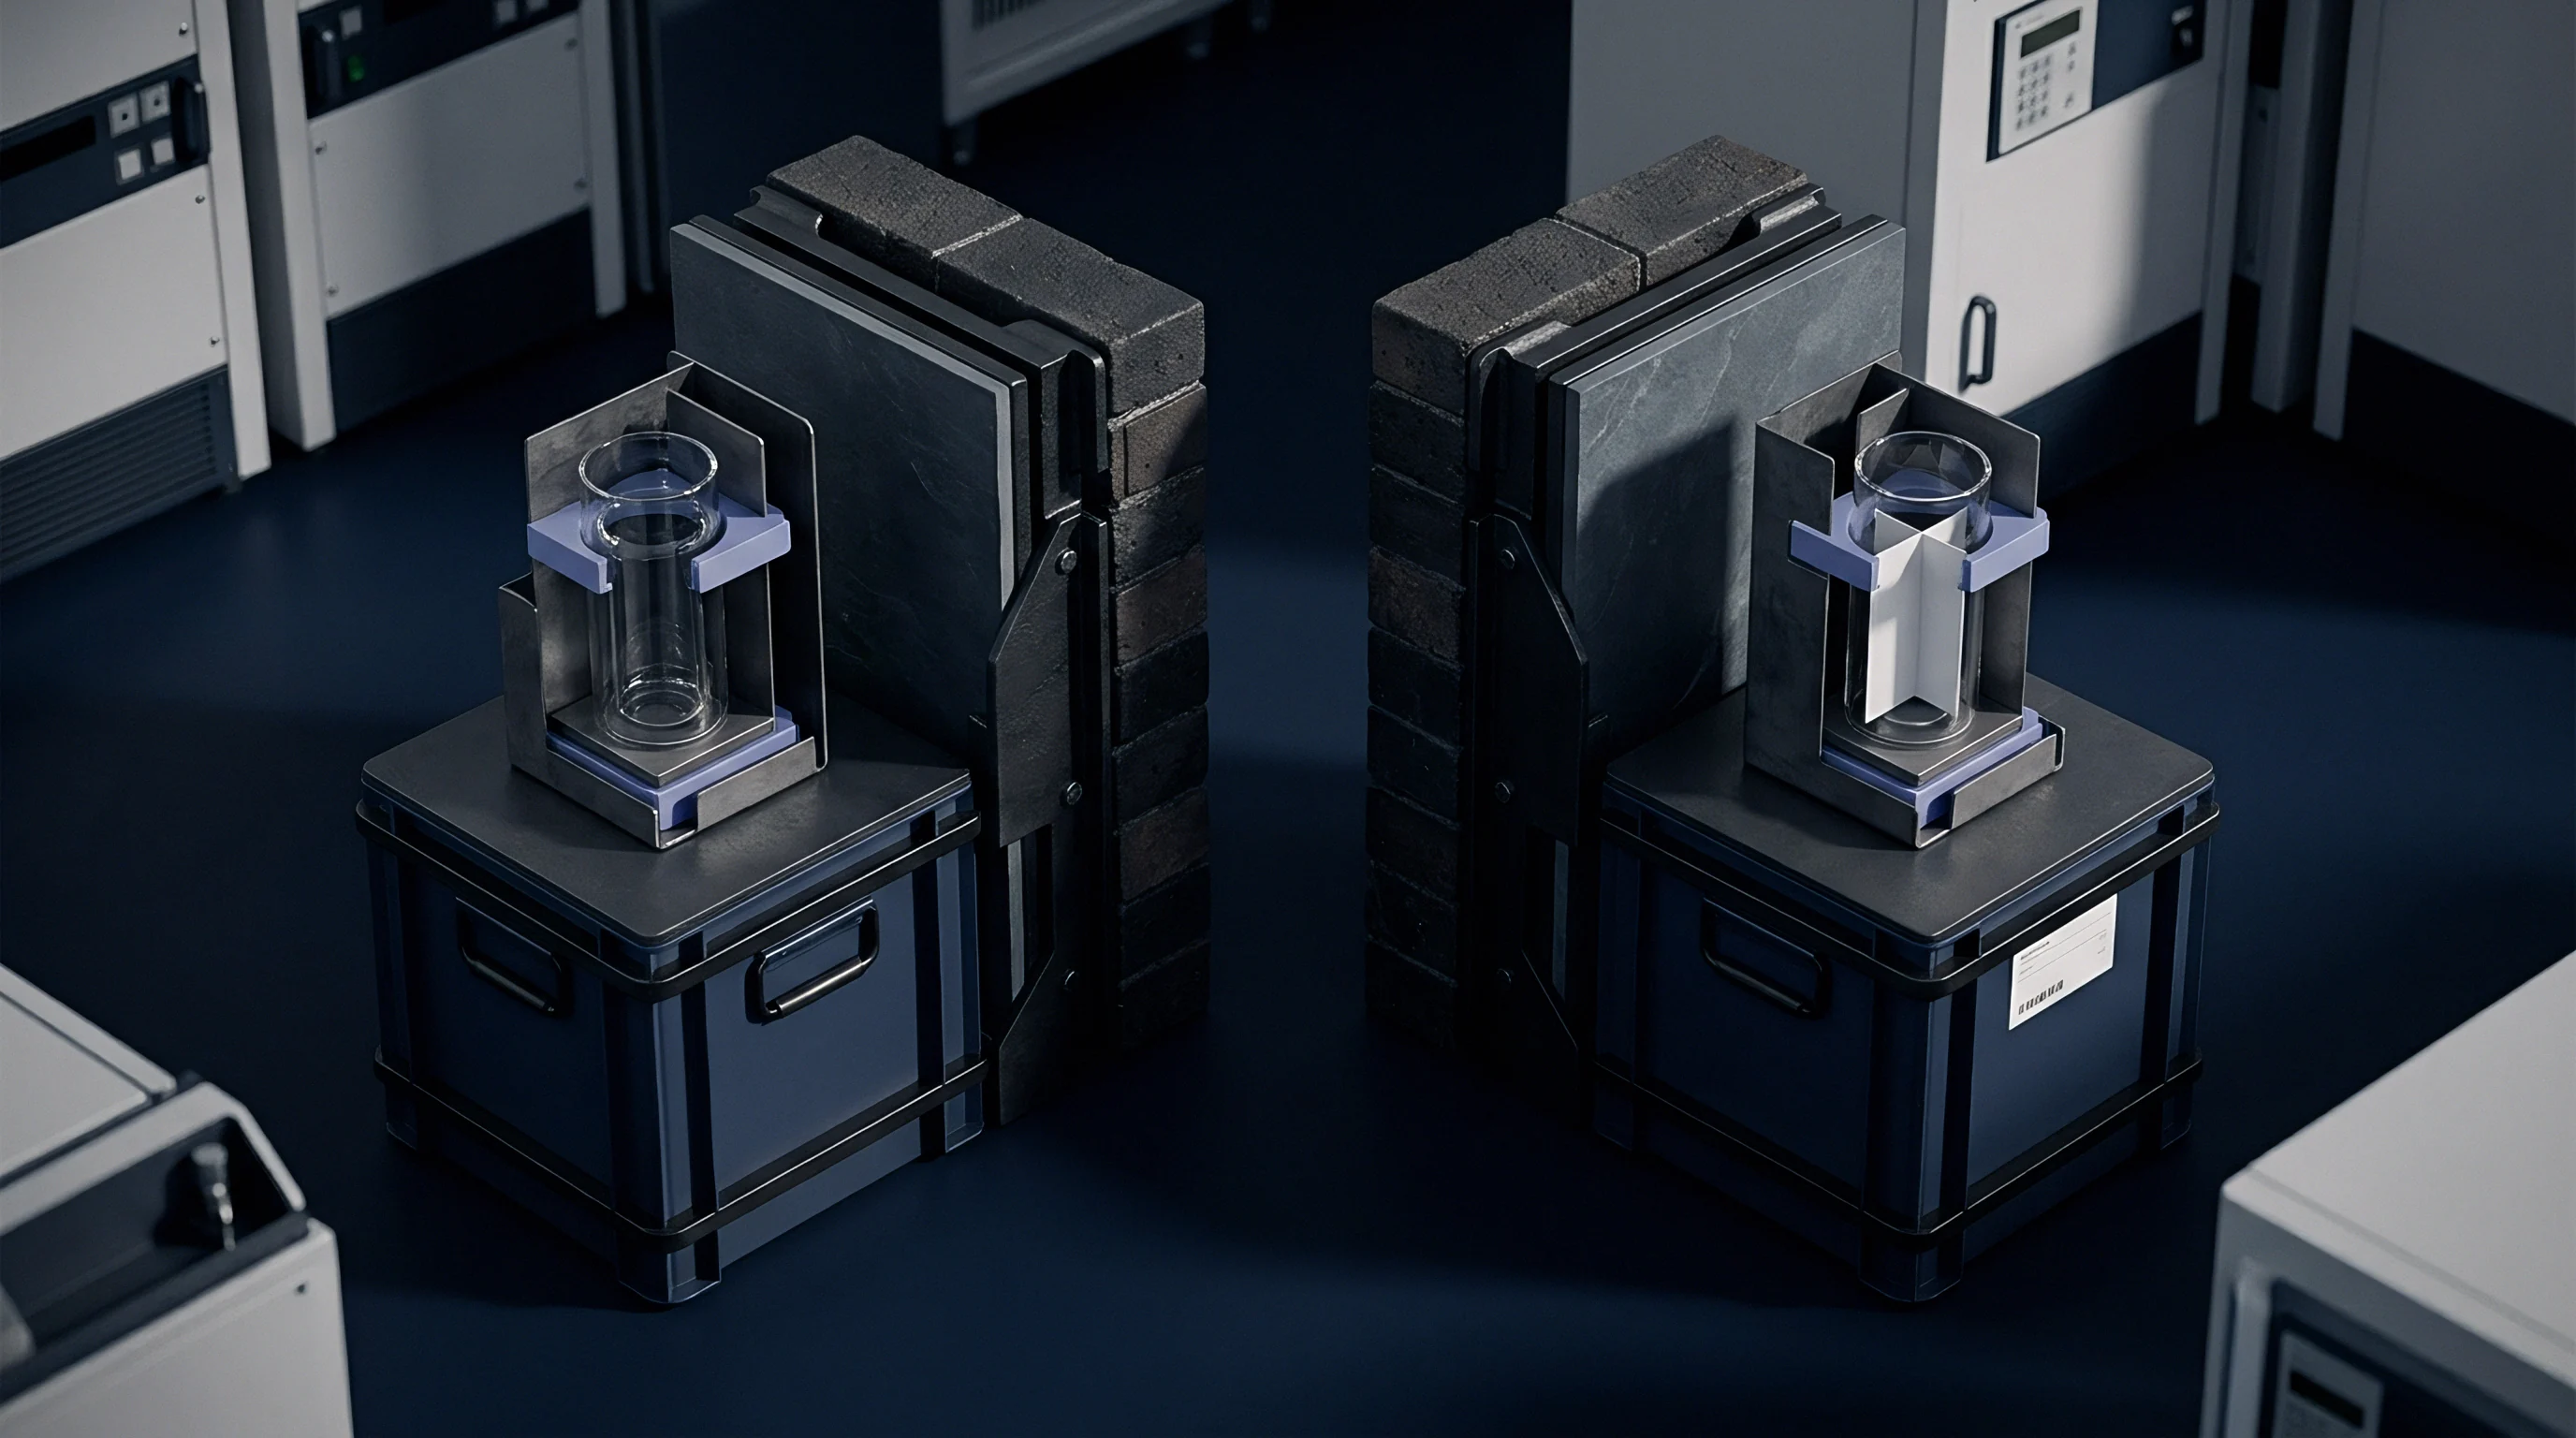
Efflux cups remain the primary shop-floor measurement tool on flexographic lines. Cups built to ISO 2431, DIN 53211, or ASTM D1200 record how long a set volume takes to flow through a calibrated orifice under gravity. Efflux time in seconds correlates directly to kinematic viscosity in centistokes only for Newtonian liquids.
Because non-Newtonian latex emulsions experience changing shear rates as the cup empties, efflux time serves as an empirical index rather than a true physical viscosity.
Ford, Zahn, and ISO cups feature different orifice geometries and internal wall tapers. An ISO 4 millimeter cup covers kinematic viscosities from 25 to 180 square millimeters per second, whereas a Zahn #2 cup works best between 20 and 80 seconds of efflux. Converting between cup geometries using standard charts introduces systematic errors exceeding 15 percent on latex barrier coatings, as shear-thinning distorts conversion formulas derived from Newtonian oils.
Orifice wear causes subtle measurement drift over time. Alkaline cleaning solutions and abrasive mineral pigments erode brass and stainless steel orifices. An enlargement of just 20 micrometers inside an ISO 4 millimeter orifice cuts four seconds off the measured efflux time of a standard barrier coating.
Laboratories check orifice dimensions with certified viscosity calibration oils at least quarterly.
| Test Instrument | Standard Designation | Operating Principle | Primary Variable | Standard Conditioning |
|---|---|---|---|---|
| ISO Efflux Cup #4 | ISO 2431 | Gravity-driven orifice flow | Kinematic efflux time (s) | 23.0°C ± 0.5°C |
| Zahn Dip Cup #2 / #3 | ASTM D4212 | Immersion gravity orifice flow | Kinematic efflux time (s) | 23.0°C ± 1.0°C |
| Rotational Viscometer | ISO 2555 / ASTM D2196 | Controlled rotational torque | Dynamic viscosity (mPa·s) | 23.0°C ± 0.2°C |
| Cone and Plate Viscometer | ISO 3219 | Defined geometric shear gap | High-shear dynamic viscosity | 23.0°C ± 0.1°C |
Surface tension and streaming potential affect how the flow stream breaks at the end of a test run. As fluid runs out, the continuous stream snaps into individual droplets. Technicians who call the endpoint at the first stream break get consistent numbers; those who wait for the cup to drain completely add two to five seconds of manual variation.
Standardizing on the first stream break maintains acceptable gauge repeatability and reproducibility.

Rotational Viscometry Principles
Rotational viscometers built to ISO 2555 measure the torque needed to spin a calibrated spindle in latex at fixed angular speeds. Brookfield-style units record dynamic viscosity in millipascal-seconds. Running speed sweeps from 0.5 to 100 revolutions per minute allows technicians to plot shear response curves, exposing shear-thinning, yield stress, and thixotropic breakdown that efflux cups miss.
Spindle geometry dictates measurement accuracy. Standard disc spindles create complex flow patterns and edge effects inside the sample container. Cylindrical spindles built to DIN 53019, by contrast, establish a defined shear gap that allows precise translation of rotational speed into shear rate in reciprocal seconds.
Testing barrier latex with disc spindles gives relative torque values rather than absolute viscosity data.
Temperature deviations during bench testing distort viscosity metrics faster than minor solid content shifts.
Container geometry establishes boundary conditions during rotational testing. Standardizing on a 600 milliliter low-form glass beaker fixes the distance between container walls and the spindle. Measuring in narrow cans or wide plastic tubs alters boundary drag, shifting torque calculations by up to ten percent.
Using consistent beaker dimensions across labs eliminates geometric errors in quality records.
Sample preparation directly affects rotational readings. Vigorous stirring introduces micro-bubbles that lower fluid density and distort torque readings. Resting the sample for 15 minutes in a 23 degrees Celsius water bath releases entrained air and evens out fluid temperature.
Immersion depth must match the spindle groove mark exactly to keep the wetted surface area constant.
- Sample Thermal Equilibration ~ Place the sealed sample container in a circulating water bath held at 23.0 degrees Celsius for 20 minutes to clear internal thermal gradients.
- Bubble Elimination Inspection ~ Check the fluid surface for entrained air, letting bubbles clear naturally or pulling them off with gentle surface vacuum pressure.
- Spindle Coupling Attachment ~ Thread the chosen cylindrical spindle onto the left-handed viscometer shaft without applying lateral force to the internal pivot.
- Sample Immersion Alignment ~ Lower the viscometer assembly until fluid hits the exact center of the spindle groove mark.
- Multi-Speed Torque Scan ~ Record torque and dynamic viscosity at 6, 12, 30, and 60 revolutions per minute, taking readings after three full head rotations at each speed step.
Shop-floor cup readings frequently fall within broad nominal ranges despite measurable batch viscosity variations.

Spindle
Selecting the right spindle establishes the mathematical boundaries needed to translate raw torque into absolute viscosity. Dial and digital viscometers use interchangeable shafts designed for specific viscosity ranges. An ill-matched spindle forces the transducer to operate near the ends of its calibrated range, distorting readings.
Keeping torque readings between 20 percent and 90 percent of full scale ensures reliable data on synthetic latex systems.
Geometry Selection and Shear Rate Precision
Standard RV-series disc spindles produce uneven shear fields because linear velocity varies across the disc radius. The outer edge moves faster than the shaft surface, generating a range of shear rates inside the sample container. Coaxial cylinders, like the DIN 53019 cup-and-bob setup, maintain a tight, fixed gap between the inner rotating cylinder and outer wall so all fluid experiences the same defined shear rate.
Vane spindles excel with high-solids latex formulations that have a distinct yield stress. Pushing a disc or cylinder into a structured emulsion disrupts the particle network before testing starts ~ an effect called sample shearing. Vane spindles use four thin vertical blades that enter the fluid with minimal disturbance.
Turning the vane at low speeds measures the peak torque needed to break the gel structure, providing an accurate yield stress value in Pascals.
Cone-and-plate systems pair a flat plate with a shallow inverted cone, usually 0.5 to 2 degrees. This layout keeps shear rate uniform across the sample gap and uses less than two milliliters of fluid. Thermal equilibrium takes only seconds in the narrow space, making cone-and-plate units ideal for high-throughput testing.
Latex particle sizes must stay small; particles larger than ten percent of the cone truncation gap cause mechanical jamming and false torque spikes.
How Does Temperature Shift Latex Viscosity Profiles?
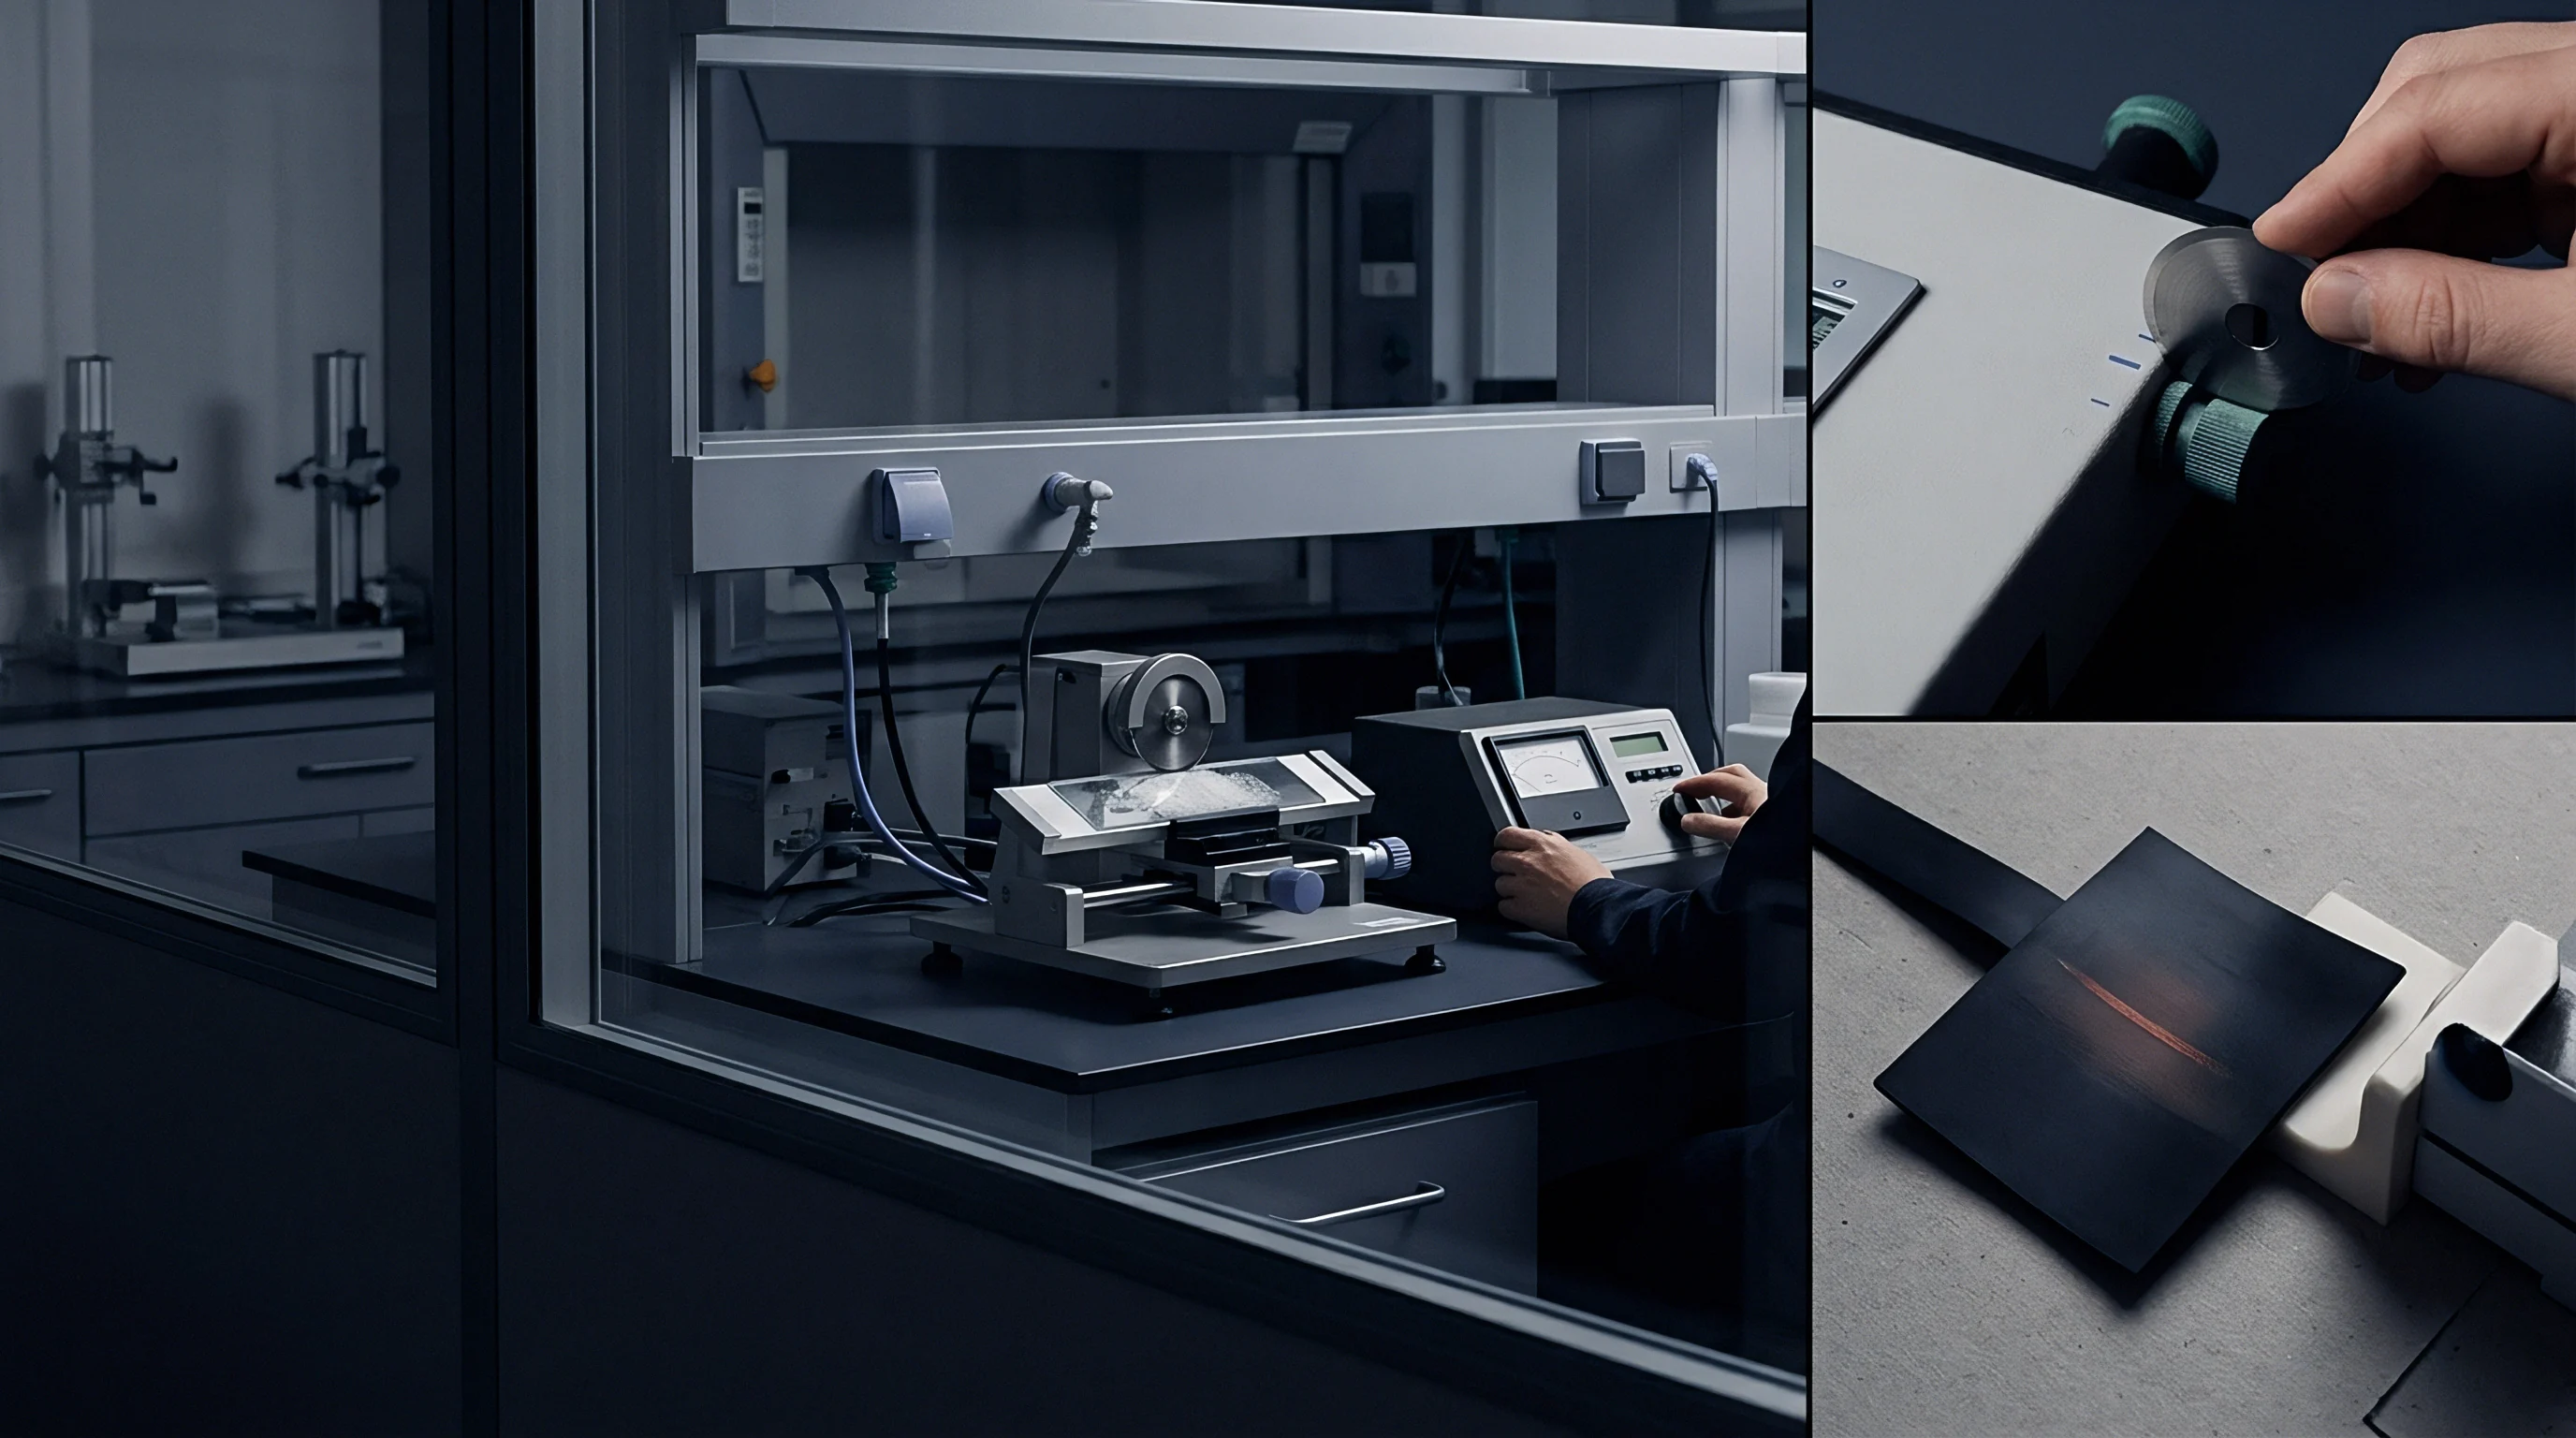
Temperature shifts represent the largest source of viscosity measurement variation on the plant floor. Above their minimum film-forming temperature, aqueous latex polymers follow Arrhenius thermal behavior. As temperature rises, thermal agitation increases free volume between polymer chains and water molecules, driving dynamic viscosity down.
A typical styrene-acrylic latex coating loses roughly 2.5 to 4.0 percent of its dynamic viscosity for every degree Celsius increase.
Uncontrolled room temperatures shift both initial viscosity readings and thixotropic recovery rates. Facilities running in unconditioned spaces see significant drift between cold winter mornings and hot summer afternoons. A batch measuring 500 millipascal-seconds at 20 degrees Celsius drops to 320 millipascal-seconds at 30 degrees Celsius with no change in solids content.
Running presses without correcting for thermal shifts causes wide coat weight swings and barrier performance failures.
Temperature compensation models convert raw bench readings to standard baseline values. Quality control software uses activation energies calculated from temperature sweeps between 15 and 35 degrees Celsius to normalize readings to 23.0 degrees Celsius. Bench instruments without built-in temperature probes leave unrecorded variables in acceptance logs, masking actual polymer variations under thermal noise.
| Temperature (°C) | Dynamic Viscosity at 20 RPM (mPa·s) | Dynamic Viscosity at 100 RPM (mPa·s) | Pseudoplastic Index (n) | Calculated Activation Energy (kJ/mol) |
|---|---|---|---|---|
| 15.0 | 780 | 210 | 0.43 | 24.2 |
| 19.0 | 620 | 175 | 0.45 | 23.8 |
| 23.0 (Standard) | 500 | 145 | 0.47 | 23.5 |
| 27.0 | 410 | 122 | 0.48 | 23.1 |
| 31.0 | 340 | 104 | 0.50 | 22.9 |
| 35.0 | 285 | 90 | 0.51 | 22.6 |
Oscillatory shear testing goes beyond steady rotational measurements by applying tiny sinusoidal strain amplitudes to the sample. The response separates into storage modulus (elastic energy stored in the latex matrix) and loss modulus (energy dissipated by viscous flow). The loss factor phase angle shows whether elastic gel structure or viscous liquid flow dominates at a given frequency.
Amplitude sweeps locate the linear viscoelastic region where stress leaves internal structure intact. Crossing the critical strain limit breaks intermolecular associations, initiating flow. Designing barrier coatings with a broad linear viscoelastic region stops pigments from settling during transit while allowing clean breakdown under doctor blade pressure.
Measuring linear viscoelastic limits during raw material qualification prevents unexpected drying issues on high-speed runs.
Yield stress testing determines the minimum force needed to start fluid motion. Latex containing clay, talc, or synthetic thickeners develops measurable yield values that resist sagging on vertical carton panels. Measuring static yield stress via creep compliance testing gives concrete proof of anti-sag behavior, replacing subjective visual scales.
Whether low-temperature micro-gelation can be fully reversed through shear without destroying emulsion stability remains an open practical question on the press floor.

Mesh
Metering and transferring water-borne coatings through a flexographic unit requires matching fluid viscosity to anilox cell geometry. The anilox roll acts as a volumetric metering tool, delivering consistent wet film volumes to the printing plate. Cell count, volume, screen angle, and cell shape control how well fluid fills and clears the cavities, as well as lubrication under doctor blade pressure.
Aligning coating rheology with anilox cell dimensions prevents hydraulic starvation and cell clogging during long runs.
Anilox Interaction and High-Shear Cell Dynamics
Anilox cell volume, measured in cubic centimeters per square meter or billion cubic microns per square inch, dictates theoretical wet coat weight. Lines applying latex barrier coatings typically use line screens between 80 and 200 lines per centimeter, giving theoretical cell volumes from 8 to 25 cubic centimeters per square meter. Higher line counts mean smaller cell openings: a 140 line per centimeter roll, for example, has cell openings roughly 50 micrometers across.
High-shear viscosity dictates how quickly the latex enters micro-scale ceramic cavities during the fractions of a millisecond available. If high-shear viscosity under the blade stays above 100 millipascal-seconds, dynamic surface tension prevents full cell filling and traps air inside the cavities. Entrained air can reduce delivered fluid volume by up to 30 percent, dropping coat weight and leaving pinholes in the dry film.
Cell ejection occurs under rapid extensional strain as the ceramic surface separates from the printing plate. Fluid splitting leaves a fraction of coating in the cell bottom, and the ratio of transferred fluid to total cell volume sets delivery efficiency. Low-viscosity formulations transfer efficiently but run on the sheet post-transfer.
High-viscosity formulations resist cell ejection, leaving dried polymer build-up in cell bases that forces frequent chemical cleaning.
| Anilox Screen Count (L/cm) | Theoretical Volume (cm³/m²) | Cell Opening Width (µm) | High-Shear Viscosity Target (mPa·s at 10⁴ s⁻¹) | Recommended Metering Cup Seconds (ISO 4mm) |
|---|---|---|---|---|
| 60 – 80 | 18 – 30 | 110 – 140 | 60 – 90 | 35 – 50 |
| 100 – 120 | 12 – 18 | 70 – 95 | 45 – 70 | 25 – 35 |
| 140 – 160 | 8 – 12 | 50 – 65 | 35 – 50 | 20 – 25 |
| 180 – 220 | 5 – 8 | 35 – 45 | 25 – 40 | 16 – 20 |
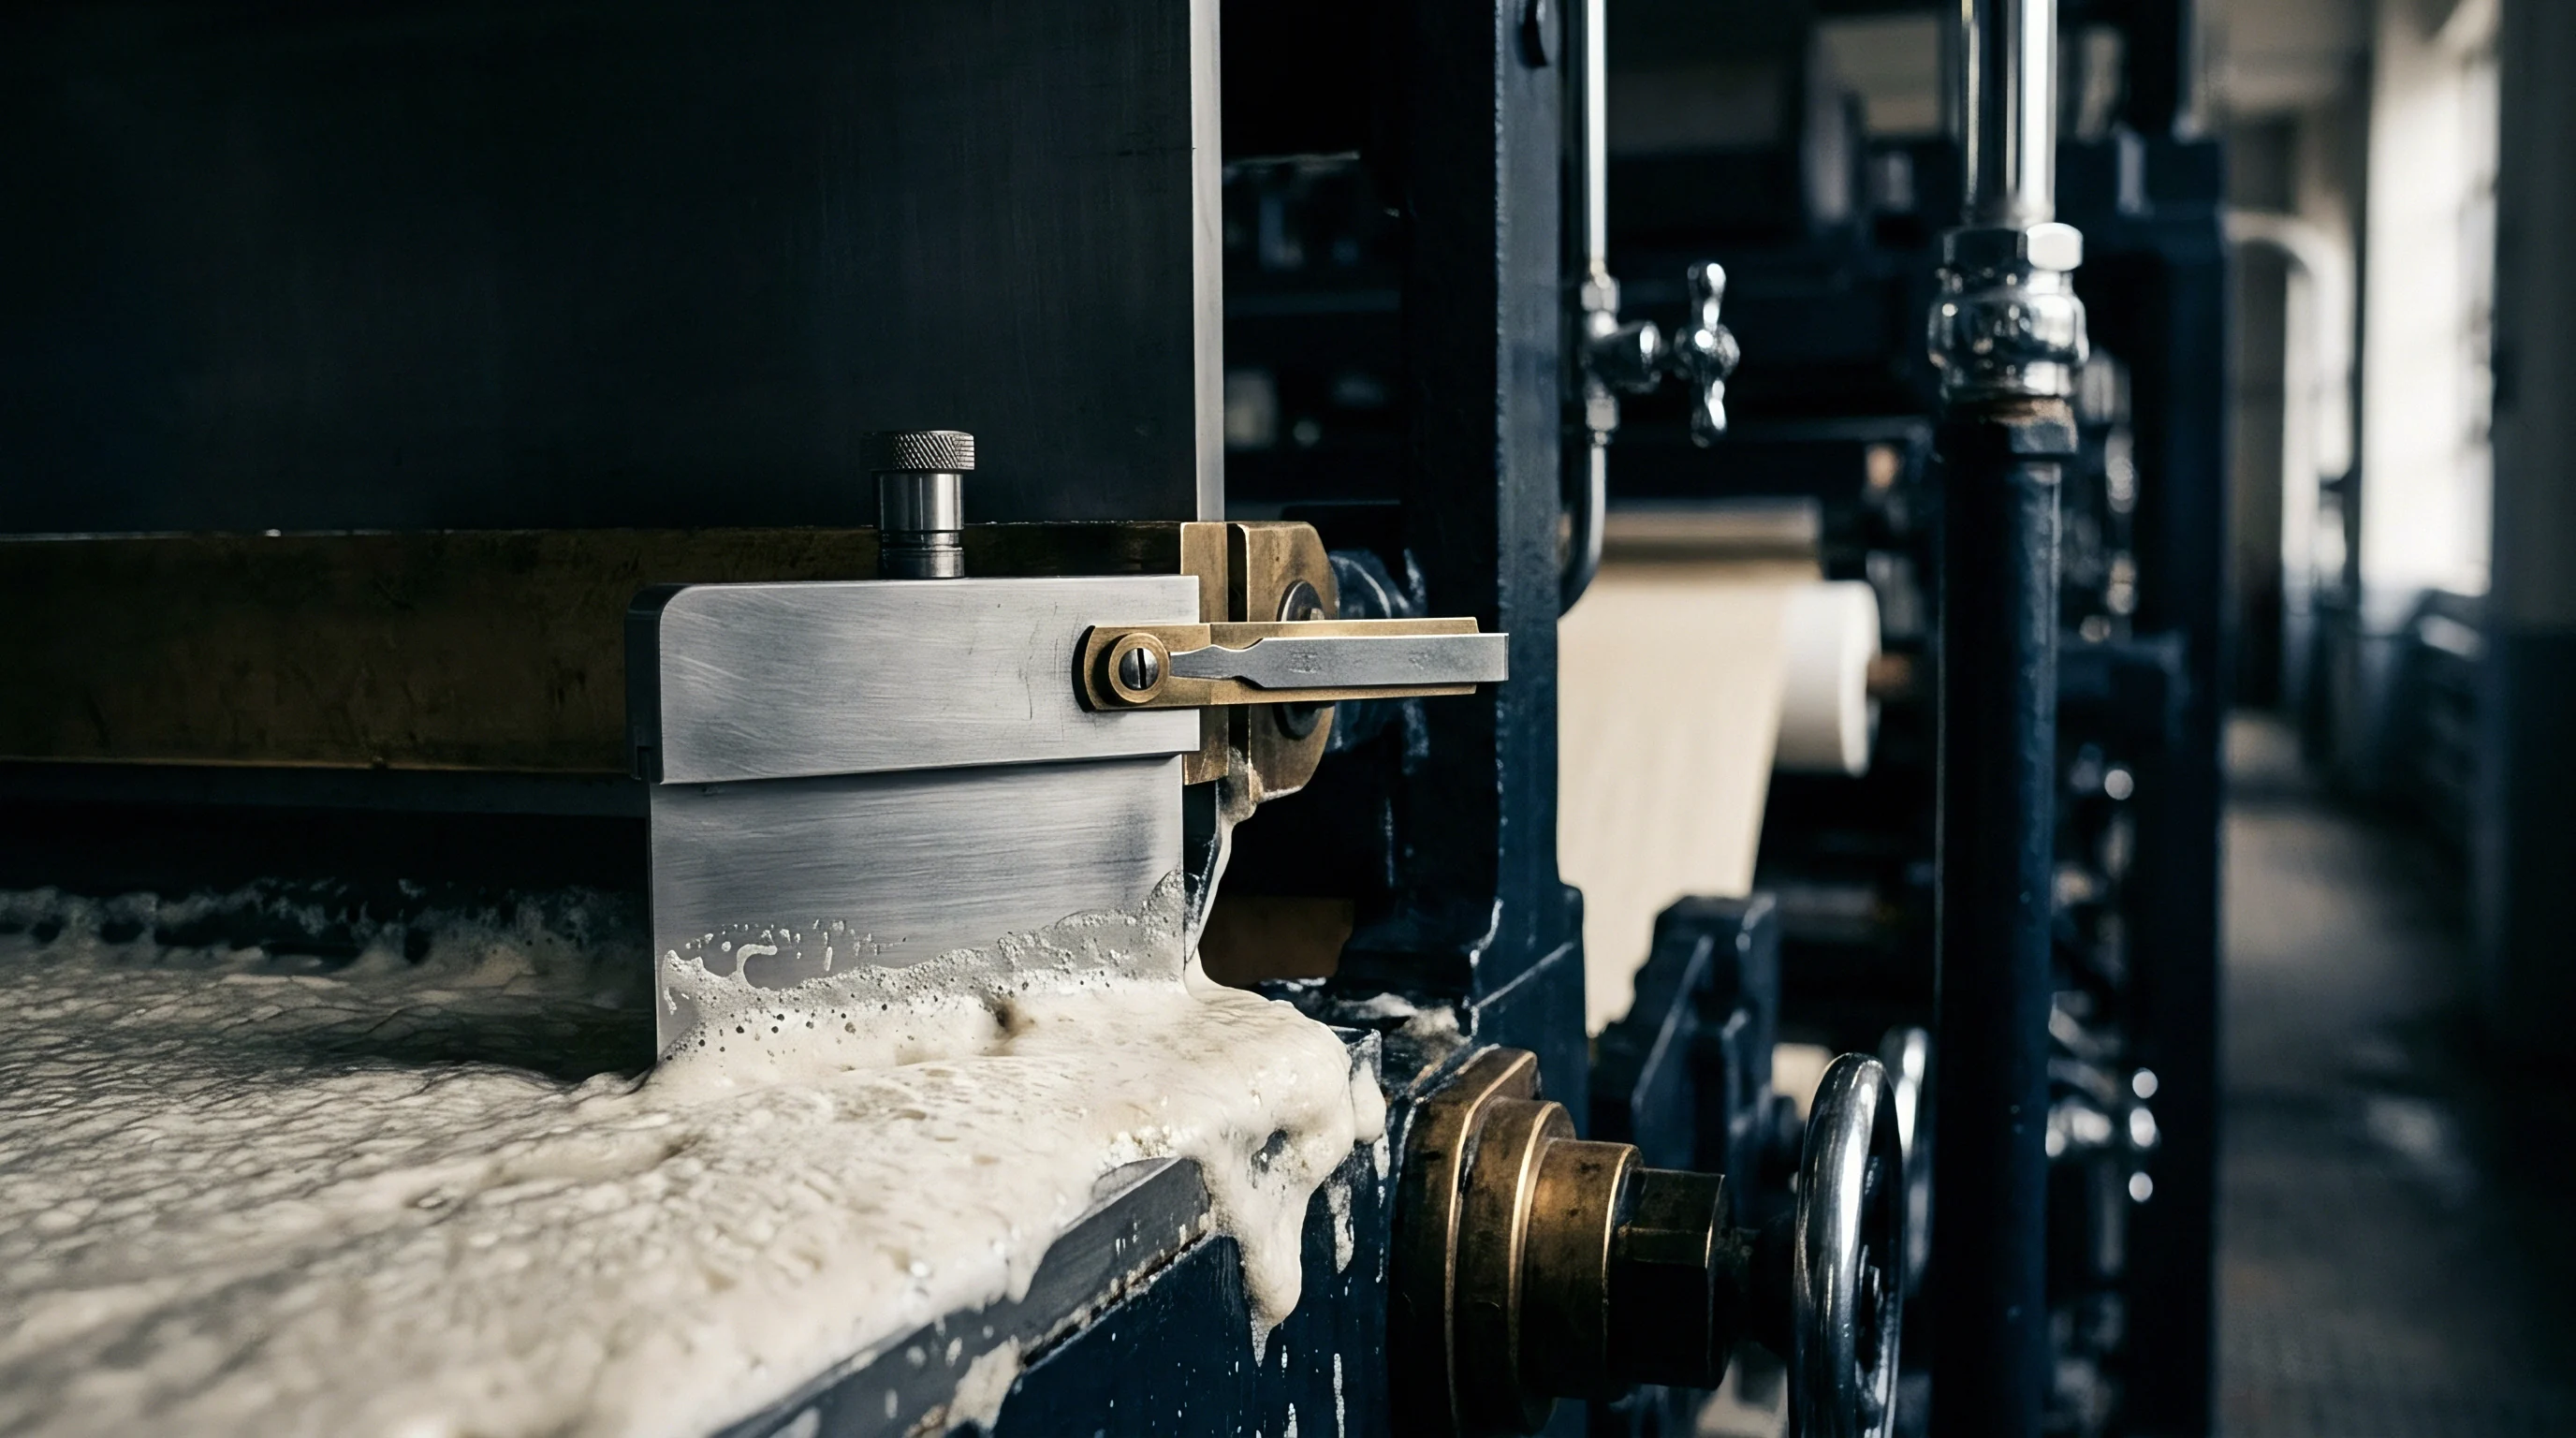
Doctor blade contact creates a hydrodynamic lubrication regime. As the ceramic roll spins against the steel or polymer blade edge, fluid pressure builds beneath the contact zone. If high-shear viscosity is too high, hydrodynamic lift pushes the blade off the ceramic lands, causing coating leakage, back-metering lines, and uneven coat weights.
If viscosity is too low, direct blade-to-ceramic contact accelerates blade wear, shedding micro-metallic fragments into the coating.
Film Formation and Wet-to-Dry Mechanics
Once on paper, wet latex transforms from a liquid dispersion into a continuous barrier film. Water leaves by absorbing into the paper substrate and evaporating under hot-air dryers. As water departs the continuous phase, latex particles crowd together, quickly reaching the critical volume fraction where spheres enter close packing.
Capillary forces then deform the spheres into polyhedral shapes, beginning coalescence. Minimum film-forming temperature determines whether polymer chains can interdiffuse across particle boundaries. If drying temperatures drop below this threshold, coalescence fails, producing a weak, cracked film with no water vapor or grease resistance.
Controlling web drying profiles ensures full interdiffusion without blistering the coating.
- Anilox Cell Plugging ~ High low-shear viscosity stops cell flushing during blade wiping, building up dried polymer in cell bases over long runs.
- Doctor Blade Hydroplaning ~ High dynamic viscosity creates lift under the blade tip, passing uneven coating streaks over ceramic land areas.
- Substrate Strike-Through ~ Slow low-shear thixotropic recovery allows fluid to sink into unbleached kraft fibers, starving the surface layer.
- Pinhole Formation ~ Air bubbles trapped during cell filling cannot escape before heat locks surface defects into the cured film.
- Misting and Atomization ~ Poor extensional viscosity control snaps fluid filaments at the plate nip, throwing fine latex mist over press components.
Substrate absorbency sets how fast water drains from the wet film. Recycled linerboards with high Cobb 60 values pull water rapidly from the interface, driving up solids before the coating levels out. Formulations with high water retention hold water in the fluid longer, preserving surface mobility so anilox cell patterns melt away.
Too much water retention extends drying times, increasing dryer energy demand and risking blocking during rewinding. Formulators balance water retention additives against dryer capacity to get smooth film surfaces at target line speeds. Smooth surfaces prevent thin spots in the barrier layer, preserving uniform water vapor transmission performance across the web.
Increasing anilox volume to hit barrier targets without matching fluid high-shear viscosity causes severe back-metering and destroys blade seals within hours.
Arithmetic
Controlling barrier performance requires mapping wet application rates to dry coat weight targets. Board substrates consume liquid coating based on wet film thickness delivered by the flexo unit. Calculating solid mass delivery means tracking non-volatile content, wet density, board absorbency, and solids drift from evaporation.
Inaccurate dilution math shifts coat weight, directly affecting water vapor transmission and grease resistance.
Dry Coat Weight and Density Relationships
Calculating wet coat weight relies on non-volatile solids content by weight and fluid density. Solids content is measured under ISO 3251 by drying a weighed sample at 105 degrees Celsius to constant mass. Wet density is measured with an ISO 2811 pycnometer.
With those numbers in hand, converting between wet and dry film weights involves simple volumetric math.
The equation translating target dry coat weight into required wet coat weight reads:
Wet Coat Weight (g/m²) = Dry Coat Weight (g/m²) / ( Non-Volatile Content Percentage / 100 )
To calculate wet volume delivery in cubic centimeters per square meter, wet fluid density enters the equation:
Wet Volume (cm³/m²) = Wet Coat Weight (g/m²) / Wet Density (g/cm³)
Applying an 8.0 grams per square meter dry coat weight using a 50.0 percent solids latex with a wet density of 1.05 grams per cubic centimeter requires a wet coat weight of 16.0 grams per square meter. That equates to a wet volume delivery of 15.24 cubic centimeters per square meter from the anilox roll and plate.
| Target Dry Mass (g/m²) | Solids Content (% by wt) | Wet Density (g/cm³) | Required Wet Mass (g/m²) | Required Wet Volume (cm³/m²) | Theoretical Wet Thickness (µm) |
|---|---|---|---|---|---|
| 6.0 | 45.0 | 1.04 | 13.33 | 12.82 | 12.82 |
| 6.0 | 50.0 | 1.05 | 12.00 | 11.43 | 11.43 |
| 6.0 | 55.0 | 1.06 | 10.91 | 10.29 | 10.29 |
| 10.0 | 45.0 | 1.04 | 22.22 | 21.37 | 21.37 |
| 10.0 | 50.0 | 1.05 | 20.00 | 19.05 | 19.05 |
| 10.0 | 55.0 | 1.06 | 18.18 | 17.15 | 17.15 |
Solids content drift during production changes wet-to-dry ratios. Evaporation from open sumps and blade circulation loops concentrates solids over time. A shift from 50 to 53 percent solids raises low-shear viscosity sharply and pushes dry coat weight above target, increasing material costs without adding barrier value.
Automated deionized water additions maintain target solids using inline density or refractive index monitoring.

Viscosity Temperature Compensation Calculations
Adjusting efflux times or dynamic viscosity to a standard baseline temperature uses activation energy math. The Arrhenius model calculates viscosity shifts across moderate temperature ranges:
Viscosity at Target Temp = Viscosity at Test Temp exp( ( Activation Energy / Gas Constant ) ( ( 1 / Target Temp Kelvin ) – ( 1 / Test Temp Kelvin ) ) )
For routine shop quality control, simplified linear correction factors work well across normal room temperature swings between 18 and 28 degrees Celsius:
Viscosity at 23°C = Viscosity Measured ( 1 + ( Temperature Coefficient ( Measured Temp – 23.0 ) ) )
With an empirical temperature coefficient of 0.035 per degree Celsius for a styrene-acrylic latex, a reading of 420 millipascal-seconds at 26.5 degrees Celsius adjusts to 23.0 degrees Celsius like this:
Viscosity at 23°C = 420 ( 1 + ( 0.035 ( 26.5 – 23.0 ) ) ) = 420 ( 1 + 0.1225 ) = 471.45 mPa·s
| Starting Batch Mass (kg) | Initial Solids (% wt) | Target Solids (% wt) | Water Addition Required (kg) | Final Batch Mass (kg) | Expected Low-Shear Drop (%) |
|---|---|---|---|---|---|
| 1,000 | 54.0 | 50.0 | 80.00 | 1,080.00 | 35 – 45 |
| 1,000 | 54.0 | 48.0 | 125.00 | 1,125.00 | 50 – 60 |
| 1,000 | 52.0 | 50.0 | 40.00 | 1,040.00 | 18 – 25 |
| 1,000 | 52.0 | 48.0 | 83.33 | 1,083.33 | 35 – 45 |
Calculating the water needed to lower batch solids relies on mass balance equations. Dropping 1,000 kilograms of latex coating from 54.0 percent solids down to 50.0 percent uses mass conservation:
Water Addition Mass = Initial Mass ( ( Initial Solids / Target Solids ) – 1 )
Water Addition Mass = 1000 ( ( 54.0 / 50.0 ) – 1 ) = 1000 ( 1.08 – 1 ) = 80.0 kg
Adding 80.0 kilograms of deionized water brings solids down to 50.0 percent while dropping low-shear dynamic viscosity by roughly 40 percent. Calculating these additions before loading press sumps prevents overshooting viscosity targets.
Dilution requires soft or deionized water. Adding tap water containing divalent ions like calcium or magnesium destabilizes surfactants, triggering micro-coagulation that clogs inline filters and damages anilox rolls.
Yield tracking calculates material costs per thousand square meters of board. Coating raw materials are a major cost driver in converter operations. Applying an 8.0 grams per square meter dry layer with latex costing 3.50 Euros per wet kilogram at 50 percent solids works out as follows:
Cost per 1,000 m² = ( Dry Coat Weight (g/m²) / ( Solids Fraction ) ) Cost per Wet kg = ( 8.0 / 0.50 ) 3.50 = 16.0 kg 3.50 = 56.00 Euros
Holding wet coat weight within plus or minus 0.5 grams per square meter prevents unnecessary material spending while keeping water vapor transmission rates reliably within spec on long production runs.
A spec requiring non-volatile solids to stay within plus or minus 1.0 percent absolute translates directly to a 4 percent allowable variation in delivered wet coat weight.
Discharge
Receiving inspection provides the first defense against out-of-spec raw materials entering converting plants. Each incoming tote or drum lot arrives with a Certificate of Analysis listing non-volatile solids, pH, low-shear viscosity, and specific gravity. QC teams verify these properties before approving transfer into main storage tanks.
Sampling follows ISO 15528 guidelines, drawing representative samples from top, middle, and bottom tank levels to check for settling or phase separation.
Goods-In Verification Protocols
Receiving checks confirm incoming raw materials match technical specifications. Measuring pH with an ISO 979 calibrated glass electrode verifies chemical stability. Anionically stabilized synthetic latex emulsions require an alkaline pH between 8.0 and 9.5; if absorbed carbon dioxide drops batch pH below 7.5, surfactant ionization collapses and causes irreversible coagulation in feed pumps and delivery lines.
Testing non-volatile content confirms delivered active polymer mass against purchasing contracts. Duplicate samples checked on rapid infrared analyzers give initial verification in 15 minutes, followed by full oven drying per ISO 3251. Batches deviating by more than 1.5 percent from nominal solids trigger isolation protocols and commercial claims.
Filterability testing checks for micro-gels that slip past rotational viscometers. Passing a one-liter sample through a 45-micrometer wire mesh screen under vacuum measures grit build-up. These micro-gels stem from localized overheating during reactor synthesis or shear stress during tanker transfer.
Heavy screen residue plugs anilox cells quickly, forcing unscheduled press stops for roll cleaning.
Barrier Quality Assurance and Substrate Mechanics
Verifying barrier performance requires testing cured coated board samples conditioned under ISO 187 rules. Water vapor transmission testing to ISO 15106 or ASTM E96 measures moisture passage across controlled temperature and humidity gradients. Meeting a specification under 5 grams per square meter per 24 hours at 38 degrees Celsius and 90 percent relative humidity requires an unbroken polymer film over all surface fibers.
Grease and oil resistance testing relies on TAPPI T 559 kit solutions or ISO 16532-1 oil penetration tests. Kit solutions blending castor oil, toluene, and heptane rank surface resistance from 1 to 12. Latex coatings applied at 8 grams per square meter on bleached folding boxboard typically hit kit values of 9 to 12.
Microscopic pinholes from poor leveling or entrained foam drop kit numbers below 4, causing immediate oil staining on fast-food packages.
Cobb water absorption testing per ISO 535 measures liquid resistance over 60, 300, or 1800 seconds. An unbleached kraft linerboard that absorbs 150 grams of water per square meter over 1800 seconds drops below 15 grams per square meter when coated with 10 grams per square meter of latex. Cobb values over 25 grams per square meter signal low coat weight, poor film formation, or micro-cracking during converting operations.
| Quality Parameter | Standard Test Method | Acceptable Operating Band | Action Limit / Rejection Threshold | Primary Failure Impact |
|---|---|---|---|---|
| Low-Shear Viscosity | ISO 2555 (RV 20 RPM) | 400 – 600 mPa·s at 23°C | < 350 or > 700 mPa·s | Pumping failure / Sedimentation |
| Non-Volatile Content | ISO 3251 (105°C) | 49.5 – 51.5 % by weight | < 48.5 or > 52.5 % | Coat weight drift / Cost error |
| Fluid pH Level | ISO 979 (Glass Electrode) | 8.3 – 9.2 at 23°C | < 7.8 or > 9.6 | Emulsion instability / Gelation |
| Sieve Residue (45 µm) | ISO 4576 (Filter Mesh) | < 15 mg / kg sample | > 50 mg / kg sample | Anilox cell plugging / Streaks |
| Specific Gravity | ISO 2811 (Pycnometer) | 1.040 – 1.060 g/cm³ | < 1.030 or > 1.070 g/cm³ | Aeration / Composition shift |
Repulpability dictates end-of-life viability for barrier packaging. Standard testing under protocols like PTS-RH 021/97 or CEPI guidelines measures fiber recovery in hydrapulpers. Barrier coatings must break into non-tacky film particles larger than 150 micrometers during pulping so centrifugal cleaners and pressure screens can remove them.
Micro-tacky particles deform, squeeze through screening slots, and deposit on machine wires and drying cylinders during recycling runs.
Tank cleanout and wash-water handling conclude a barrier coating run. Flushing circulation loops with hot alkaline wash solution dissolves dried polymer from chamber walls, hoses, and anilox rolls. Wastewater carrying suspended latex is coagulated with polyaluminum chloride and organic flocculants before heading to industrial effluent treatment.
Discharging untreated wash-water into municipal sewers causes piping blockages and heavy regulatory fines.
Delivered rolls of barrier board must maintain uniform coat weight across the entire width to pass converter audits. Quality documentation tracks lot numbers, bench viscosity readings, wet coat weights, and Cobb values for every master roll. Keeping tight measurement discipline from receiving inspection through flexographic application ensures consistent barrier performance across production runs.
Final acceptance testing verifies that the finished board hits water vapor transmission, Cobb, and repulpability targets without cracking along score lines during converting.