Standardized Liquid Penetration Testing Protocols for Paper Coatings
Standardized liquid penetration testing requires matching dynamic bench exposure times to press dwell durations to accurately predict coating performance.

Kinetics
Fluid displacement through pigment-coated paper structures follows capillary pressure gradients established during raw stock manufacture. When a liquid contacts a coated sheet surface, immediate wetting occurs based on the thermodynamic balance between the liquid surface tension, the solid surface free energy, and the interfacial tension. The Lucas-Washburn relation models this capillary absorption by treating the porous coating matrix as a bundle of non-interconnecting cylindrical capillaries.
Fluid penetration depth scales directly with the square root of time, proportional to the effective pore radius and liquid surface tension, while inversely proportional to dynamic liquid viscosity.
Pore dimensions dictate flow. In pigment coatings, pore size distribution depends heavily on pigment shape factor, particle size distribution, and binder volume concentration. Ground calcium carbonate produces a blocky, highly porous structure with mean pore radii ranging between 0.05 and 0.15 micrometers.
Clay pigments, possessing a platy particle morphology, align parallel to the substrate during coating application and metering, creating narrow, tortuous pathways with pore radii below 0.05 micrometers. Lower pore radii generate higher capillary driving pressures, yet they simultaneously restrict total volumetric liquid flow rates due to viscous drag along pore walls.

Capillary Pressure in Microporous Matrices
Pore radii within ground calcium carbonate topcoats average between 0.05 and 0.20 micrometers. Liquid intake into these microporous networks occurs under extreme capillary pressures, calculated via the Young-Laplace equation. For a test liquid with a surface tension of 72.8 millinewtons per meter and a contact angle approaching zero, capillary pressures within 0.1-micrometer pores exceed 1.4 megapascals.
This pressure drives rapid fluid intake despite short contact times.
Wetting precedes capillary drag. In the first 10 milliseconds of contact, dynamic wetting dominates the interaction. External hydraulic forces, such as those present in printing press nips or liquid application heads, temporarily override pure capillary action, forcing liquid into larger macro-voids and surface micro-cracks before equilibrium wetting angles establish.
| Pigment System | Latex Binder Level (phr) | Mean Pore Radius (μm) | Coating Porosity (%) | Capillary Rate Constant (cm/s0.5) |
|---|---|---|---|---|
| 100% Ground Calcium Carbonate (60% < 2μm) | 11.0 | 0.120 | 31.5 | 0.048 |
| 100% Fine Ground Calcium Carbonate (90% < 2μm) | 11.0 | 0.065 | 26.2 | 0.022 |
| 100% Fine Platy Kaolin Clay | 11.0 | 0.038 | 21.0 | 0.011 |
| 50/50 GCC / Fine Kaolin Blend | 11.0 | 0.072 | 25.8 | 0.029 |
| 80/20 GCC / Engineered Plastic Pigment | 12.5 | 0.145 | 35.0 | 0.061 |
Surface Energy Modulation across Coated Interfaces
Contact angles measured with pure water on styrene-acrylic bound coatings routinely exceed 85 degrees. Synthetic latex binders, co-binders, and surfactant additives alter the surface free energy of the mineral layer. Binder choice shifts porosity.
Latex particles consolidate during drying, forming continuous film structures that partially fill pigment voids and lower the effective surface energy of the capillary walls.
Dispersive and polar surface energy components determine chemical affinity for specific liquid vehicles. High polar surface energy accelerates water uptake, while high dispersive energy favors solvent-based inks and oils. Sizing agents added to the coating color or base sheet, such as alkenyl succinic anhydride or alkyl ketene dimer, migrate to capillary surfaces, raising the contact angle and suppressing capillary-driven liquid penetration.
Water uptake rates in mineral-coated board drop by 65 percent when kaolin clay replaces coarse calcium carbonate at equal binder loadings under 23 degrees Celsius and 50 percent relative humidity conditions.
Dynamic penetration dynamics divide into three clear operational regimes during fluid contact. The initial contact regime lasts from 0 to 10 milliseconds, governed by surface wetting kinetics and droplet impact energy. The capillary drag regime extends from 10 to 500 milliseconds, dominated by Lucas-Washburn pore absorption.
Beyond 500 milliseconds, bulk diffusion and substrate swelling alter the pore architecture, slowing volumetric intake rates. Whether sub-micron particle packing can completely block surfactant-driven penetration without sacrificing ink setting speed remains an open operational question for mineral formulation engineers.

Swell
Substrate dimensional changes begin when water molecules break hydrogen bonds within the cellulose network beneath the coating layer. Liquid passing through coating pinholes or traversing the mineral matrix contacts the underlying fiber network within milliseconds. Water absorption into fiber walls causes individual wood fibers to expand in cross-sectional diameter by 15 to 20 percent, while axial fiber length changes by less than 1 percent.
This anisotropic volume expansion exerts mechanical stress on the brittle, mineral-rich topcoat above it.
Hydration breaks internal bonds. Base sheet expansion distorts microstructures, altering the pore void volume of the coating layer. As fibers expand in the z-direction, the micro-porous coating layer cracks along inter-pigment binder lines, creating secondary liquid micro-channels that bypass the original capillary network.
This structural failure increases liquid penetration rates beyond initial Lucas-Washburn predictions.
Polymer Matrix Hydration Mechanics
Latex film network integrity degrades as water plasticizes carboxylated styrene-butadiene or styrene-acrylic binder chains. Polyvinyl alcohol and starch co-binders exhibit rapid moisture absorption, expanding in volume and softening at elevated moisture levels. Co-binder swelling closes small pigment voids, temporarily reducing liquid permeability until the binder structure dissolves or delaminates under hydraulic shear forces.
Binder choice controls network elasticity during fluid exposure. Binders with high glass transition temperatures resist mechanical deformation under moisture stress but fracture easily when the base sheet expands. Binders with lower glass transition temperatures yield elastically, accommodating base sheet dimensional movement without structural cracking, though they offer lower resistance to oil and solvent penetration.
Fiber Substrate Volume Expansion under Wetting
Uncoated base sheet z-directional bulk expands up to 15 percent within 200 milliseconds of fluid contact. Mechanical pulp fibers, containing high lignin content, swell slower than fully bleached chemical pulp fibers but retain structural rigidity longer under wet conditions. Recycled fibers, having suffered hornification during previous drying cycles, exhibit lower swelling capacity than virgin fibers, reducing dimensional movement while increasing sheet porosity and void liquid storage capacity.
- Coating Delamination occurs when fiber swelling stress exceeds the dry pick and wet bond strength of the binder layer, causing complete sheet splitting.
- Binder Migration Release occurs as soluble co-binders dissolve during liquid penetration, creating localized weak zones within the pigment matrix.
- Fiber Puffing manifests when heatset drying rapidly vaporizes absorbed liquid beneath the coating, driving steam through the mineral layer and raising localized surface bumps.
- Moisture-Induced Mottle happens when non-uniform liquid absorption across heterogeneous fiber density zones causes uneven ink transfer and localized gloss variations.
A contract specification demanding zero wet delamination fails if binder content drops below 10 parts per hundred pigment relative to dry fiber mass.
Coating layers with high binder ratios maintain barrier continuity under moisture stress better than porous pigment-dominated layers.
Apparatus
Measurement systems for liquid uptake divide into static volumetric tools and dynamic optical or acoustic monitors. Traditional standardized methods measure bulk liquid mass absorbed over long duration exposures, whereas modern dynamic testing equipment tracks millisecond-scale absorption events relevant to converting and printing operations. Selecting appropriate testing apparatus requires matching instrument measurement windows to actual press or converting line exposure times.
Gravimetric methods miss early dynamics. Standard testing protocols measure total liquid weight gain per unit surface area over exposure times ranging from 30 seconds to several minutes. While gravimetric tests provide actionable quality control benchmarks for barrier boards, they fail to capture initial wetting phenomena, micro-pore capillary intake, or rapid solvent separation occurring in high-speed offset or flexographic printing nips.
Standardized Laboratory Test Method Comparison
Gravimetric evaluations measure total mass gain over defined contact windows starting at 30 seconds. The ISO 535 Cobb test uses a standardized metal cylinder defining a 100 square centimeter test area, clamped firmly against the substrate with a rubber gasket. A measured volume of water contacts the sample for a specified duration, after which the water is discarded, excess liquid is blotted under a standardized 10-kilogram roller, and the sample is re-weighed to determine absorbed mass in grams per square meter.
Optical absorption monitors, such as the TAPPI T 530 Hercules Size Tester, measure the reduction in specular or diffuse light reflectance as a dye-stained liquid penetrates from the back surface to the front surface of the sheet. The instrument records the elapsed time in seconds required for reflectance to drop to a predetermined percentage of its initial value, providing a combined measure of liquid penetration rate and sheet opacity changes.
| Test Instrument | Governing Standard | Measurement Principle | Dynamic Time Range | Typical Precision Range |
|---|---|---|---|---|
| Cobb Sizing Tester | ISO 535 / TAPPI T 441 | Gravimetric mass differential | 30 s to 1800 s | ± 0.5 g/m² |
| Hercules Size Tester (HST) | TAPPI T 530 | Optical reflectance attenuation | 1 s to 1000 s | ± 5.0 % elapsed time |
| Bristow Dynamic Wheel | TAPPI T 553 / ASTM D8252 | Volumetric track length transfer | 10 ms to 2000 ms | ± 0.8 mL/m² |
| Ultrasonic Penetration Analyzer (PDA) | ISO 16532-2 Annex B | Acoustic signal attenuation | 1 ms to 60 s | ± 2.0 % signal intensity |
| Cahn Dynamic Contact Angle | TAPPI T 558 | Tensiometric wetting force | 10 ms to 10 s | ± 1.5 mN/m force |
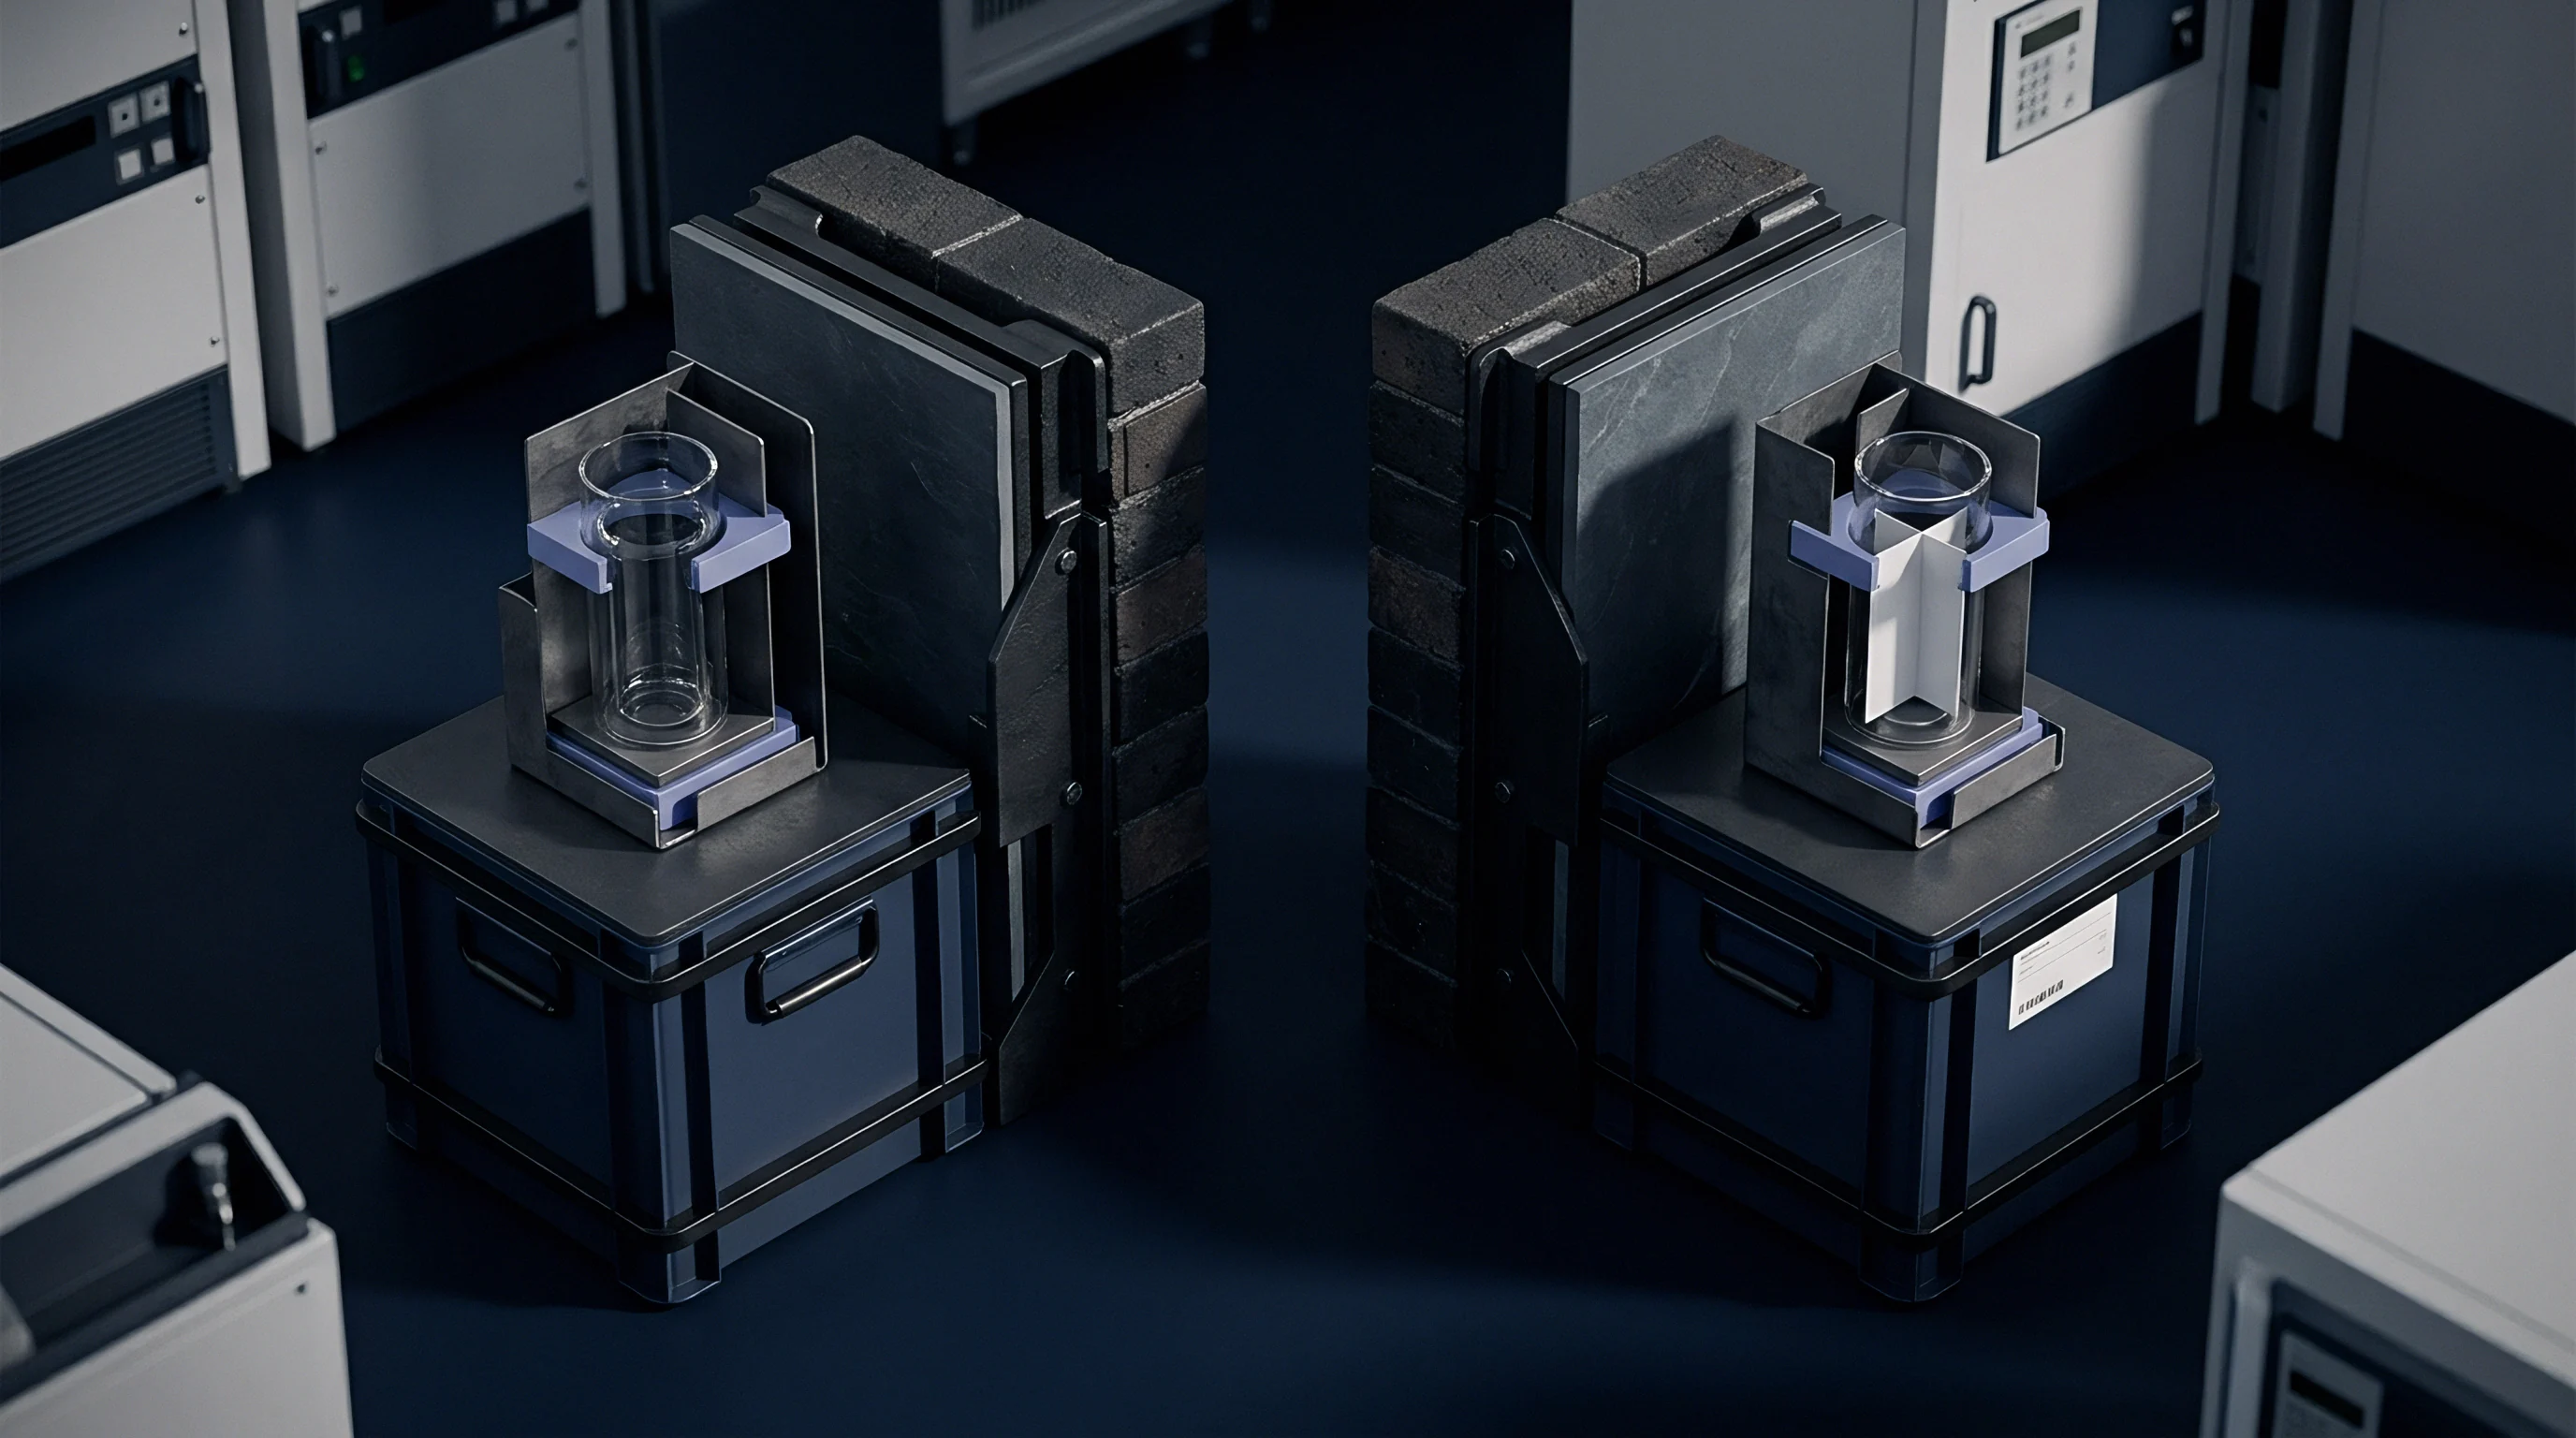
Ultrasonic Attenuation for Sub-Second Penetration Mapping
High-frequency acoustic waves pass through paper stock clamped between piezoelectric transducers within liquid-filled test cells. Sound transmission speeds and signal amplitude depend directly on the density, elasticity, and liquid content of the substrate matrix. As liquid penetrates the coating layer and enters the base sheet, air trapped within pore spaces escapes, causing a rapid decrease or transient spike in acoustic amplitude followed by exponential signal decay.
Acoustic signals trace liquid fronts. Ultrasonic penetration instruments record attenuation curves continuously with millisecond temporal resolution. The initial signal drop correlates with surface wetting and air displacement from coating pores, while the secondary slope measures liquid progress through the base fiber network.
This allows precise differentiation between topcoat barrier resistance and base sheet absorbency.
Standardized tests measuring absorption beyond 30 seconds fail to detect short-duration pinhole penetration events occurring in 5-millisecond metering nips.
Mill technical representatives frequently explain away high Cobb variability by blaming ambient laboratory humidity shifts during sample preparation.

Solvent
Test fluids require strict chemical calibration to isolate specific penetration mechanisms during bench trials. Water alone fails to evaluate coating performance for complex commercial applications such as offset printing with fountain solutions, flexographic printing with water-borne inks, or frozen food packaging exposed to fats and organic acids. Standardizing test solvent surface tension, polar-dispersive ratios, viscosity, and temperature ensures reproducible qualification data.
Viscosity alters absorption rates. Adding isopropyl alcohol or glycol ethers to deionized water lowers liquid surface tension from 72.8 millinewtons per meter down to target ranges between 30 and 45 millinewtons per meter, simulating the wetting behavior of commercial fountain solutions. Lowering surface tension eliminates the thermodynamic wetting barrier, allowing rapid capillary penetration into hydrophobic micro-pores that resist pure water intake.
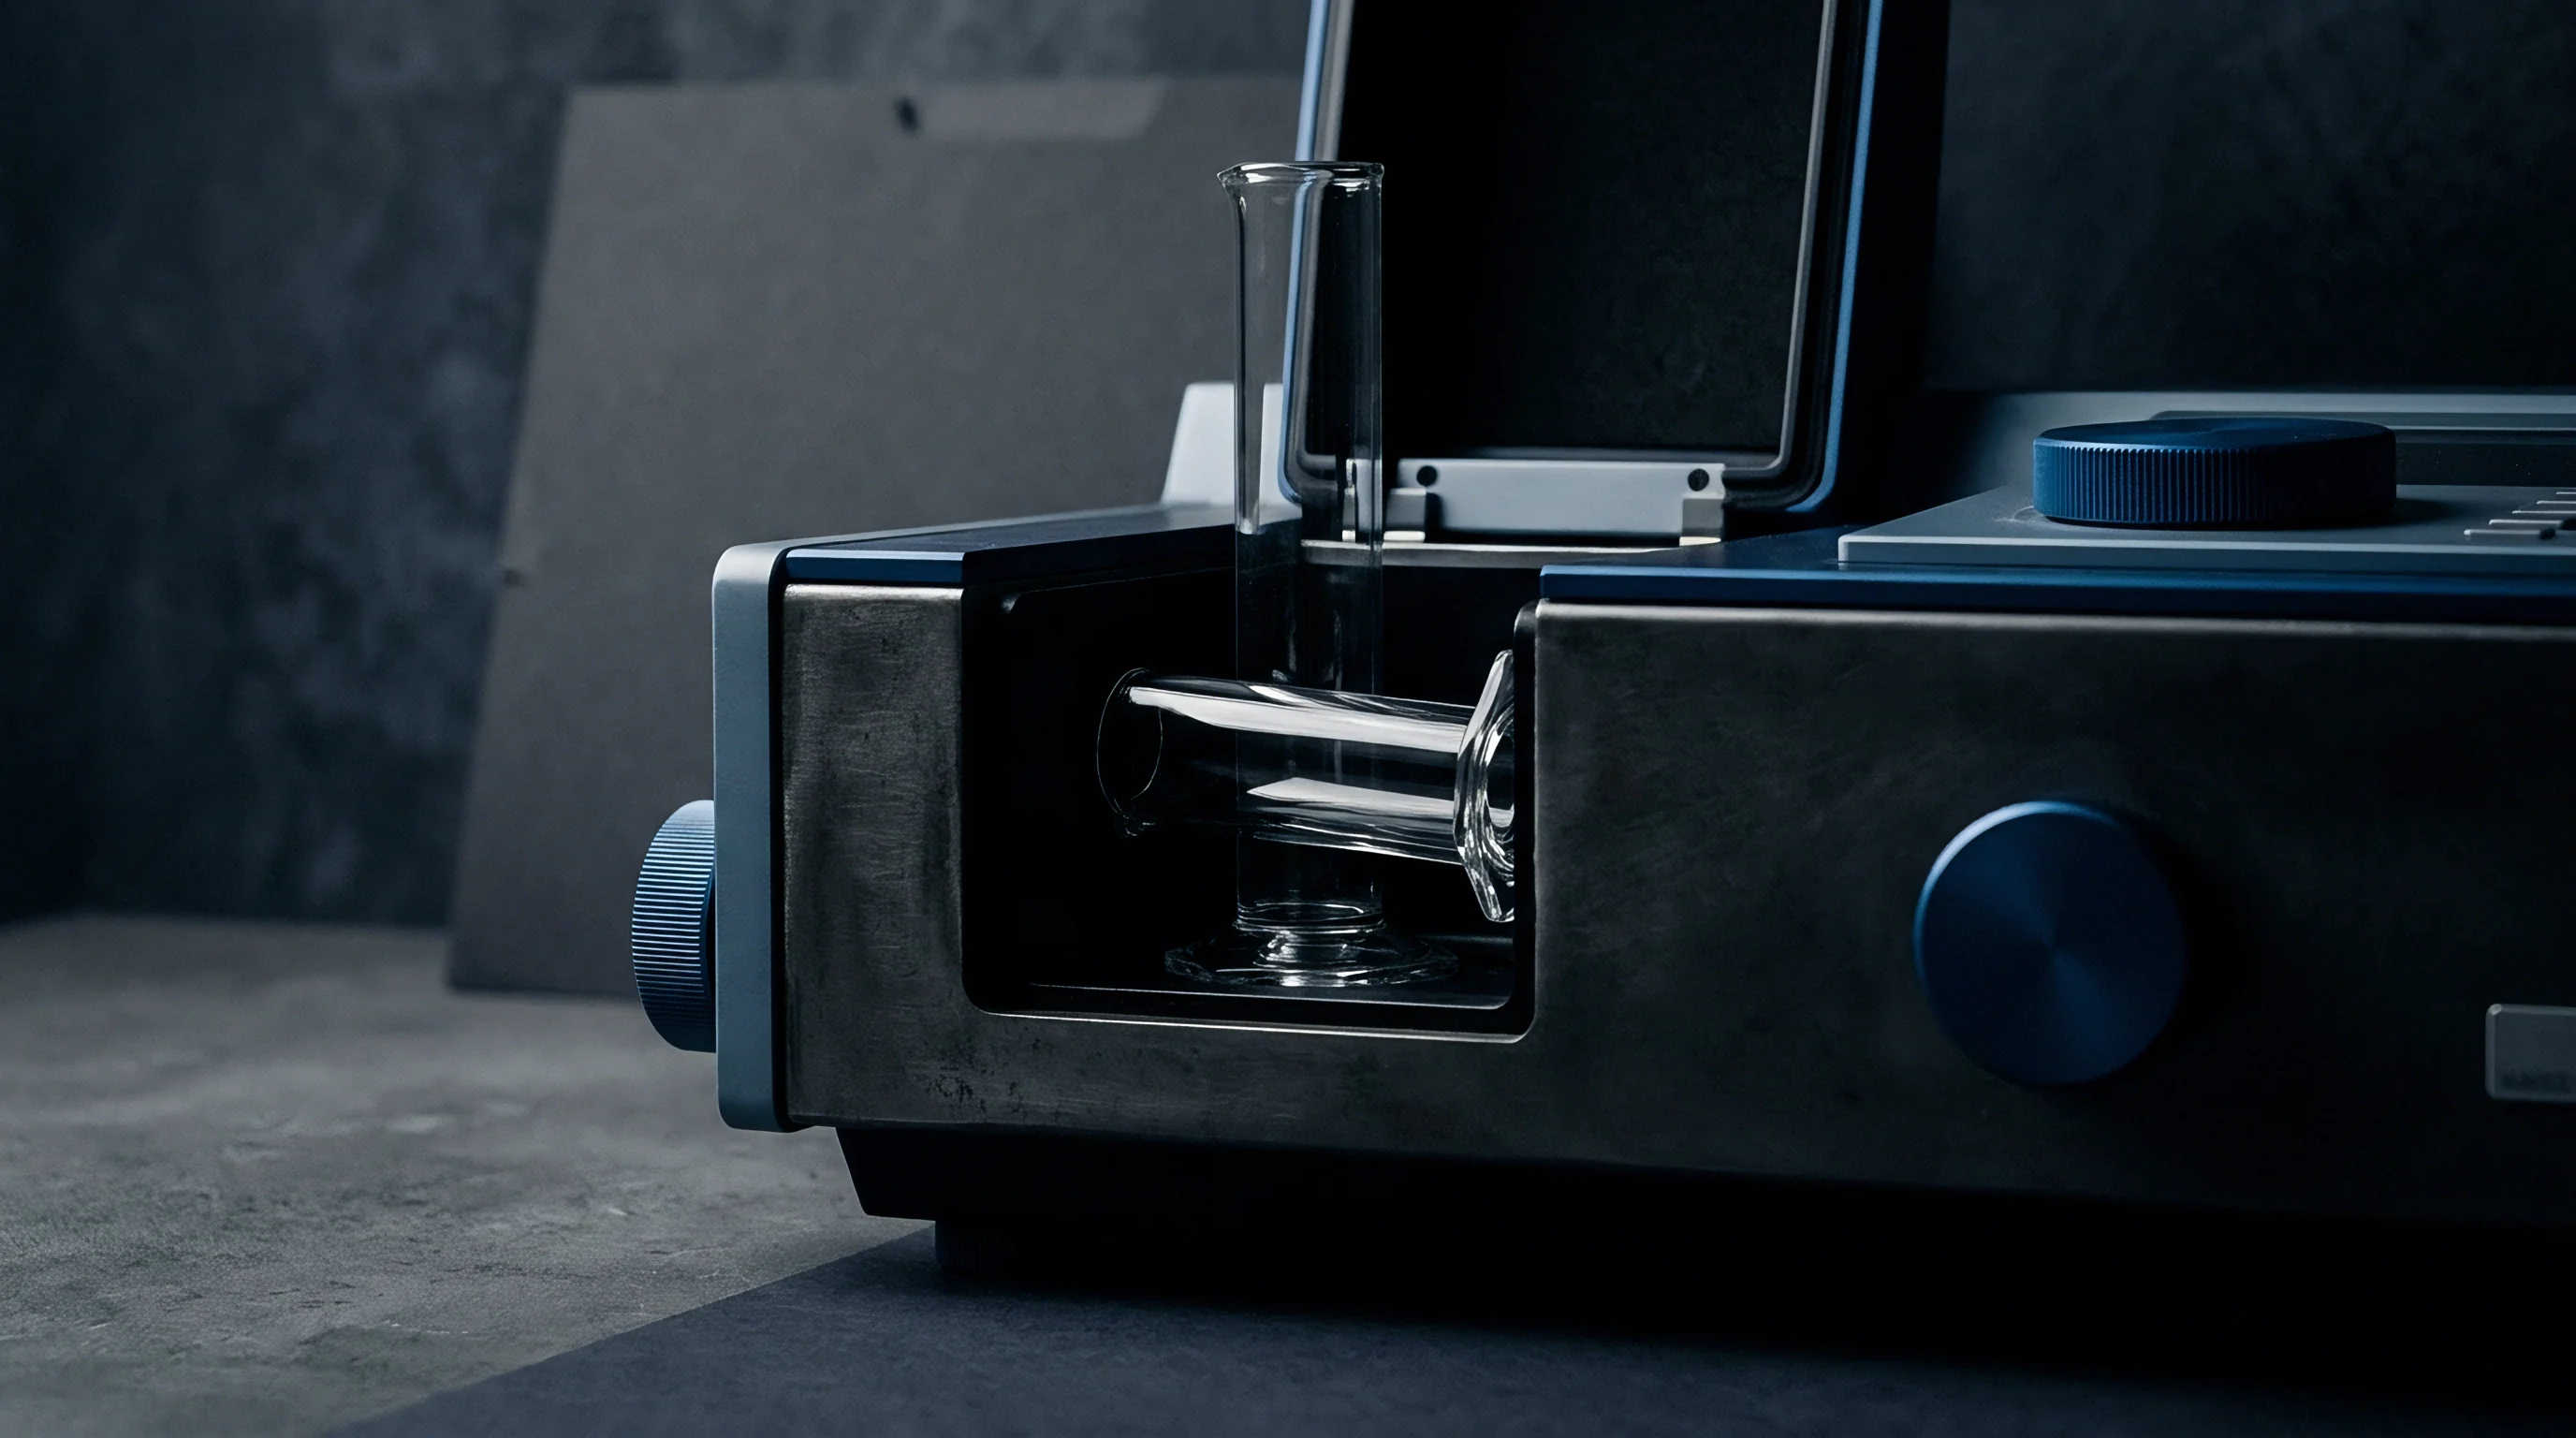
Surface Tension and Viscosity Controls in Test Fluids
Polar liquid surface tension targets set at 72.8 millinewtons per meter ensure consistent wetting behavior during standard Cobb testing. Modifying test liquids with non-ionic surfactants alters the contact angle without altering liquid viscosity. Surfactants collapse surface energy barriers, driving rapid wetting across hydrophobic binder films.
Oils and organic solvents test dispersive structural resistance. Mineral oil, castor oil, and dibutyl phthalate act as pure non-polar test liquids, penetrating exclusively through capillary voids without inducing hydrogen bond breakdown or fiber swelling in the base sheet. The rate of oil absorption provides a direct measurement of physical pore void volume and tortuosity independent of chemical sizing effects.

Aggressive Reagent Interactions in Liquid Packaging Stock
Lactic acid solutions at 1 percent concentration test raw edge wicking resistance on poly-coated board stock destined for liquid packaging. Lactic acid acts as a surfactant while chemically attacking starch-based surface sizing agents and wet-strength resins. Standardized protocols specify 24-hour immersion tests at 23 degrees Celsius, measuring total edge penetration depth in millimeters under optical stereomicroscopes.
- Prepare standardized 20 percent isopropyl alcohol test solution maintained at 23 degrees Celsius and 50 percent relative humidity.
- Clamp substrate sample into the dynamic liquid absorption cell at 100 kilopascals pneumatic sealing pressure.
- Dispense 0.5 milliliters of calibrated test fluid onto the sample surface within an automated 10-millisecond window.
- Record acoustic transmission intensity or optical reflection decay curves continuously over a 30-second measurement duration.
- Calculate liquid uptake rate in milliliters per square meter per square root second from the linear capillary phase slope.
Test liquid surface tension drifts by up to 3 millinewtons per meter per hour when volatile alcohol components evaporate from open laboratory test reservoirs.
Section 4.2 of ISO 16532-1 mandates zero pinhole penetration over 10 minutes, forcing mills to replace standard size-press starches with fluorocarbon-free synthetic barriers.
Discrepancy
Laboratory measurements under static pressure frequently fail to predict offset press fountain solution transfer. Traditional bench tests apply liquid under zero external head pressure over extended exposure durations. Commercial converting equipment subjects coated paper to extreme dynamic shear, elevated temperatures, and short hydraulic pressure pulses inside roll nips, creating penetration mechanics completely absent in static laboratory environments.
Static tests ignore press speed. In a high-speed offset printing press running at 15 meters per second, the contact time within a printing nip spans less than 2 milliseconds. Hydraulic nip pressures reach 1.5 to 3.0 megapascals, forcing liquid past hydrophobic surface barriers and into macro-voids before chemical sizing agents can establish thermodynamic resistance.
Why Do Standard Bench Tests Fail on High Speed Lines?
Printing nips exert dynamic hydraulic pulses reaching 3.0 megapascals over two milliseconds. Dynamic fluid pressure forces ink vehicles and fountain solution into surface micro-cracks and defect pinholes, overriding low capillary drive potentials. A coating showing low Cobb absorption values under static bench conditions can exhibit severe liquid uptake and surface delamination when subjected to repeated high-pressure press impressions.
Pressure drives fluid past barriers. Temperature spikes inside heatset dryer tunnels further accelerate liquid penetration and vapor pressure buildup. As web temperatures exceed 120 degrees Celsius, trapped liquid within the base sheet vaporizes rapidly, exerting outward steam pressure that blisters or delaminates low-permeability topcoats.
- Verification of Dynamic Dwell Time ensures test exposure windows match actual press nip durations between 1 and 10 milliseconds.
- Audit of Coating Pore Distribution confirms micropore ratios are sufficient to prevent bulk ink vehicle drainage while allowing controlled fountain solution setting.
- Evaluation of Hydraulic Shear Resistance identifies coating layers susceptible to binder breakdown under 2.0 megapascal printing nip forces.
- Cross-Checking Shear Viscosity against Dynamic Uptake isolates surfactant-driven wetting failure from structural capillary penetration.
A board lot certified at 20 grams per square meter Cobb absorption can still undergo wet pick delamination if nip pressures exceed 2.5 megapascals.
Mismatched wetting characteristics between laboratory testing and press conditions lead to delamination, ink mottle, and total rejection of converted packaging lots.
Threshold
Commercial target specifications establish pass-fail criteria for liquid absorption based on converting speed and ink system chemistry. Substrate buyers write precise quantitative thresholds into procurement contracts to guarantee stock runnability while avoiding unnecessary coat weight additions. Specifying excessively tight absorption tolerances increases mill pulp and chemical costs, driving up landed substrate pricing per delivered metric tonne.
Excessive sizing drives up costs. Mills achieve low liquid penetration numbers by adding synthetic internal sizing agents, increasing latex binder ratios, or applying heavier mineral topcoat weights. Raising latex binder levels from 10 to 14 parts per hundred pigment increases raw material costs by approximately 18 to 25 USD per tonne of board, while reducing sheet stiffness and brightness.
Commercial Specification Targets and Quality Control Limits
Quality assurance departments set Cobb 60 values below 25 grams per square meter for high-humidity carton stock. For standard offset printing grades, Hercules Size Test values between 30 and 80 seconds prevent ink vehicle strike-through while enabling fast ink setting rates. Exceeding 120 seconds in HST testing causes slow ink drying, leading to set-off smudging and extended turn-around times in converting departments.
Yield drops as coat weight rises. Applying extra coating weight to seal base sheet defects increases total basis weight without adding structural stiffness. A buyer purchasing board on a area yield basis loses converting surface area per tonne of purchased stock when coat weights are increased to meet overly aggressive fluid barrier specifications.
| Coating Coat Weight (g/m²) | Latex Level (phr) | Cobb 60 Value (g/m²) | HST Value (s) | Relative Yield Shift (%) | Cost Impact (USD/Tonne) |
|---|---|---|---|---|---|
| 8.0 (Single Coat) | 9.0 | 45.0 | 12 | + 3.2 | Base Price |
| 12.0 (Single Coat) | 11.0 | 28.0 | 42 | Base Yield | + $ 14.50 |
| 16.0 (Double Coat) | 12.5 | 20.0 | 85 | – 2.8 | + $ 38.00 |
| 20.0 (Double Coat) | 14.0 | 15.0 | 160 | – 5.1 | + $ 62.50 |
| 24.0 (Triple Barrier) | 16.0 | 8.0 | 350 | – 7.8 | + $ 95.00 |
Yield Impact of Heavy Coating Application
Applying 18 grams per square meter of mineral formulation increases board sheet weight and reduces per-tonne carton yield. A packaging converter purchasing 250 g/m2 board with an over-specified 22 g/m2 coating layer receives 4.2 percent fewer printable parent sheets per metric tonne compared to stock produced with a 12 g/m2 coat weight. Sourcing optimization requires balancing absolute barrier performance against sheet yield loss.
Formulation adjustments must be evaluated through total landed cost models. A 2 percent reject rate at the printing press due to ink mottle costs less than paying a $40 per tonne mill premium for over-engineered barrier coatings across an entire annual volume contract. Establishing realistic, application-specific liquid penetration limits protects converting margins without over-paying for unnecessary substrate performance.
Selecting an intermediate coat weight combined with surface sizing balances fluid holdout requirements against sheet yield, securing predictable runnability across converting operations.