Analytical Verification Methods for Resin Identification in Barrier Paperboard Conversions
Attenuated total reflectance infrared spectroscopy combined with thermal analysis isolates extrusion resins from dispersion coatings to verify repulpability.
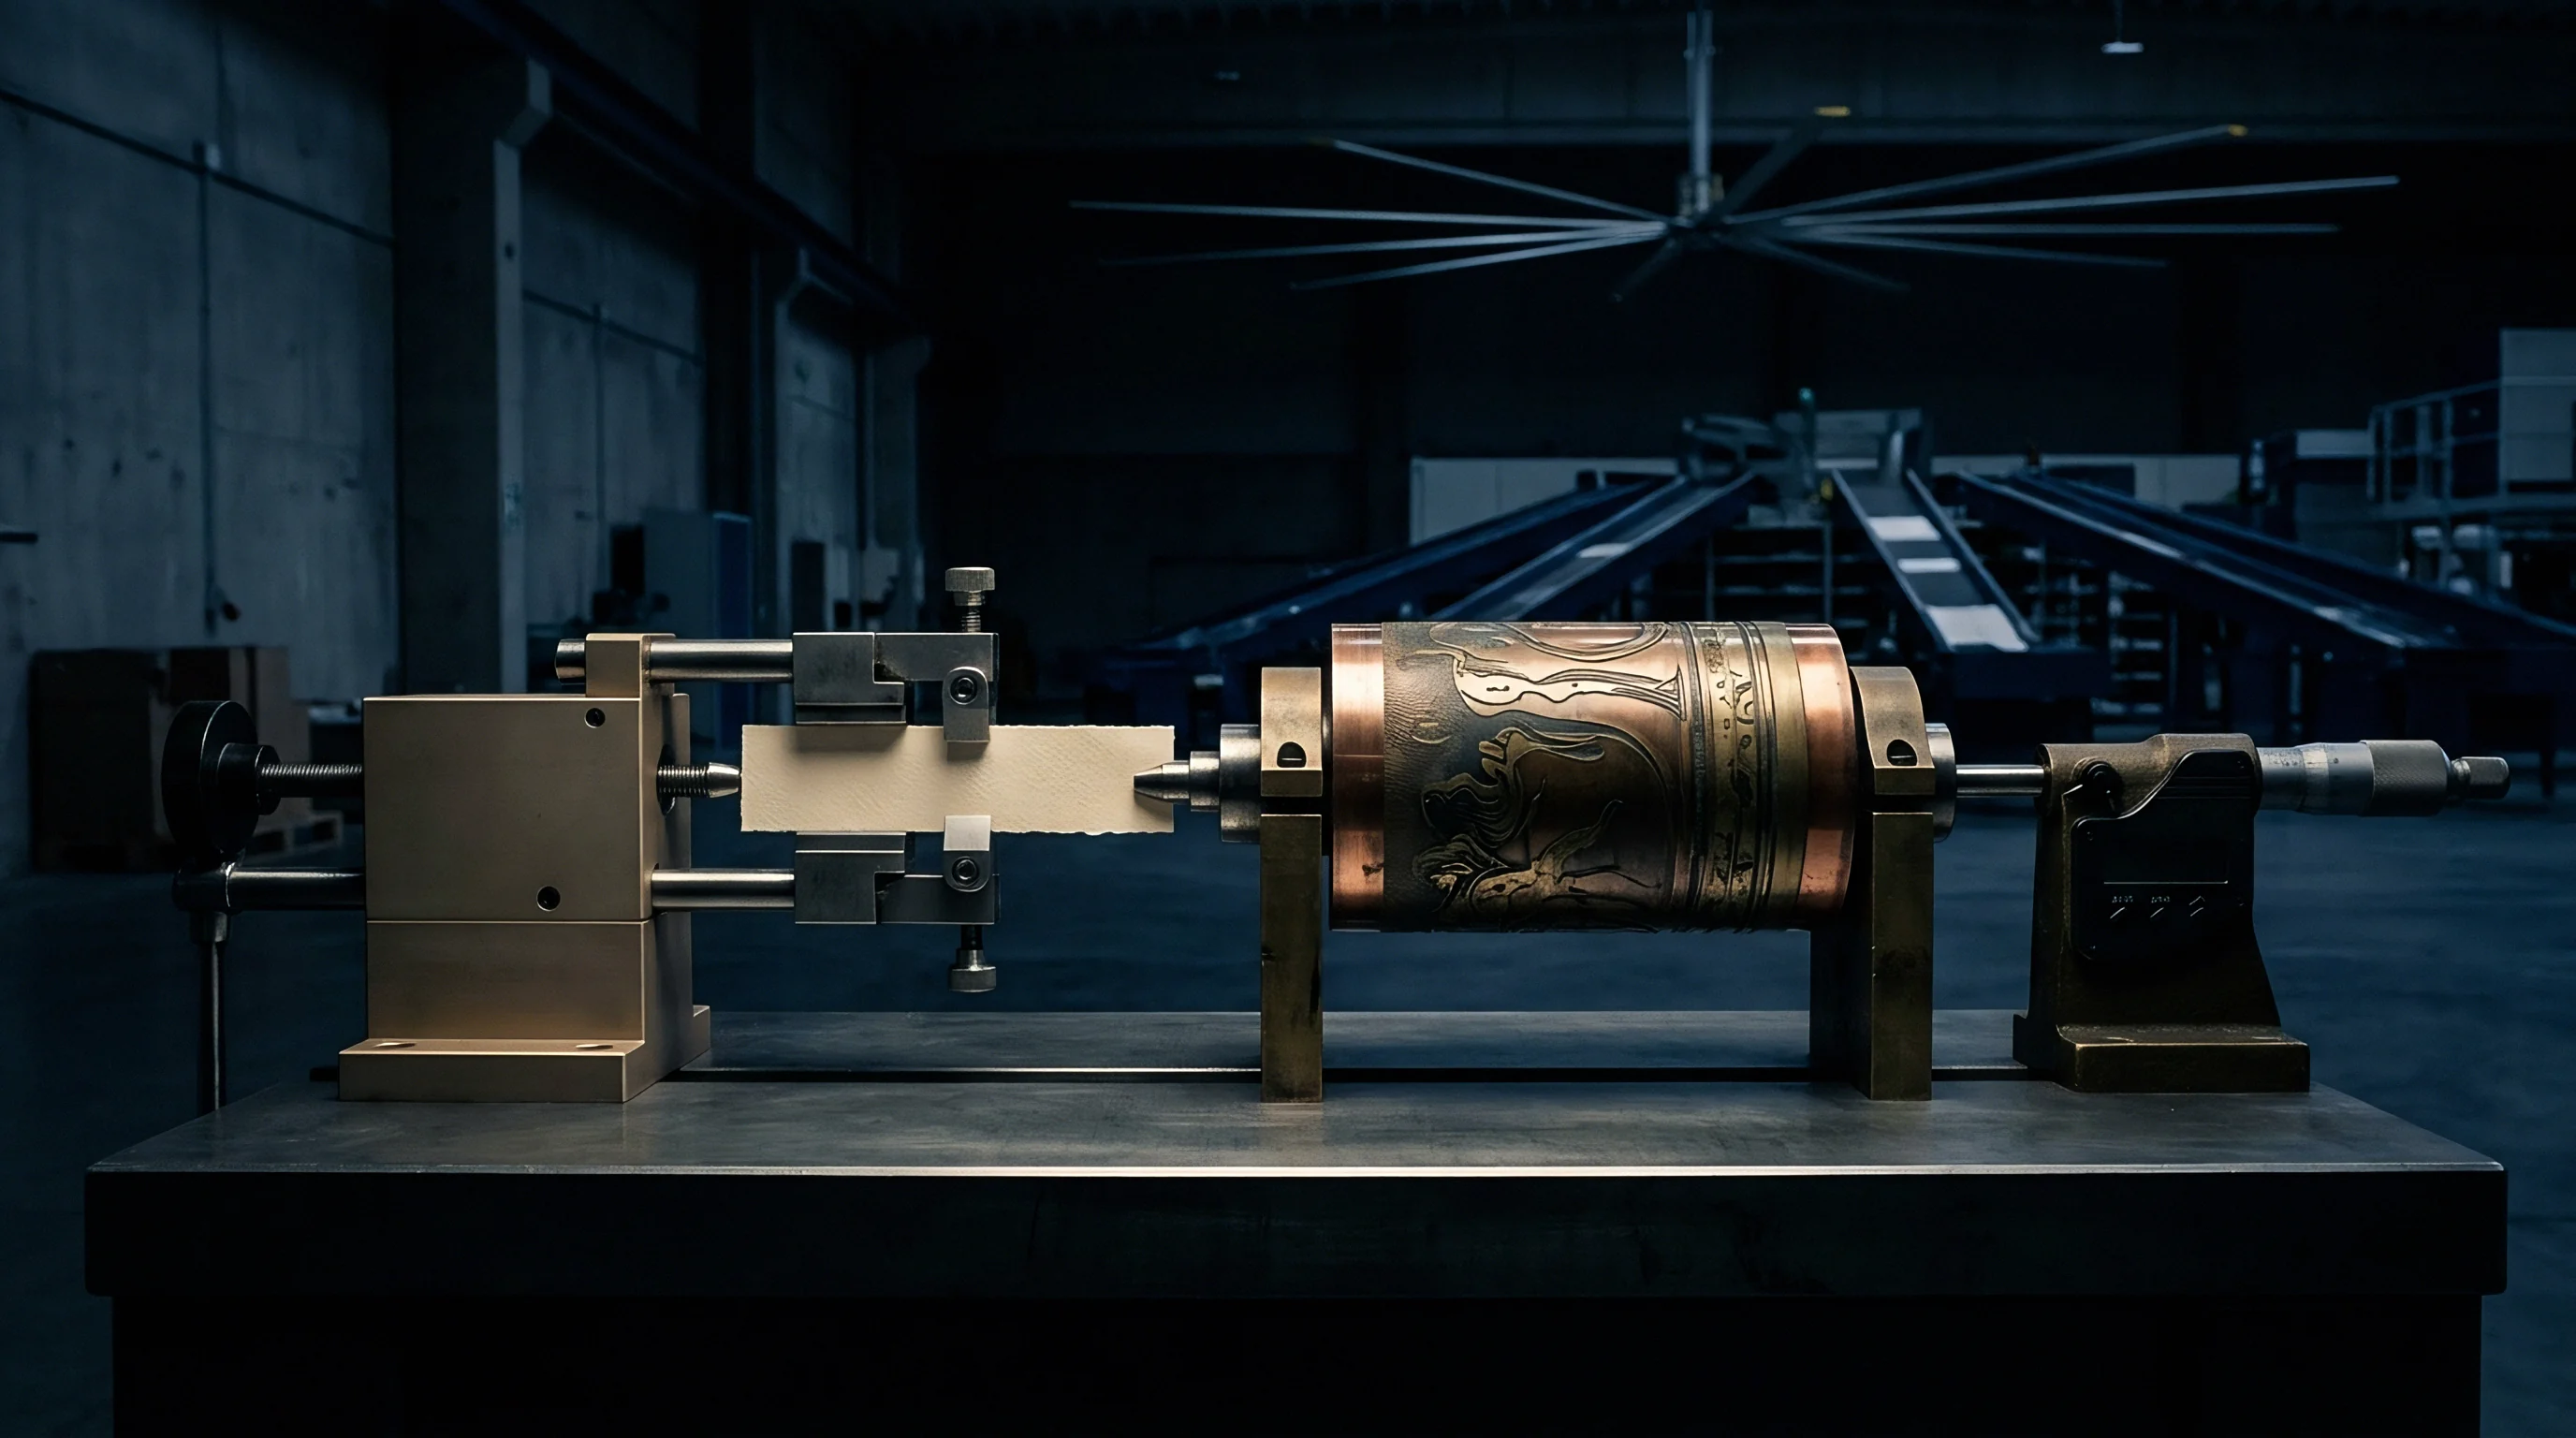

Probe
Analytical isolation of barrier polymer layers from paperboard substrates requires strict physical separation prior to spectroscopic measurement. Direct surface illumination of coated paperboard often produces confounded spectra because infrared beam attenuation depths frequently exceed the barrier resin layer thickness. Bleached kraft cellulose fibers, kaolin clay topcoats, and starch sizing agents contribute strong absorption bands that mask low-density polyethylene, ethylene vinyl alcohol, and acrylic dispersion polymers.
Establishing absolute polymer identity demands isolation techniques that eliminate substrate optical interference while preserving the chemical structure of the resin.

Substrate Layer Isolation and Cross-Sectional Preparation
Physical separation of barrier films begins with cryogenic mechanical splitting or chemical solvent digestion. Cryogenic cleavage yields clean interfaces without thermal plastic deformation that alters polymer crystallinity. Immersing paperboard samples in liquid nitrogen at minus one hundred ninety-six degrees Celsius embrittles both the fiber matrix and the extruded polymer.
Mechanical shearing along the interface yields a distinct foil or film flake suitable for isolated transmission or reflectance analysis. When mechanical peeling introduces fiber tearing, solvent extraction using selective organic liquids isolates the target resin without dissolving the underlying paper fibers.
Cross-sectional preparation provides direct access to multi-layer barrier structures where co-extruded films contain discrete functional layers. Rotary microtomy using tungsten carbide or diamond knives produces smooth transverse cuts down to two micrometers in thickness. Securing the microtomed section in a mechanicalVice clamp allows localized spectral probing across the barrier profile.
Cold nitrogen embrittles plastic. Direct examination across the cross-section reveals discrete layer thicknesses, tie-resin boundaries, and pinhole defects that impair barrier performance.
- Cool the board sample to minus forty degrees Celsius using liquid nitrogen vapor to embrittle the polymer film.
- Slice a cross-section using a motorized rotary microtome equipped with a glass knife to prevent thermal smearing across the fiber interface.
- Clamp the section in a mechanical vice fixture to expose the barrier resin boundary directly to the attenuated total reflectance crystal.
- Measure the spectrum at three discrete points along the machine direction to verify local coating uniformity.
ATR Penetration Depth and Refractive Index Matching
Attenuated Total Reflectance Fourier Transform Infrared spectroscopy relies on an evanescent wave generated at the boundary between a high refractive index crystal and the sample. The depth of penetration of this evanescent wave varies directly with the infrared radiation wavelength and inversely with the refractive index difference between crystal and polymer. Using a zinc selenide crystal with a refractive index of two point four yields a penetration depth exceeding two micrometers at two thousand wavenumbers.
This penetration depth reaches deep into thin aqueous dispersion coatings, capturing background cellulose absorption bands from the paperboard substrate.
Polymer layers thinner than the attenuation depth of the germanium crystal require physical microtomy before surface reflectance yields clean spectra.
Substituting a germanium crystal, which possesses a refractive index of four point zero, reduces the depth of penetration to less than zero point6 micrometers across the mid-infrared spectrum. High refractive index crystals isolate surface barrier resins from underlying fiber matrices without mechanical separation. Precise optical contact remains mandatory.
Inadequate clamping pressure introduces air gaps that attenuate the internal reflection signal, distorting baseline ratios and masking functional group absorption peaks.
| Sampling Mode | Crystal / Medium | Penetration Depth | Substrate Interference Risk | Sample Preparation Time |
|---|---|---|---|---|
| ZnSe (n = 2.4) | 1.5 to 3.2 µm | High on coatings below 5 µm | Minimal (direct contact) | |
| Ge (n = 4.0) | 0.3 to 0.8 µm | Low for surface resin layers | Minimal (high clamp pressure) | |
| Air / KBr aperture | Full layer thickness | Zero (isolated film fragment) | High (microtomy required) | |
| Gold mirror backing | Double pass thickness | Extreme (refractive index distortion) | Moderate (peeled layer) |
Mill technical sheets frequently claim that a proprietary dispersion formulation contains pure acrylic polymers when infrared absorbance peaks reveal styrene cross-linking additives.

Spectra
Spectroscopic verification of barrier resins relies on identifying diagnostic vibrational absorption bands within the mid-infrared region from four thousand to four hundred reciprocal centimeters. Infrared absorption frequencies correspond to specific chemical bond stretching and bending modes, providing an unambiguous chemical fingerprint for every commercial resin grade. Distinguishing low-density polyethylene from bio-based polyesters or halogenated vinylidene chloride polymers requires exact peak matching against standardized reference spectra libraries.
Infrared Band Assignments for Extrusion and Dispersion Resins
Polyolefin extrusion coatings exhibit sharp, characteristic hydrocarbon absorption bands. Low-density polyethylene produces intense asymmetric and symmetric C-H stretching vibrations at twenty-nine hundred sixteen and twenty-eight hundred forty-eight reciprocal centimeters. The methylene bending doublet at fourteen hundred seventy-three and fourteen hundred sixty-three reciprocal centimeters confirms polyolefin crystallinity.
Polypropylene adds a strong methyl C-H stretching band at twenty-nine hundred fifty-two reciprocal centimeters and a methyl bending singlet at thirteen hundred seventy-seven reciprocal centimeters, enabling immediate discrimination between polyolefin types on paperboard packaging lines.
Polar barrier resins feature intense carbonyl and hydroxyl absorption bands that distinguish them from non-polar hydrocarbon films. Bio-based packaging materials such as polylactic acid exhibit a dominant ester carbonyl stretching peak at seventeen hundred fifty-four reciprocal centimeters, coupled with C-O ester linkage band doublet at eleven hundred eighty-two and ten hundred eighty-two reciprocal centimeters. Polybutylene succinate shifts this ester carbonyl absorption to seventeen hundred twelve reciprocal centimeters due to differing alkyl chain conjugation.
Peak position identifies functional groups.
Attenuated total reflectance spectra recorded at four wavenumber resolution show the ester carbonyl absorption of polybutylene succinate at seventeen hundred and twelve reciprocal centimeters.
Ethylene vinyl alcohol copolymers combine polyolefin methylene bands with a broad hydroxyl stretching band centered at thirty-three hundred thirty reciprocal centimeters. The baseline FTIR absorption peak for ethylene-vinyl alcohol copolymer hydroxyl groups at thirty-three hundred thirty reciprocal centimeters with a thirty-two mol percent ethylene content rests on ISO 13922 spectrophotometric calibration curves established across forty mill lots in 2021; shifting the ethylene content to forty-four mol percent depresses this peak intensity by eighteen percent and broadens the alkyl C-H stretch band at twenty-nine hundred twenty reciprocal centimeters. Infrared spectra confirm polymer identity.
Deconvolution of Overlapping Fiber and Polymer Absorbance Bands
Direct ATR measurement of thin acrylic dispersion coatings produces severe spectral overlap between paperboard cellulose signals and polymer ester absorptions. Paperboard cellulose exhibits broad, intense O-H and C-O absorption bands spanning thirty-four hundred to thirty-one hundred reciprocal centimeters and eleven hundred to nine hundred fifty reciprocal centimeters. Fiber signals overlap polymer absorbance.
Mathematical baseline correction and spectral subtraction isolate the resin signal by subtracting a pure uncoated substrate reference spectrum from the composite converted paperboard spectrum.
Second-derivative spectral processing resolves closely spaced absorption shoulder peaks that remain hidden in raw absorbance spectra. Derivative mathematical algorithms separate the styrene ring aromatic C=C stretching peak at sixteen hundred two reciprocal centimeters from adjacent water vapor and acrylic carbonyl absorption wings. Quantifying the peak height ratio between the styrene aromatic band and the acrylic butyl ester carbonyl band at seventeen hundred thirty reciprocal centimeters establishes the exact monomer copolymer ratio within styrene-acrylic barrier dispersions.
- Ester Hydrolysis Decay reduces seal strength when ambient humidity during storage exceeds seventy percent relative humidity.
- Styrene Phase Separation induces micro-cracking across fold lines during high-speed carton converting.
- Pinhole Pin-Welding occurs when localized resin voids expose raw paperboard fibers to aqueous liquid penetrants.
- Thermal Oxidation Gelation forms hard particles inside extrusion dies that create continuous strike-through tracks on the sheet.
| Resin Type | Primary Absorption Band (cm⁻¹) | Vibrational Assignment | Secondary Diagnostic Band (cm⁻¹) |
|---|---|---|---|
| 2916 / 2848 | Asymmetric / Symmetric C-H stretch | 1473 / 1463 (doublet) | |
| 2952 | Asymmetric CH3 stretch | 1377 (CH3 bend singlet) | |
| 1754 | Ester carbonyl C=O stretch | 1182 / 1082 (C-O-C stretch) | |
| 1712 | Ester carbonyl C=O stretch | 1156 (succinate C-O stretch) | |
| 3330 | Hydroxyl O-H broad stretch | 2920 / 2850 (alkane C-H) | |
| 1040 / 753 | C-Cl stretching modes | 1406 (CH2 scissor next to CCl2) | |
| Spectra recorded via single-reflection diamond ATR crystal at 4 cm⁻¹ spectral resolution with 32 co-added scans. | |||
Misidentifying a bio-polyester as low-density polyethylene during incoming resin verification leads to immediate die blockage and severe financial losses in downstream converting.

Thermal
Thermal analysis methods verify barrier resin identity by measuring physical phase transitions and thermal degradation kinetics as functions of temperature. Polymer morphology, crystalline melting points, glass transition temperatures, and thermal oxidation onset profiles provide precise identification parameters. Differential Scanning Calorimetry and Thermogravimetric Analysis resolve resin blends that exhibit identical functional group chemistry in infrared spectroscopy.
Can Differential Scanning Calorimetry Separate Polyethylene from Polybutylene Succinate?
Differential Scanning Calorimetry measures heat flow into or out of a polymer sample relative to an inert reference under controlled heating ramps. Extrusion-grade low-density polyethylene displays a broad crystalline melting endotherm centered between one hundred eight and one hundred fifteen degrees Celsius. Polybutylene succinate exhibits a distinct, sharper melting endotherm between one hundred13 and one hundred18 degrees Celsius.
Standard heating ramps of ten degrees per minute frequently result in overlapping melting peaks when analyzing physical blends of LDPE and PBS on converted board.
Controlled cooling and second-heating thermal cycles separate these adjacent melting events. The reported enthalpy of fusion for one hundred percent crystalline polybutylene succinate at one hundred ten Joules per gram derives from classical Flory-Huggins melting point depression fits published by polymer research groups in 2018; acquiring a co-polyester grade with five percent adipate co-monomer content drops the theoretical heat of fusion to ninety-four Joules per gram, altering crystalline fraction calculations by up to fourteen percent. DSC tracks thermal phase changes.
Heating the sample past its initial melting point to one hundred eighty degrees Celsius, holding isothermally for five minutes to erase converting stress memory, and cooling at five degrees per minute recrystallizes the polymers into distinct crystalline domains. Second-heating scans then display sharp, isolated melting endotherms, enabling absolute identification and peak integration.
ASTM D3418 thermal analysis conditions require a second heating scan at ten degrees per minute to purge the thermal history imparted by extrusion nip rolls.
Enthalpy quantification calculates the exact mass percentage of each polymer in a co-extrusion blend. Dividing the integrated melting peak area expressed in Joules per gram by the theoretical heat of fusion for a one hundred percent crystalline reference polymer determines the mass fraction. High-density polyethylene demonstrates a melting peak at one hundred thirty-four degrees Celsius with a high heat of fusion exceeding one hundred eighty Joules per gram, allowing clear discrimination from linear low-density polyethylene melting at one hundred twenty-two degrees Celsius.
Thermogravimetric Deconvolution of Fillers and Polymer Mass
Thermogravimetric Analysis measures mass loss as a sample undergoes controlled thermal decomposition in nitrogen and air atmospheres. Heating a barrier paperboard section from ambient temperature to six hundred degrees Celsius under an inert nitrogen flow thermally degrades organic polymers while leaving inorganic kaolin, calcium carbonate, and titanium dioxide pigments intact. Polyolefin resins decompose completely between three hundred eighty and four hundred ninety degrees Celsius, leaving zero carbonaceous residue in nitrogen.
Bio-based polyesters exhibit lower thermal degradation thresholds. Polylactic acid undergoes rapid depolymerization backbone scission between three hundred and three hundred sixty degrees Celsius. Polyvinyl alcohol barrier coatings display a two-stage mass loss profile: initial side-group elimination yielding water and acetic acid occurs between two hundred twenty and three hundred twenty degrees Celsius, followed by main-chain carbonization above four hundred degrees Celsius.
Thermal history alters melting behavior. Switching the purge gas from nitrogen to oxygen at six hundred degrees Celsius oxidizes carbonaceous black residue, separating organic polymer carbon yield from inorganic pigment ash content.
Polymer blends exhibiting multiple crystalline melting peaks in differential scanning calorimetry profiles call for baseline separation before calculating component enthalpy ratios.

Chromatography
Pyrolysis-Gas Chromatography-Mass Spectrometry isolates and identifies volatile degradation fragments generated by rapid thermal cleavage of non-volatile barrier polymers. Placing micro-gram resin samples into a high-temperature pyrolysis unit breaks macromolecular polymer chains into characteristic oligomers, monomers, and aromatic fragments. Chromatographic separation followed by mass spectrometric fragment detection provides ultimate molecular identification for complex, cross-linked, or modified barrier structures that resist solvent extraction.
Pyrolysis Gas Chromatography for Complex Polymer Matrices
Analytical pyrolysis subjects barrier resin samples to flash heating at six hundred degrees Celsius for twenty milliseconds in an inert helium stream. Polyolefin chains undergo random thermal scission, generating a repeating triplet pattern of alkanes, alkenes, and alkadienes across a wide retention time spectrum. Polypropylene pyrolyzes via a specific beta-scission mechanism, producing characteristic monomer, dimer, trimer, and tetramer propene fragments that distinguish it instantly from ethylene-based polymers.
Aqueous acrylic dispersion coatings yield monomeric methacrylate and acrylate species during pyrolysis. A styrene-butyl acrylate dispersion pyrolyzes into intense, distinct chromatographic peaks corresponding directly to monomeric styrene and butyl acrylate. Mass spectra isolate monomer fragments.
Integrating the peak areas of these primary pyrolyzates quantifies the exact monomeric composition of the surface dispersion coating without requiring previous polymer extraction from the kraft paperboard sheet.
- Barrier Surface Wetting evaluation dictates whether attenuated total reflectance or transmission infrared spectroscopy serves as the primary screening tool.
- Thermal History Purging via controlled differential scanning calorimetry heating cycles clarifies resin blending ratios before quantitative enthalpy calculations.
- Pyrolysis Fragment Matching against mass spectral libraries confirms monomer identity when infrared absorption peaks overlap with paperboard cellulose background signals.
- Aqueous Solvent Extraction isolates non-volatile dispersion surfactants prior to liquid chromatography trace analysis.

Detection of Non-Intentionally Added Substances and Additives
High-performance liquid chromatography coupled with tandem mass spectrometry identifies low-molecular-weight additives, plasticizers, and non-intentionally added substances present within barrier paperboard structures. Solvent extraction using dichloromethane or ethanol at elevated temperatures extracts slip agents, antioxidant degradation products, and fluorinated surfactant residues. Polymer additives dictate convertibility.
Pyrolysis fragment matching techniques find application across broad environmental disciplines, such as marine microplastic tracking where oceanographers isolate degraded polyolefin runoff from industrial fishing debris. Analytical verification on packaging lines uses these identical mass fragmentation libraries to track trace contamination in recycled paperboard pulps.
Fluorochemical verification requires targeted mass spectrometry to confirm the presence or absence of per- and polyfluoroalkyl substances used for grease resistance. While total fluorine analysis via combustion ion chromatography screens for organic fluorine content, liquid chromatography tandem mass spectrometry isolates specific short-chain and long-chain perfluorinated alkyl acids. Identifying specific chemical structures confirms compliance with regulatory restrictions governing food contact paperboard.
| Barrier Resin Chemistry | Pyrolysis Temp (°C) | Primary Pyrolyzate Peak | Quantification Mass Ion (m/z) |
|---|---|---|---|
| 600 | 1-Alkene / Alkane triplets | 55, 69, 83 | |
| 600 | 2,4-Dimethyl-1-heptene (trimer) | 70, 126 | |
| 550 | Lactide (cyclic dimer) | 56, 144 | |
| 600 | Styrene monomer / Butyl acrylate | 104 (Styrene), 55 (Acrylate) | |
| 500 | Acetic acid / Hexadiene | 60 (Acetic acid) |
The structural identity of low-molecular-weight oligomers generated during high-temperature extrusion of polyhydroxyalkanoates onto bleached kraft paperboard remains an unresolved analytical problem across commercial converting lines.


Repulpability
Verifying barrier resin identity directly informs repulpability and recyclability classification across commercial paperboard recycling mills. Standard papermaking recovery processes rely on hydrapulping to liberate cellulosic fibers from barrier films. Solid, continuous film layers act differently than water-dispersible polymers during mechanical pulping and screen fractionation.
Resin identity dictates whether a barrier layer separates cleanly as a continuous matrix or disintegrates into sticky colloidal contaminants.
Recyclability Screening and Fiber Yield Metrics
Extrusion-coated polyolefin board structures maintain intact plastic films during hydrapulping under standard laboratory conditions specified by CEPI or PTS methods. High-density and low-density polyethylene coatings resist aqueous disintegration, allowing mechanical pulper rotors to strip paperboard fibers clean from the polymer sheet. The large, intact plastic fragments remain on coarse screening plates, resulting in high fiber yield recovery with low contamination of the accepted stock pulp stream.
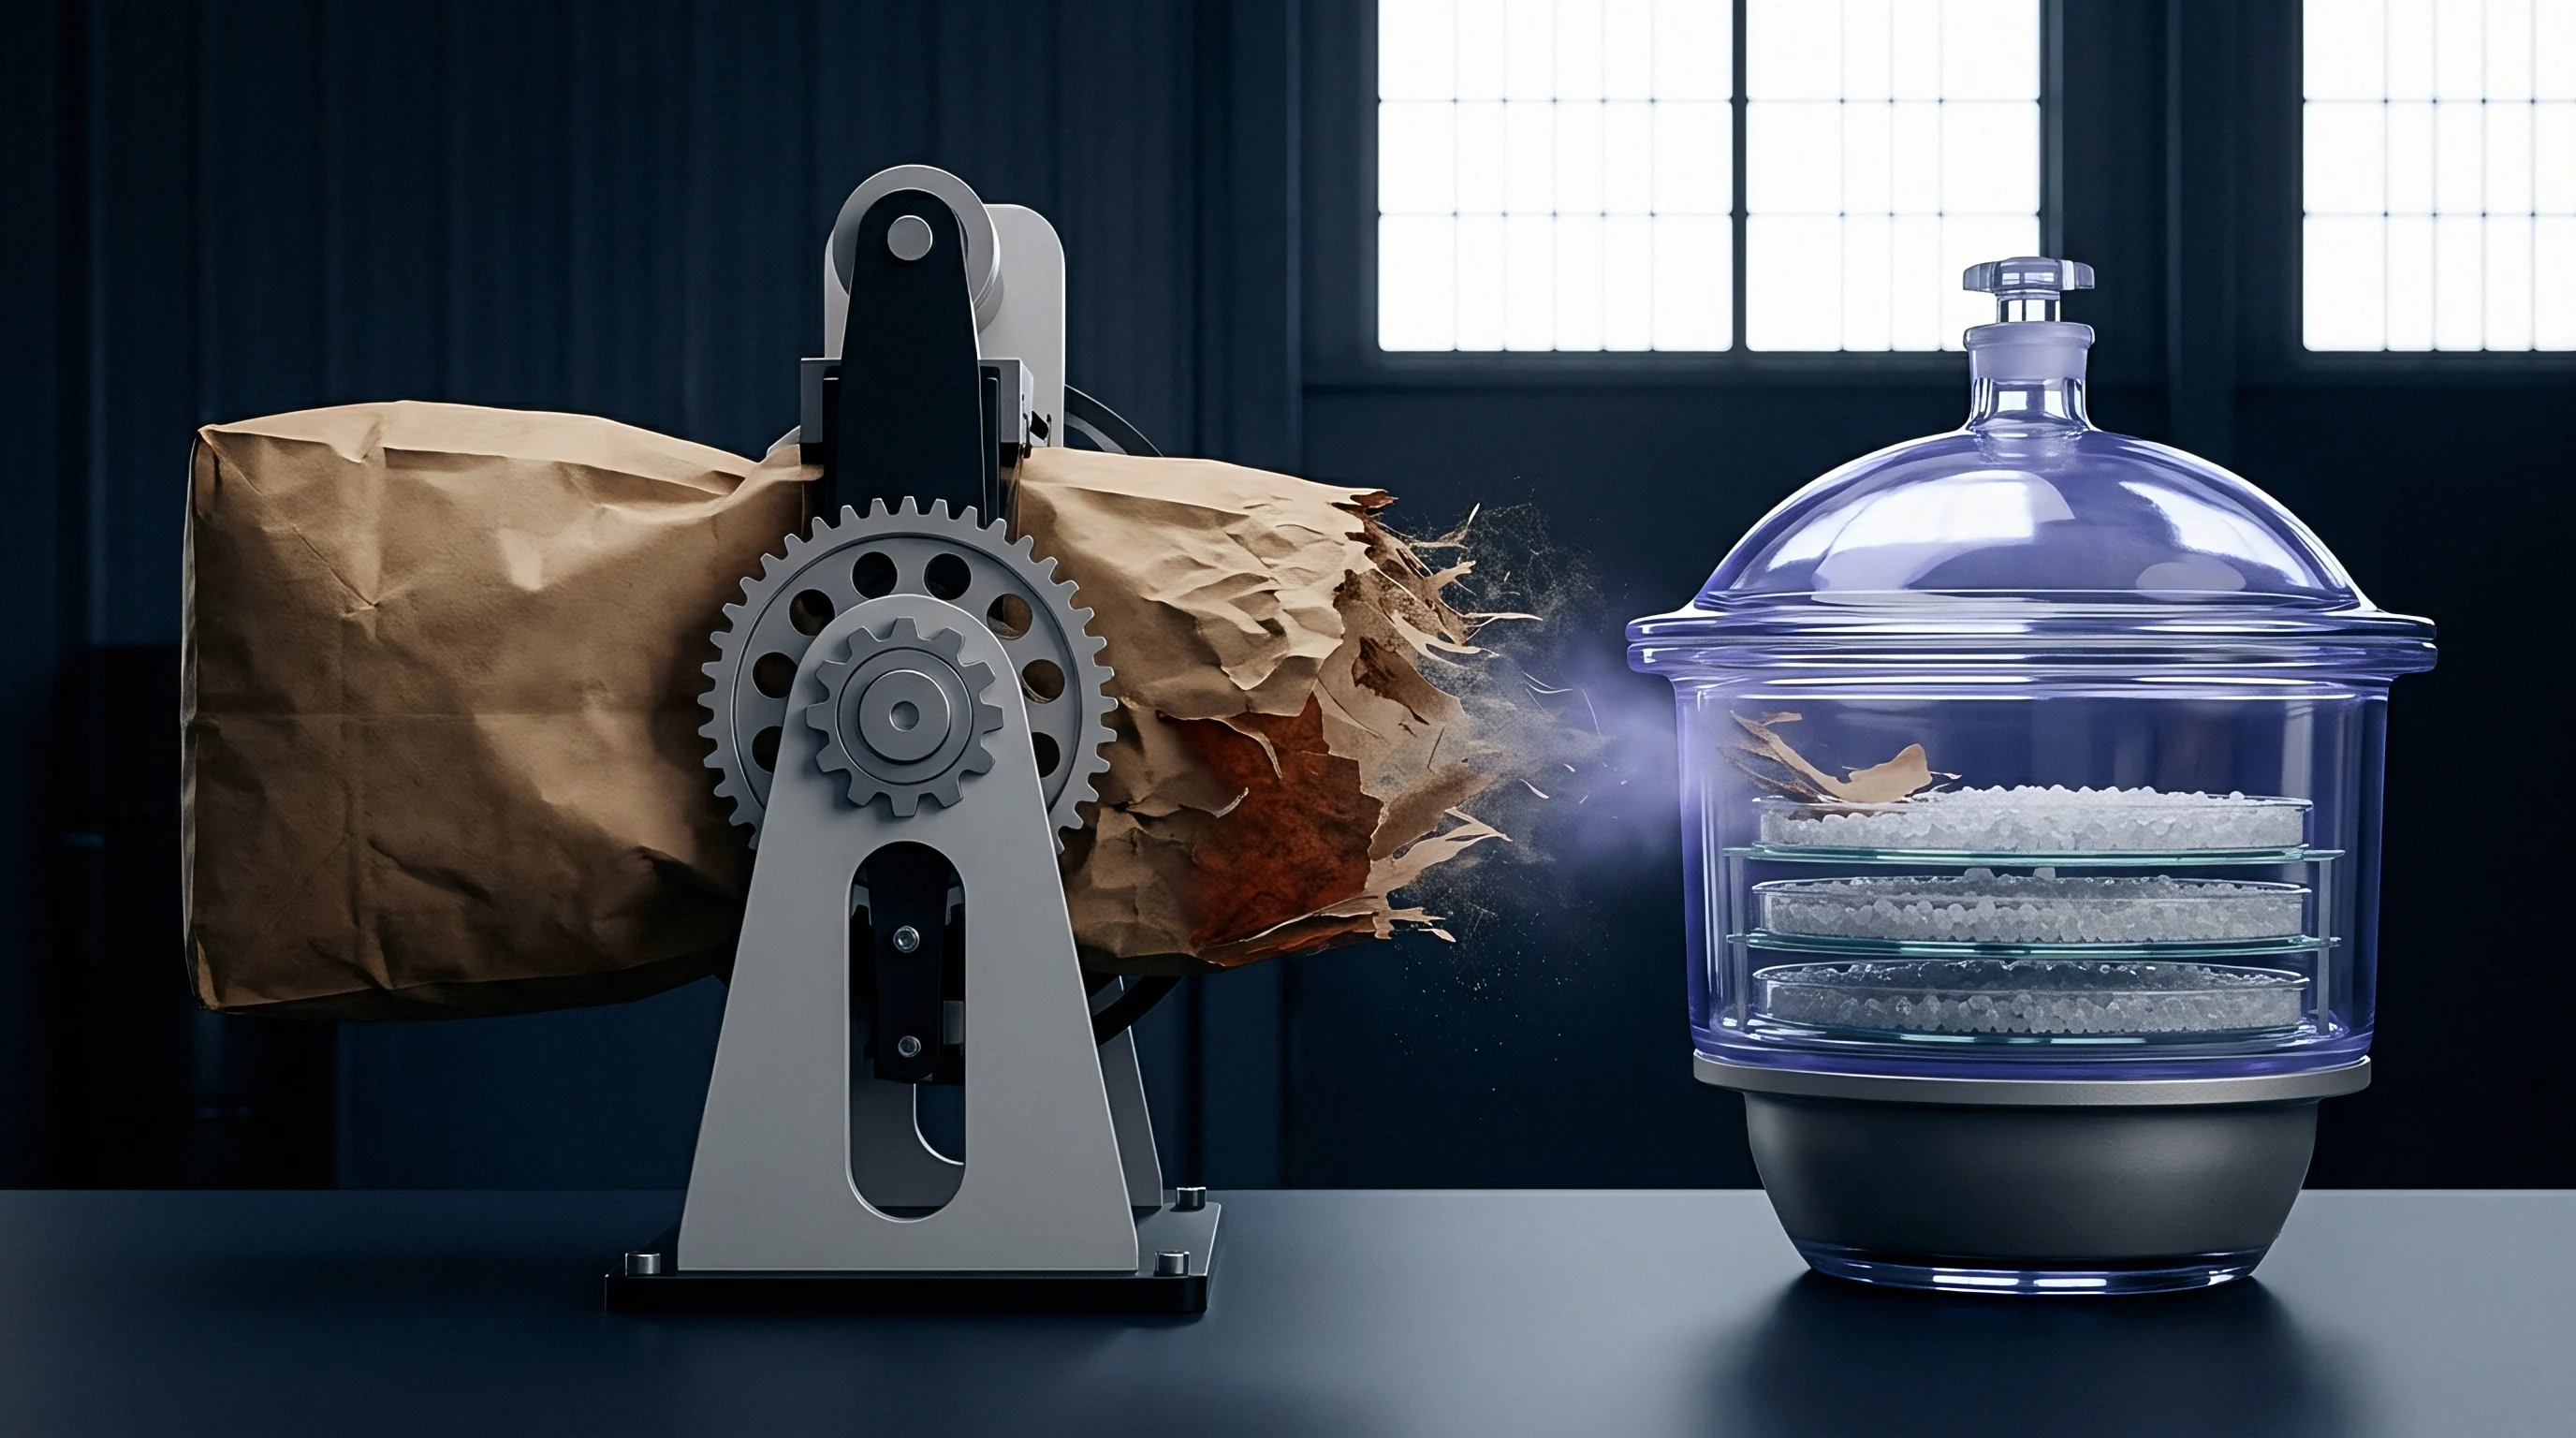
Water-dispersed acrylic coatings present a contrasting disintegration mechanism. Mechanical shear forces inside industrial pulpers break acrylic barrier coatings into fine, insoluble latex particles ranging from ten to five hundred micrometers in size. Sticky particles clog mill screens.
These synthetic particulates pass through coarse pressure screens and accumulate within white water circulation loops, forming sticky deposits on paper machine drying cylinders and wire meshes.
Synthetic acrylic dispersion resins break down into fine sticky particles during hydrapulping that clog fine mill screens and reduce pulp washing efficiency.
Commercial testing labs report a sticky formation threshold of one point five square millimeters per kilogram of dry pulp for acrylic dispersion coatings, yet published literature lacks a standardized inter-laboratory cross-validation for this specific cutoff; facing this analytical uncertainty, paperboard buyers mandate a pilot-scale screen rejection trial on a five hundred kilogram lot before approving line conversion. Fiber yield determines recycling class.
Impact of Synthetic and Bio-Based Resins on Pulp Screen Fractionation
Bio-based polyesters introduce unique chemical behaviors during recycled pulp alkaline processing. Polylactic acid and polybutylene succinate films exhibit mechanical brittleness compared to tough polyolefin coatings. Standard hydrapulping fragments bio-polyesters into dense micro-plastics that fail to float during light-reject screening operations.
Sinking plastic fragments contaminate settled pulp fractions, reducing the commercial value of recovered secondary fibers.
Chemical modification of barrier resins alters their repulpability classification. Incorporating alkali-soluble carboxylic acid monomers into acrylic dispersion formulations enables complete resin dissolution during high-pH pulping cycles. Hydrophilic polymer dissolution eliminates solid sticky formation during screening, returning clean fiber slurries.
Solvent extraction isolates surface additives.
- Certified Resin Data must list polymer density, melt flow index, and monomer composition verified by infrared spectroscopy.
- Thermal Analysis Dossier includes complete differential scanning calorimetry thermograms showing first and second heat melting profiles.
- Recyclability Assessment Report detailing fiber recovery yield percentages according to recognized European or North American test schemes.
- Food Contact Statement confirming compliance with Regulation EU 10/2011 or FDA 21 CFR migration limits.
CEPI Recyclability Guideline Category A mandates a minimum usable fiber yield of eighty-five percent after standard laboratory pulping, penalizing board structures that release fine latex particulates into the wash stream.


Audit
Formal resin verification frameworks establish quality assurance protocols that bridge raw material procurement and converted board manufacturing. Relying solely on mill Certificates of Analysis introduces commercial risk when unannounced resin grade substitutions occur upstream. Quality control programs integrate dock-side rapid spectroscopic screening with laboratory thermal analysis to lock in compliance, performance, and legal food-contact standing.
Certificate Validation and Spectroscopic Hit Quality Indexes
Incoming paperboard roll audits demand systematic verification of Certificates of Analysis against measured resin properties. Modern attenuated total reflectance FTIR spectrometers utilize automated spectral matching algorithms that compare sample spectra against authenticated reference databases. The algorithm calculates a Hit Quality Index value ranging from zero to one hundred, where one hundred indicates an absolute spectral match.
Dock testing prevents converting failure.
Establishing operational pass-fail thresholds prevents mislabeled rolls from reaching converting equipment. A Hit Quality Index threshold of ninety-five or higher confirms resin identity for pure polyolefin extrusion grades. Formulated acrylic dispersions or modified bio-polyesters require a tailored Hit Quality Index threshold set between eighty-eight and ninety-two to account for minor batch-to-batch surfactant and plasticizer concentration variations.
Samples falling below established thresholds trigger immediate automated quarantine and laboratory analytical escalation.
Worked Example on Analytical Verification Economics and Risk Exposure
Quantifying the financial return of analytical resin verification involves balancing analytical testing costs against total commercial risk exposure. Converting plants lose tens of thousands of dollars when an unverified resin formulation fouls extrusion dies during continuous production runs. Resin substitution destroys seal performance.
Consider a commercial converting order involving a fifty-tonne lot of double-barrier paperboard valued at twenty-four hundred dollars per tonne, representing a total material purchase cost of one hundred twenty thousand dollars. A comprehensive verification package incorporating ATR-FTIR screening, DSC thermal profiling, and Py-GC/MS additive verification costs eighteen hundred dollars per converted batch lot. Unverified delivery of a board lot coated with improper low-density polyethylene instead of specified biodegradable polylactic acid leads to immediate brand rejection, triggering a one hundred percent material loss alongside thirty-five thousand dollars in downtime, wasted lamination passes, and packaging line cleanup costs.
Total commercial exposure reaches one hundred fifty-five thousand dollars. Dividing the eighteen hundred dollar analytical audit cost by the one hundred fifty-five thousand dollar risk exposure yields an audit cost ratio of one point sixteen percent of total financial risk, proving the economic logic of systematic analytical verification.
Verifying resin chemistry at the receiving dock using rapid attenuated total reflectance infrared screening prevents mislabeled mill rolls from entering the high-speed extruder line, maintaining batch traceability across multi-plant conversion runs.