Standard Laboratory Test Methods for Paperboard Physical Property Verification
Paperboard physical property verification requires strict ISO 187 conditioning and standardized test methods to ensure compliance and prevent customs holds.

Atmosphere
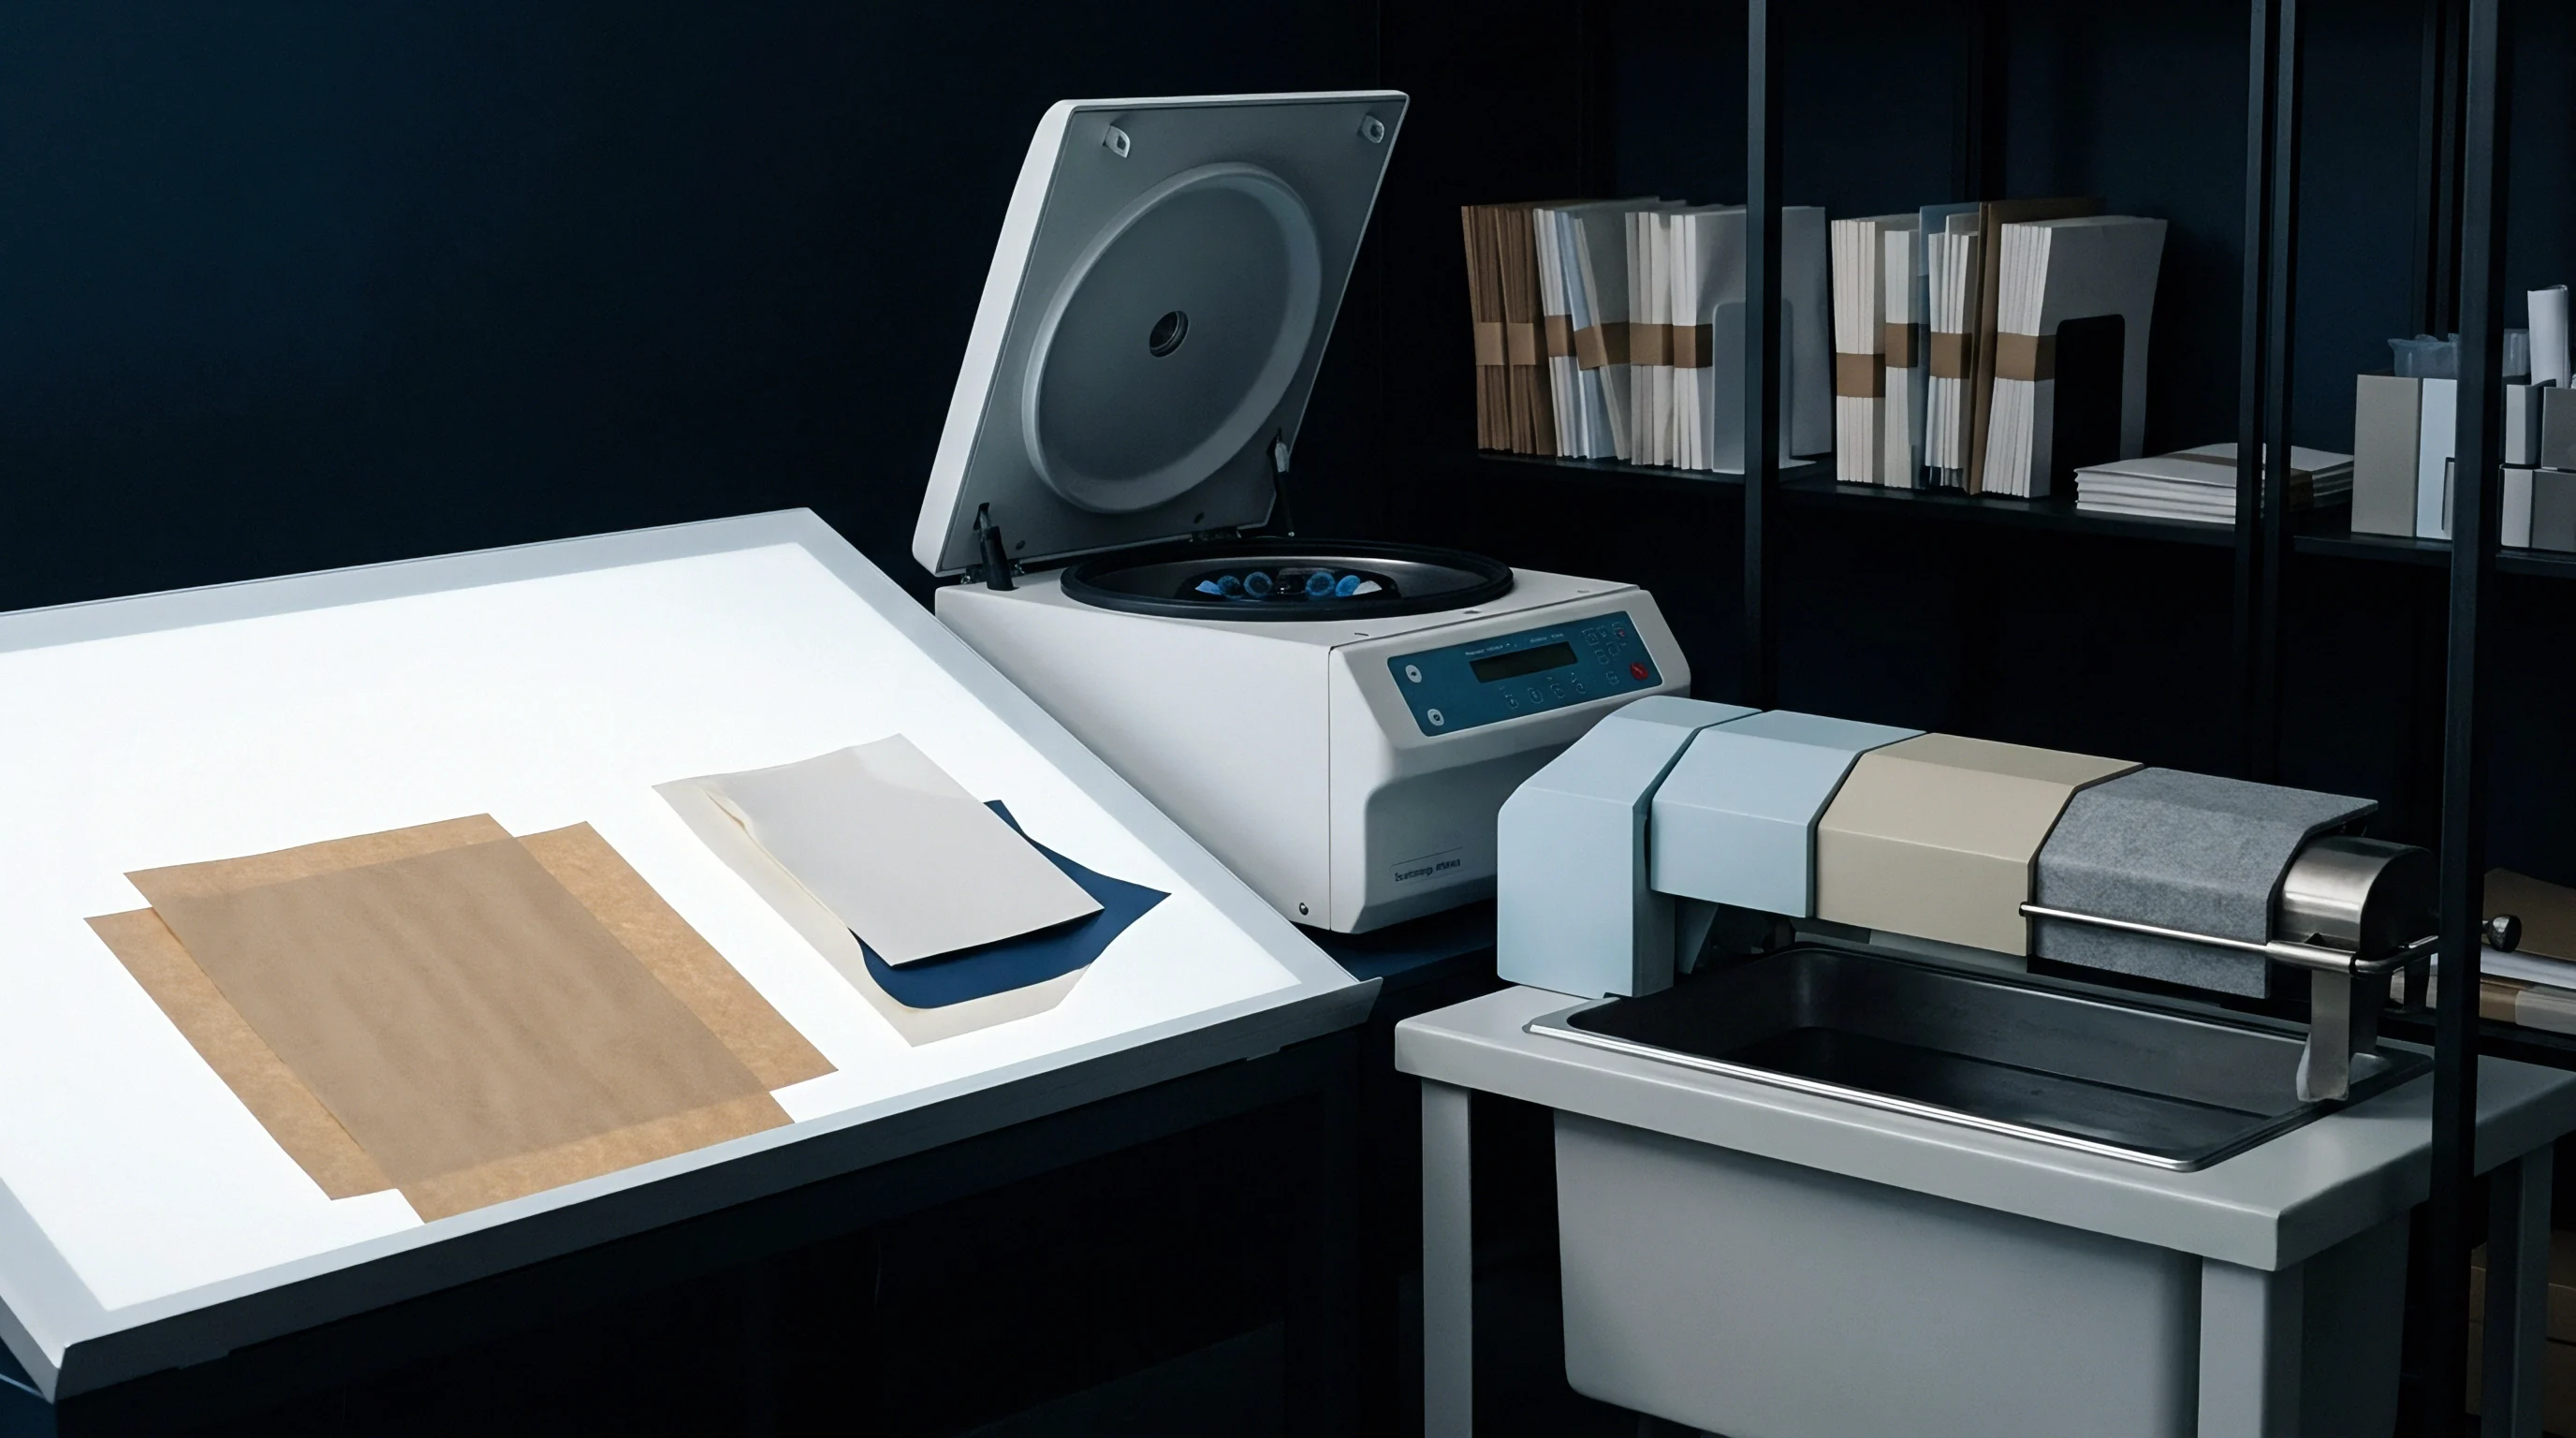
Paperboard testing begins with controlled relative humidity and temperature regulation to ensure repeatable physical measurements across international laboratories. Hygroscopic cellulose fibers continually absorb or desorb moisture from ambient air, altering internal hydrogen bonding, fiber volume, and overall sheet viscoelasticity. A small shift in laboratory humidity significantly skews physical strength measurements, rendering unconditioned test reports invalid for commercial verification.
Standard Conditioning Environment under ISO 187
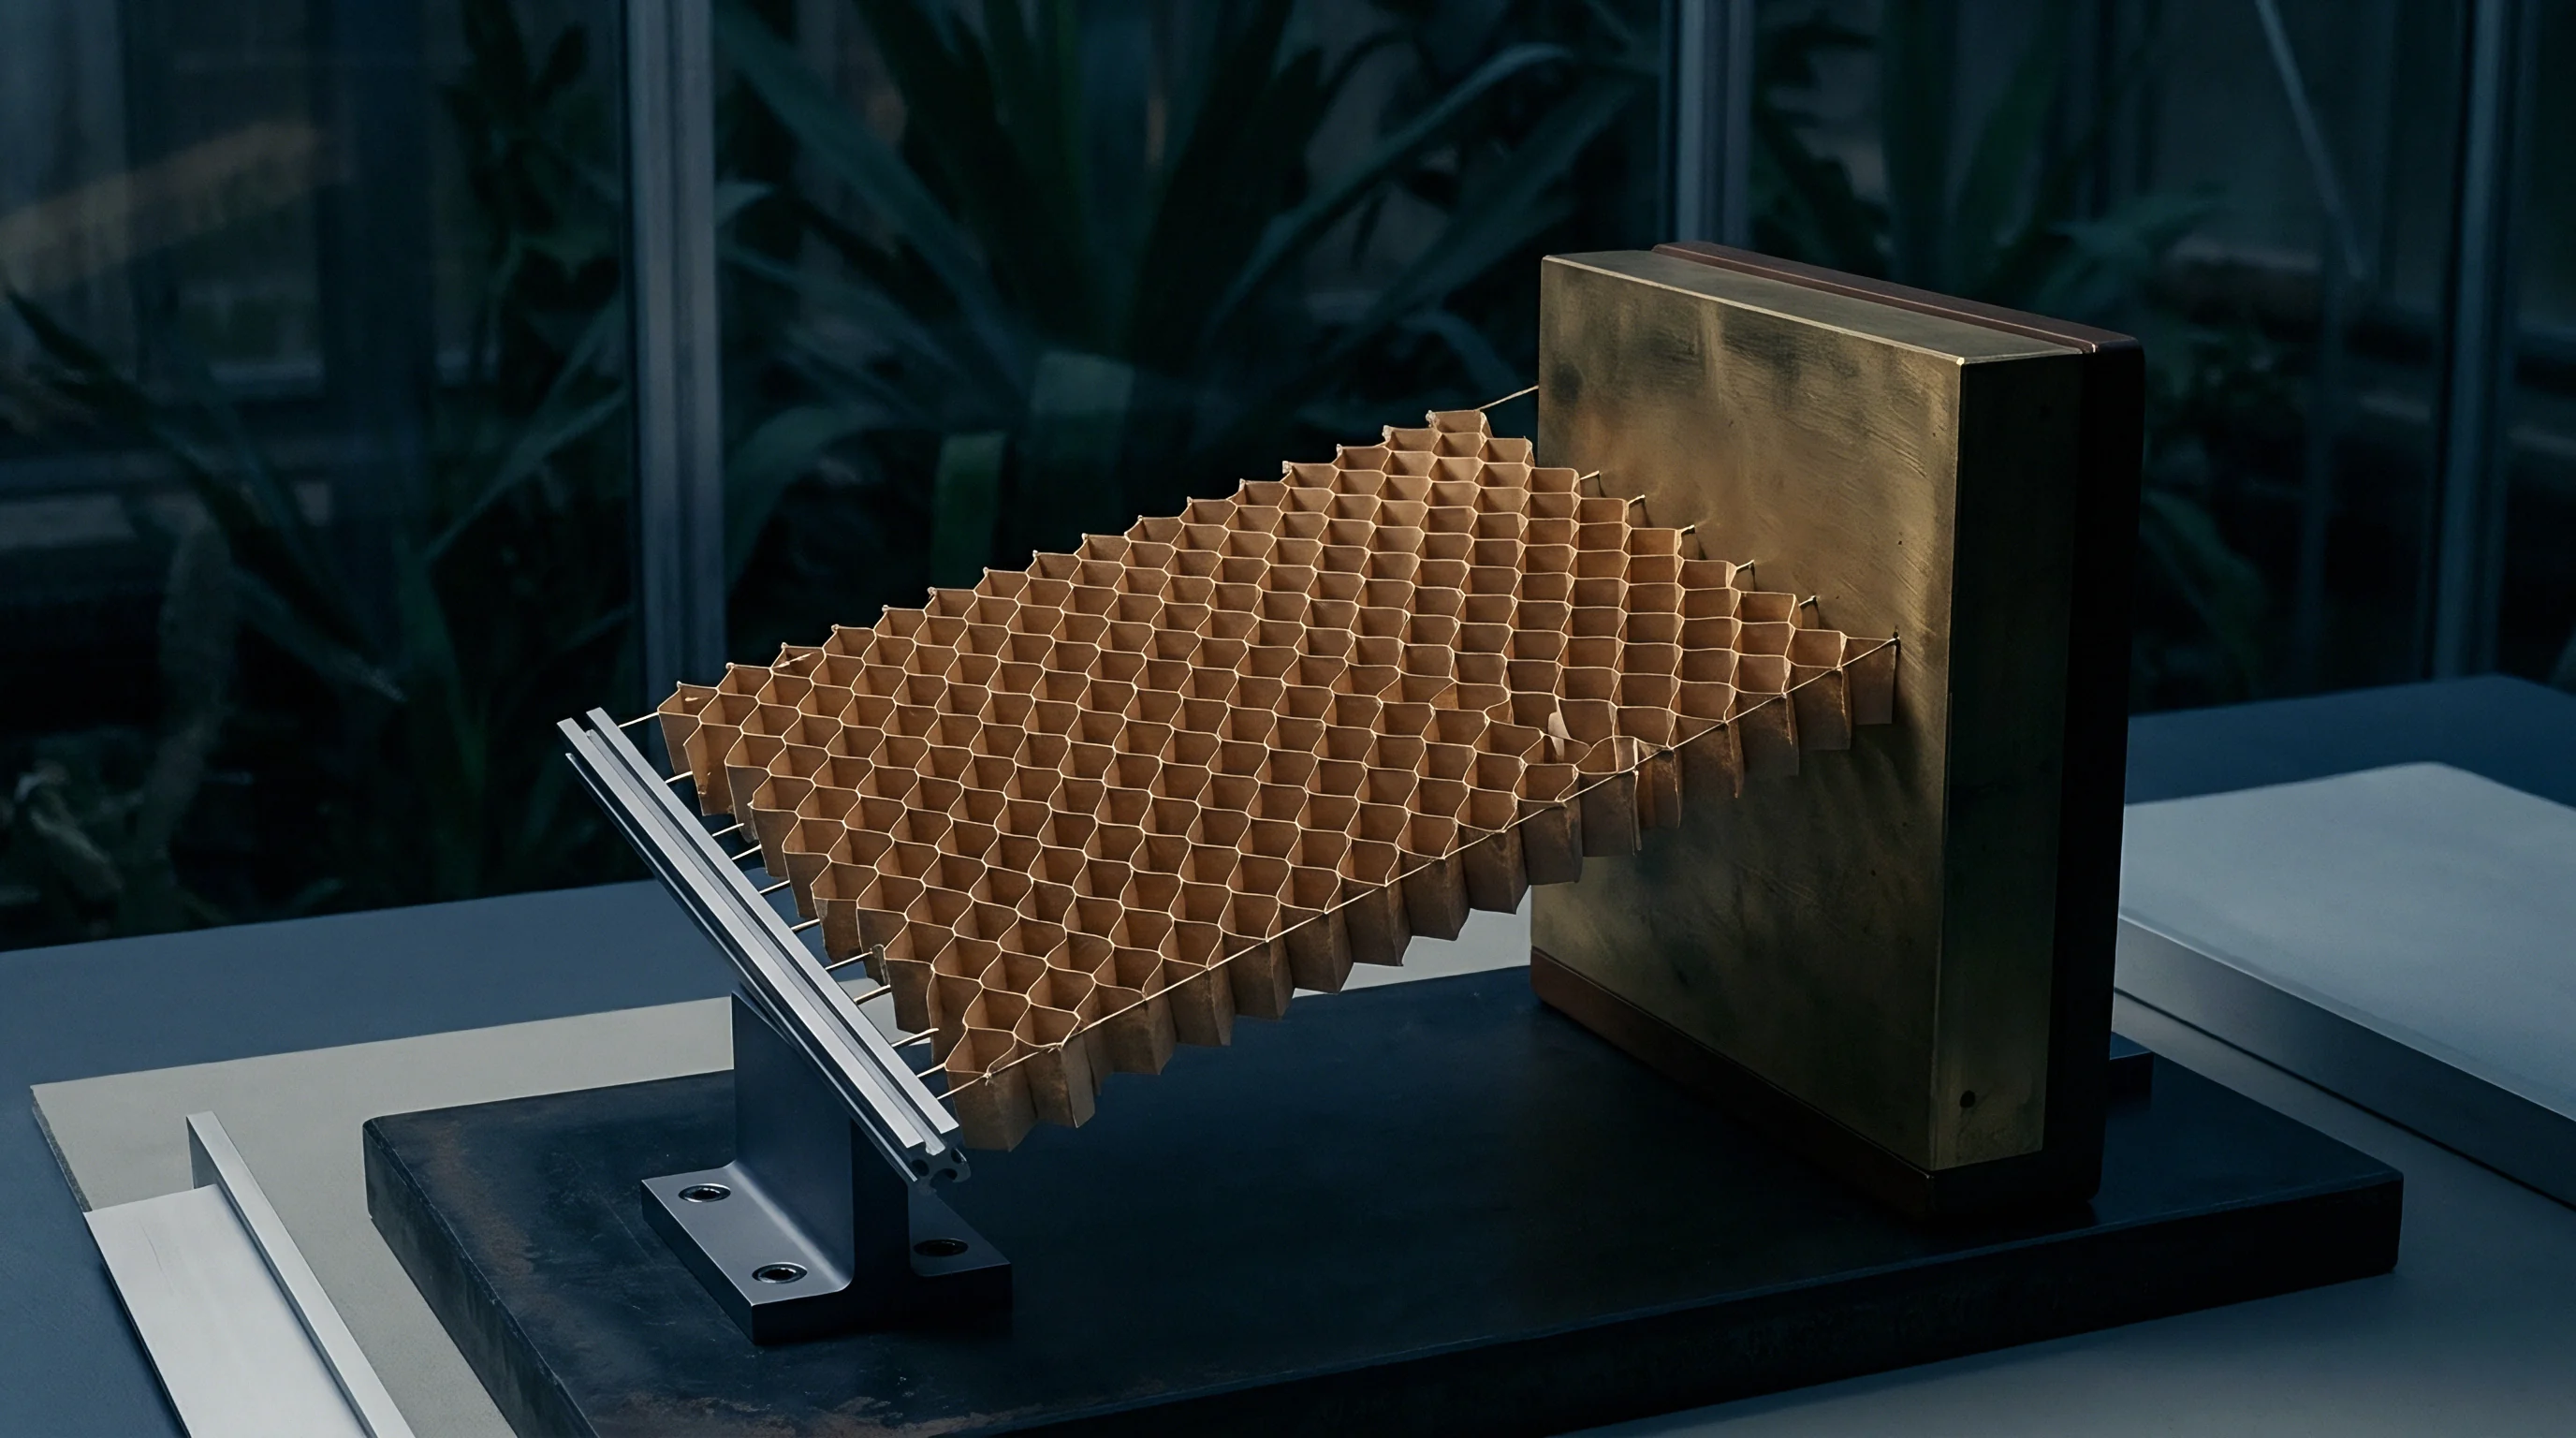
Cellulose fibres absorb water vapor until internal moisture reaches dynamic equilibrium with surrounding air. International standard test procedures specified in ISO 187 and TAPPI T 402 establish a standard atmosphere of 23.0 °C ± 1.0 °C and 50.0% ± 2.0% relative humidity. In specific tropical trade routes, alternative official conditioning standard parameters of 27.0 °C ± 1.0 °C and 65.0% ± 2.0% relative humidity apply, but standard contract verification relies on the 23 °C / 50% RH standard.
Specimen exposure times must allow complete moisture equilibration, requiring 24 hours for single sheets and up to 48 hours for heavy boxboard or laminated grades.
Fibre absorbs ambient moisture. Mechanical properties shift rapidly during the initial exposure phase. Tensile strength and bending stiffness drop as moisture content increases, whereas burst strength and tear resistance exhibit non-linear variations depending on fiber refine levels and internal sizing chemistries.

Equilibrium Hysteresis and Fiber Sorption Dynamics
Sorption behavior creates two distinct moisture paths depending on whether dry pulp gains humidity or wet stock desorbs liquid. The equilibrium moisture content achieved when a dry sample absorbs moisture to reach 50% relative humidity is lower than the moisture content achieved when a damp sample desorbs moisture down to the same 50% RH level. This sorption hysteresis gap introduces an error of 0.5% to 1.5% in total moisture content, which translates into significant discrepancies during strength verification.
Hysteresis alters equilibrium. To eliminate hysteresis errors, ISO 187 mandates pre-conditioning test specimens for at least 24 hours in an atmosphere maintained between 20% and 35% relative humidity with a maximum temperature of 40 °C. Pre-conditioning forces every test sample to approach final laboratory equilibrium strictly from the dry side (adsorption), stabilizing moisture content and ensuring reproducible strength values.
| Relative Humidity (%) | Equilibrium Moisture (%) | Taber Bending Stiffness (mN·m) | Short-Span Compression SCT (kN/m) | Mullen Burst Strength (kPa) |
|---|---|---|---|---|
| 30.0 (Pre-conditioned dry) | 4.8 | 24.5 | 8.2 | 610 |
| 50.0 (Standard ISO 187) | 6.5 | 21.0 | 7.4 | 580 |
| 65.0 (High humidity ambient) | 8.9 | 17.2 | 6.1 | 535 |
| 80.0 (Tropical transport) | 12.4 | 12.8 | 4.5 | 450 |
| Data based on virgin bleached sulphate folding boxboard conditioned from adsorption path at 23 °C. | ||||
Conditioning virgin folding boxboard at sixty-five percent relative humidity increases equilibrium moisture content by two point four percent and reduces two-point bending stiffness by eighteen percent compared to standard laboratory equilibrium at fifty percent relative humidity.
Moisture softens the matrix. Testing paperboard specimens directly from an unconditioned shipping container without pre-conditioning invalidates stiffness and compression data, leading to improper grade rejection or structural container failure on automated packaging lines.

Grammage
Mass per unit area forms the baseline metric for commercial valuation, yielding structural performance figures when evaluated alongside sheet thickness. Paperboard is bought and specified on basis weight, yet physical performance depends entirely on how those grams of fiber are distributed through the sheet thickness profile.
Precision Mass Determination Methods
Laboratory analytical balances measure test specimens cut to accurate dimensions using precision die cutters or template punches. ISO 536 and TAPPI T 410 define the standard method for determining grammage. Specimen cutters must produce clean, parallel edges free from fiber burrs, with a minimum specimen surface area of 100 cm² or 500 cm² for high precision.
Precision balances record mass with a resolution of 0.001 g.
Grammage (g) expressed in grams per square meter (g/m²) is calculated directly from measured specimen mass (m) in grams and test area (A) in square centimeters:
g = fracmA × 10000
Moisture content determination under ISO 287 accompanies grammage testing to calculate oven-dry basis weight when contract claims specify moisture-free pulp mass.
- Cut ten test specimens measuring exactly 100 square centimeters from representative sample sheets chosen per ISO 186 sampling guidelines.
- Condition specimens at 23 °C and 50 percent relative humidity following pre-conditioning below 35 percent relative humidity.
- Weigh each specimen on a calibrated analytical balance with a resolution of 0.001 grams and record individual mass values.
- Calculate average mass per unit area by multiplying mean specimen mass by one hundred to express results in grams per square meter.
- Dry specimens in a ventilated oven at 105 °C to constant mass to calculate moisture content and dry basis grammage under ISO 287.

Micro-Caliper Calibration and Pressure Dynamics
Motorized micrometers compress sheet surfaces under fixed platen loading to record single-sheet thickness without crushing internal voids. Standard caliper verification under ISO 534 and TAPPI T 411 requires a static contact pressure of 50 kPa ± 5 kPa applied between two circular, parallel anvil platens having an area of 200 mm². The lower platen lowering speed is regulated to 2.0 mm/s ± 0.5 mm/s to prevent impact deformation during measurement.
Pressure deforms soft surfaces. Platen size affects readings. Calculating apparent sheet density (ρ) in g/cm³ and apparent specific volume or bulk (v) in cm³/g combines grammage (g) in g/m² with caliper (d) in micrometers (µm):
ρ = fracgd
v = fracdg
A worked comparison illustrates how bulk alters material properties: a 350 g/m² Solid Bleached Board (SBB) lot delivered with an average measured caliper of 420 µm yields an apparent density of 0.833 g/cm³ and a bulk of 1.20 cm³/g. If a recycled Coated Recycled Board (CRB) of identical 350 g/m² mass yields a measured caliper of 490 µm, its bulk equals 1.40 cm³/g. The 16.7% higher bulk in the CRB stock yields equivalent bending stiffness at a lower fiber density, whereas the denser SBB substrate maintains higher tensile strength and smoother surface properties for high-end graphic printing.
Mills frequently attribute caliper deviations below specification to seasonal raw pulping variances rather than uncompensated press section wear on the paper machine.

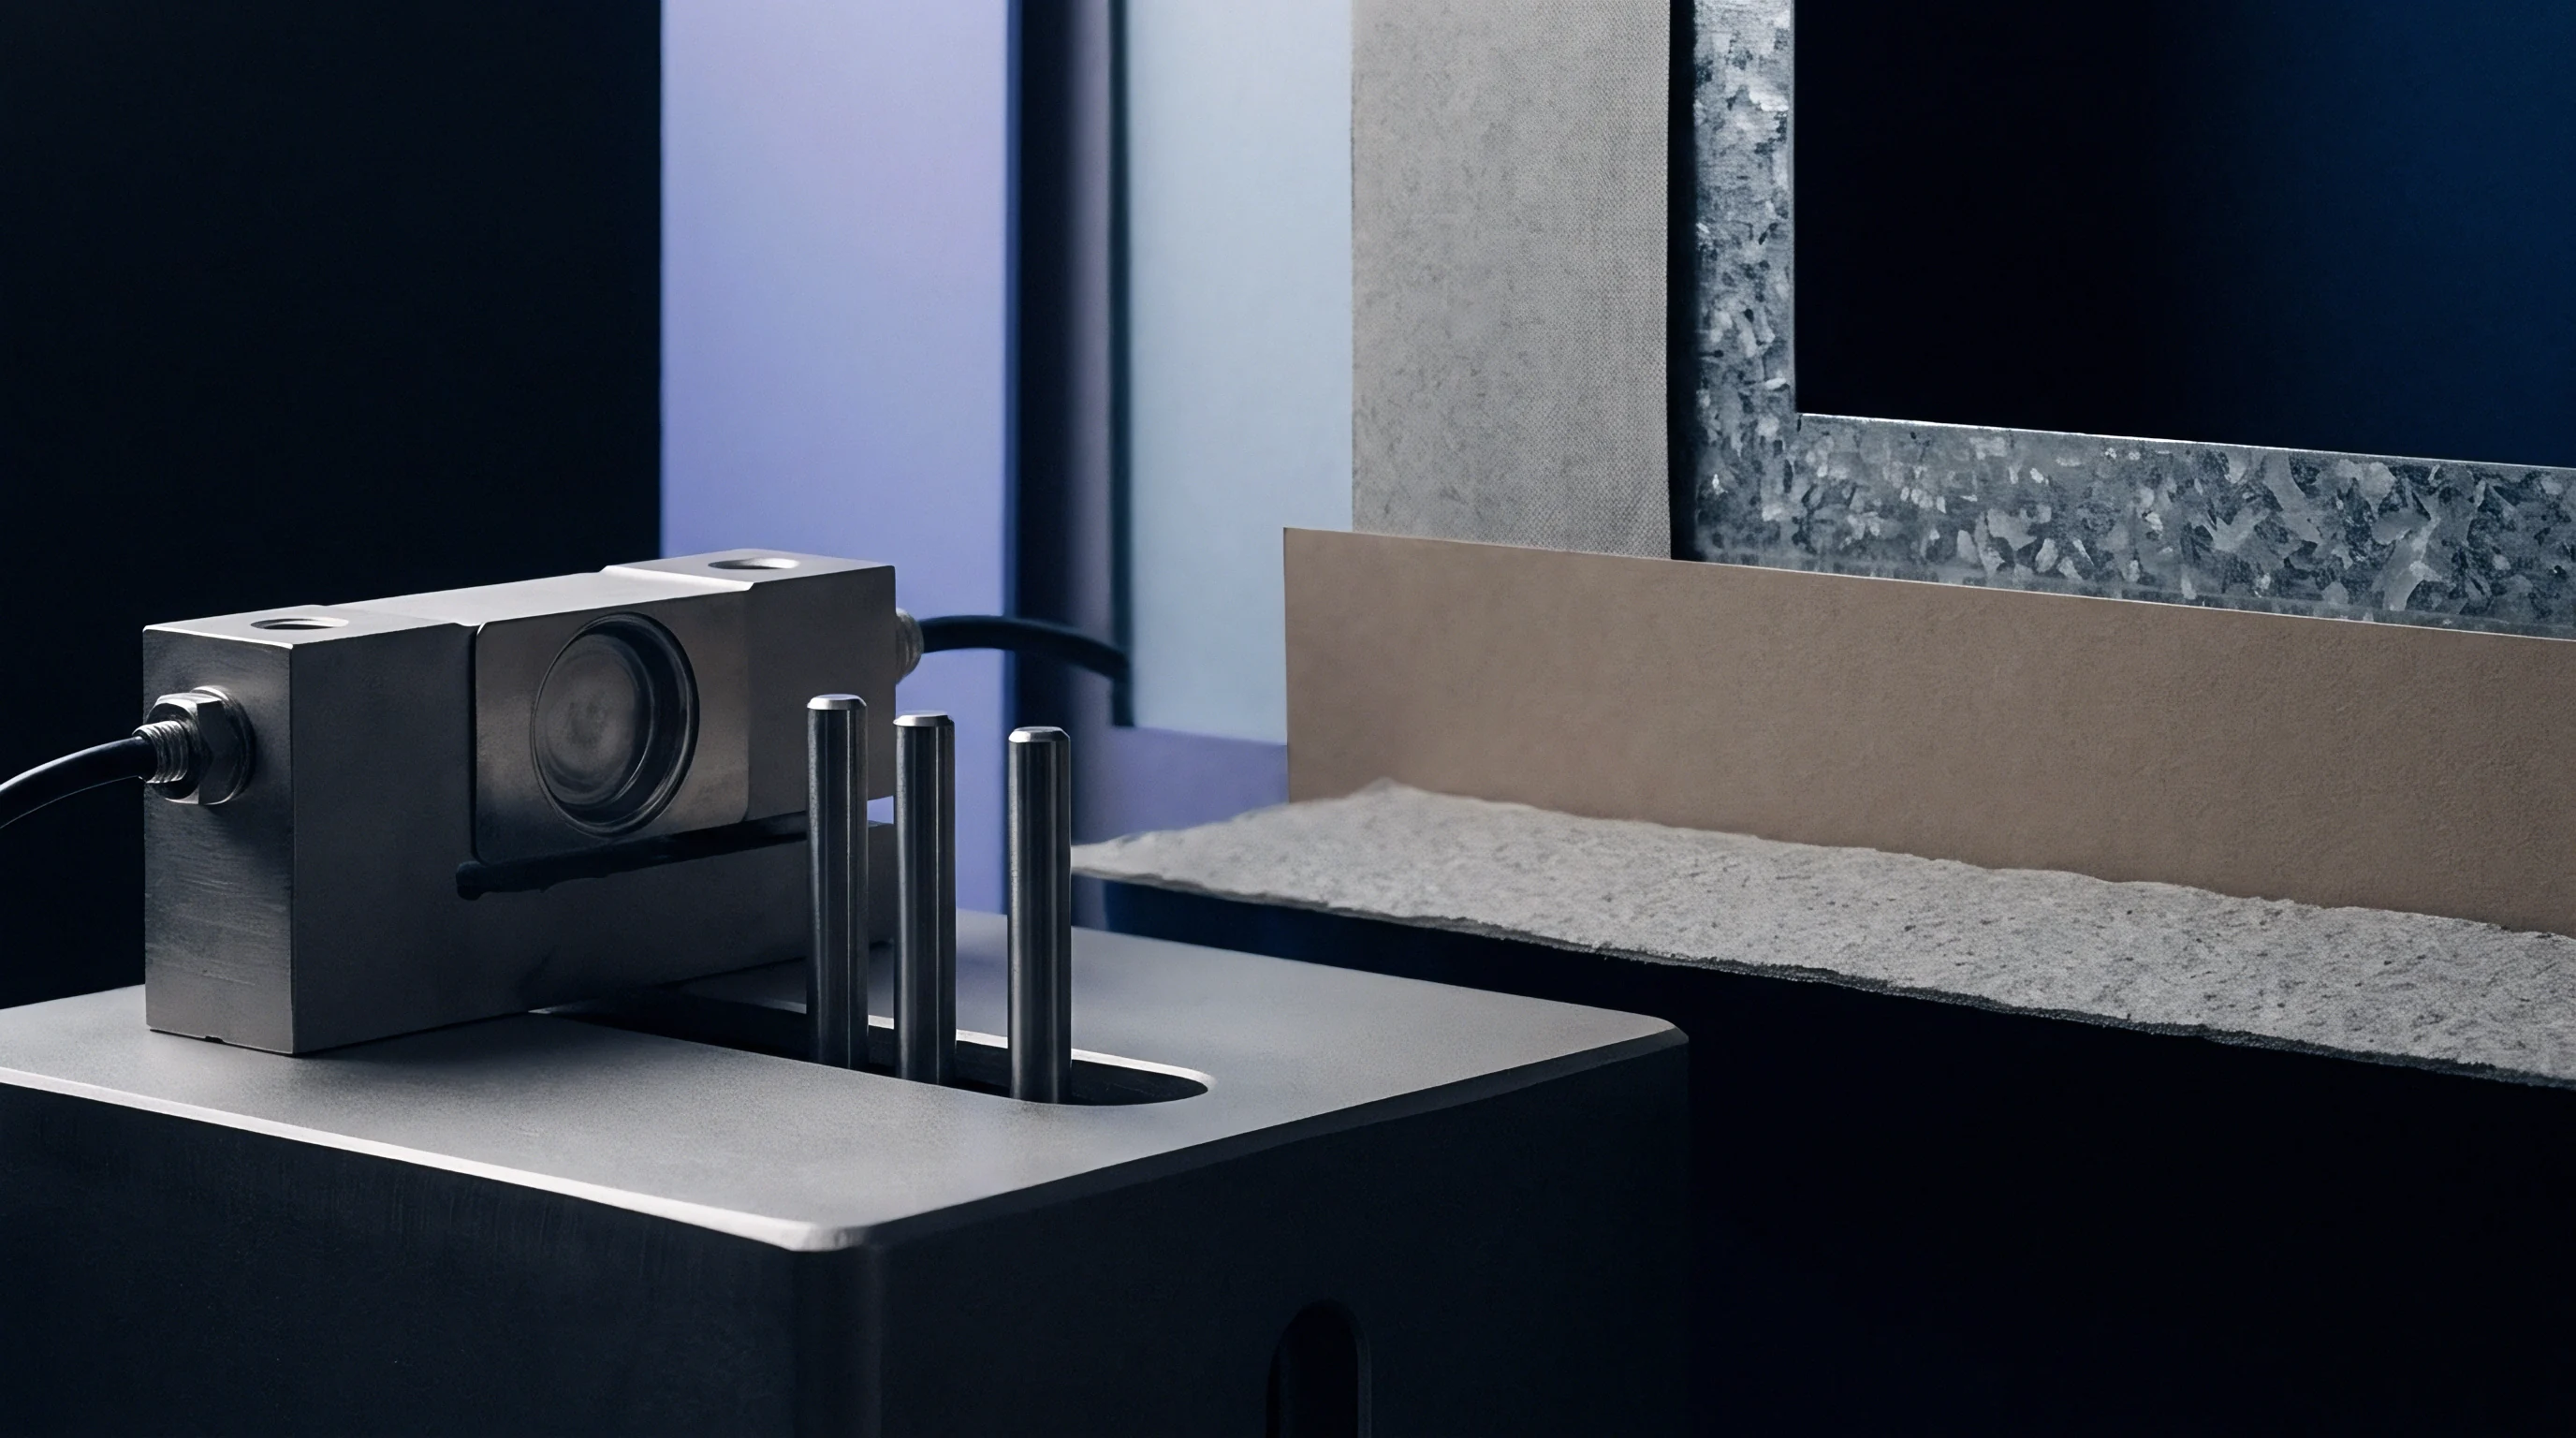
Clamp
Pneumatic pressure applied during hydraulic burst testing restrains paperboard specimens to enforce pure tensile failure across the specimen area. The Mullen burst test remains a universal packaging benchmark, measuring multi-directional tensile resistance under planar hydraulic strain.
Hydraulic Burst Testing and Diaphragm Calibration
Mullen instruments force an elastic membrane against an annular aperture until the circular test area ruptures under hydrostatic pressure. ISO 2759 governs paperboard bursting strength verification for materials exhibiting burst pressures between 350 kPa and 5500 kPa, whereas ISO 2758 applies to lighter paper grades below 350 kPa. The test machine pumps glycerin fluid behind a rubber diaphragm at a constant volumetric displacement rate of 170 ml/min ± 15 ml/min.
Diaphragm resilience directly affects peak pressure figures. Diaphragms must be verified periodically by measuring their bulging height resistance: a standard board testing diaphragm must bulge 9.0 mm above the lower clamp face at a hydraulic pressure of 170 kPa to 220 kPa. Aged or hardened diaphragms consume excess hydraulic pressure, artificially inflating recorded board burst strength values.
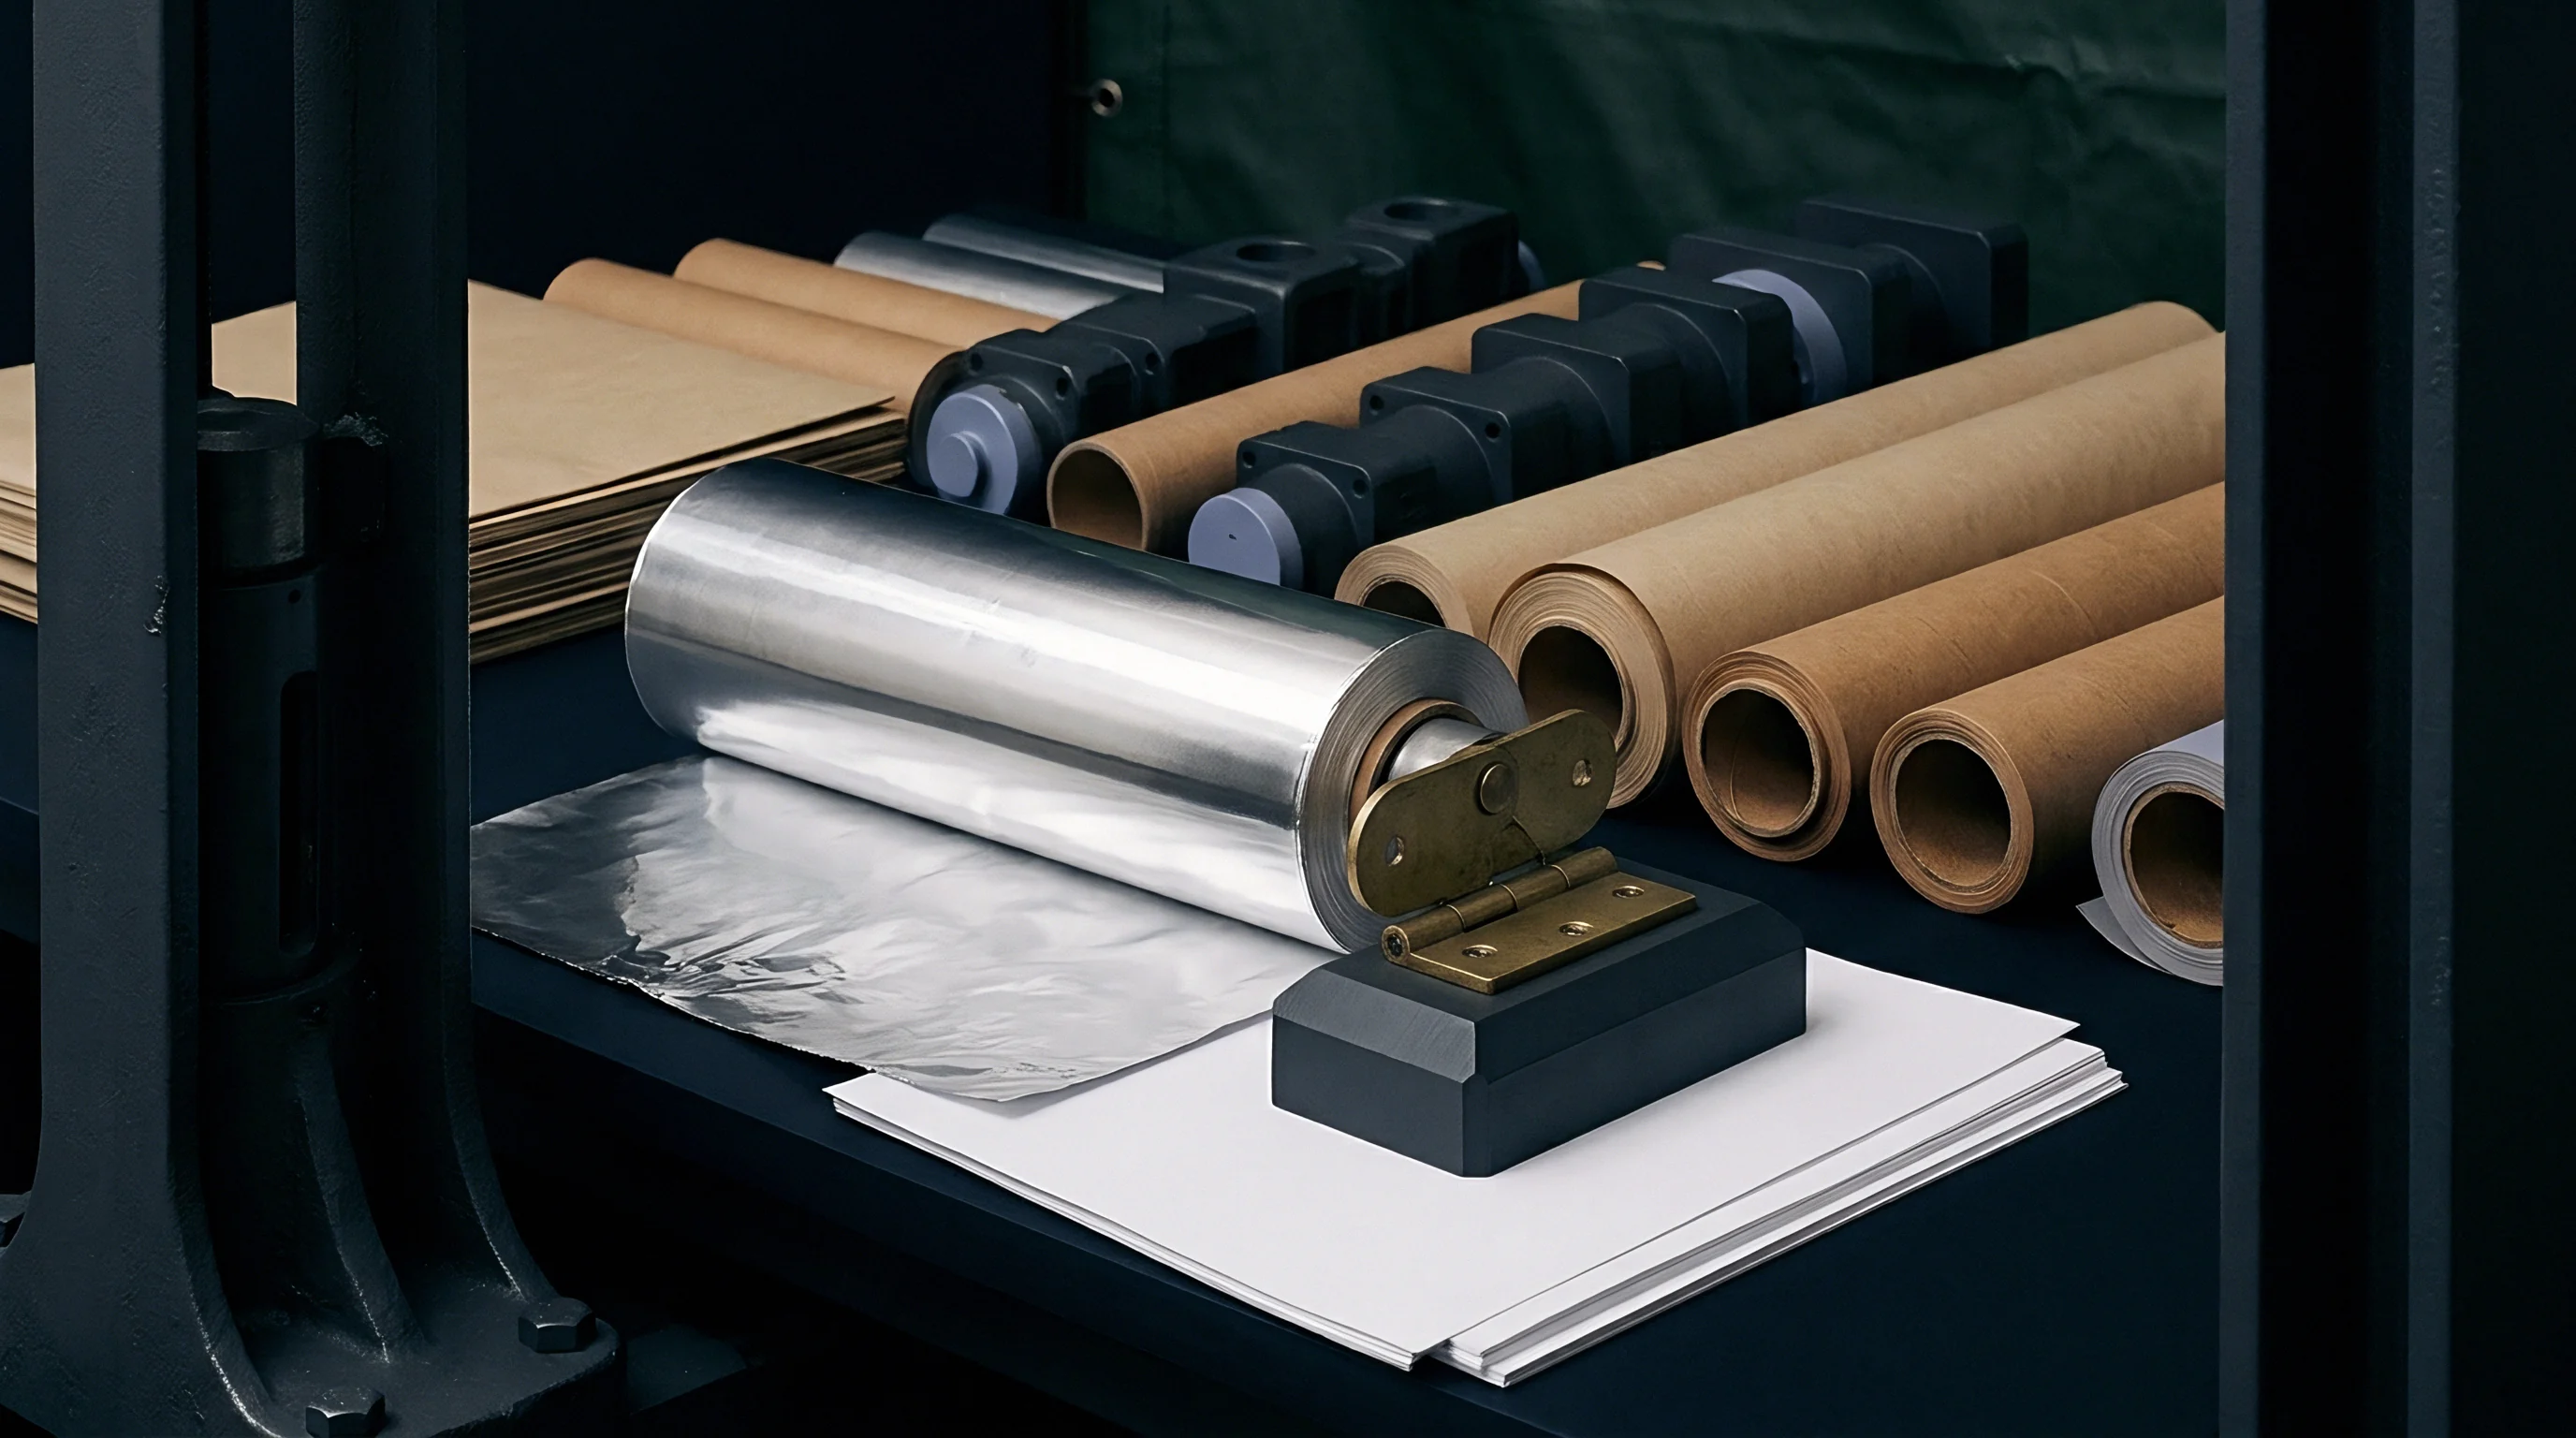
Pneumatic Gripping Forces and Edge Shear
Restraining the specimen balances slip prevention against structural crushing of flutes or solid board fibers. Pneumatic clamping pressure applied through upper and lower annular rings must be sufficient to prevent edge slippage during diaphragm expansion, without exceeding limits that cut surface fibers along the clamp ring perimeter. ISO 2759 specifies clamping pressures between 700 kPa and 1200 kPa for heavy paperboard boards.
Clamping prevents sheet slip. Diaphragm stiffness skews pressure. Insufficient clamping pressure allows outer plies to slide inward toward the bursting zone, generating falsely elevated burst readings accompanied by characteristic double-rupture acoustic signatures.
Excessive clamping pressure crushes the sheet boundary, inducing premature edge shear failure along the ring margin.
- Annular Edge Shear occurs when excessive holding force cuts surface fibers along the specimen ring boundary before peak pressure develops.
- Specimen Slippage appears when inadequate ring pressure lets board draw into the test aperture, generating artificially elevated pressure peaks.
- Diaphragm Resistance Error results from age-hardened rubber membranes that consume uncalibrated hydraulic pressure during extension.
- Double Rupture Signatures indicate sequential ply failure in multi-layer board caused by uneven tension distribution during expansion.
Clause 4.2 of ISO 2759 rejects any bursting strength test report where specimen slippage under the clamping ring exceeds zero point two millimeters during hydraulic pressurization.
Increasing holding pressure until specimen edges show visible crushing marks invariably underestimates actual burst resistance through localized perimeter fracture.

Flexure
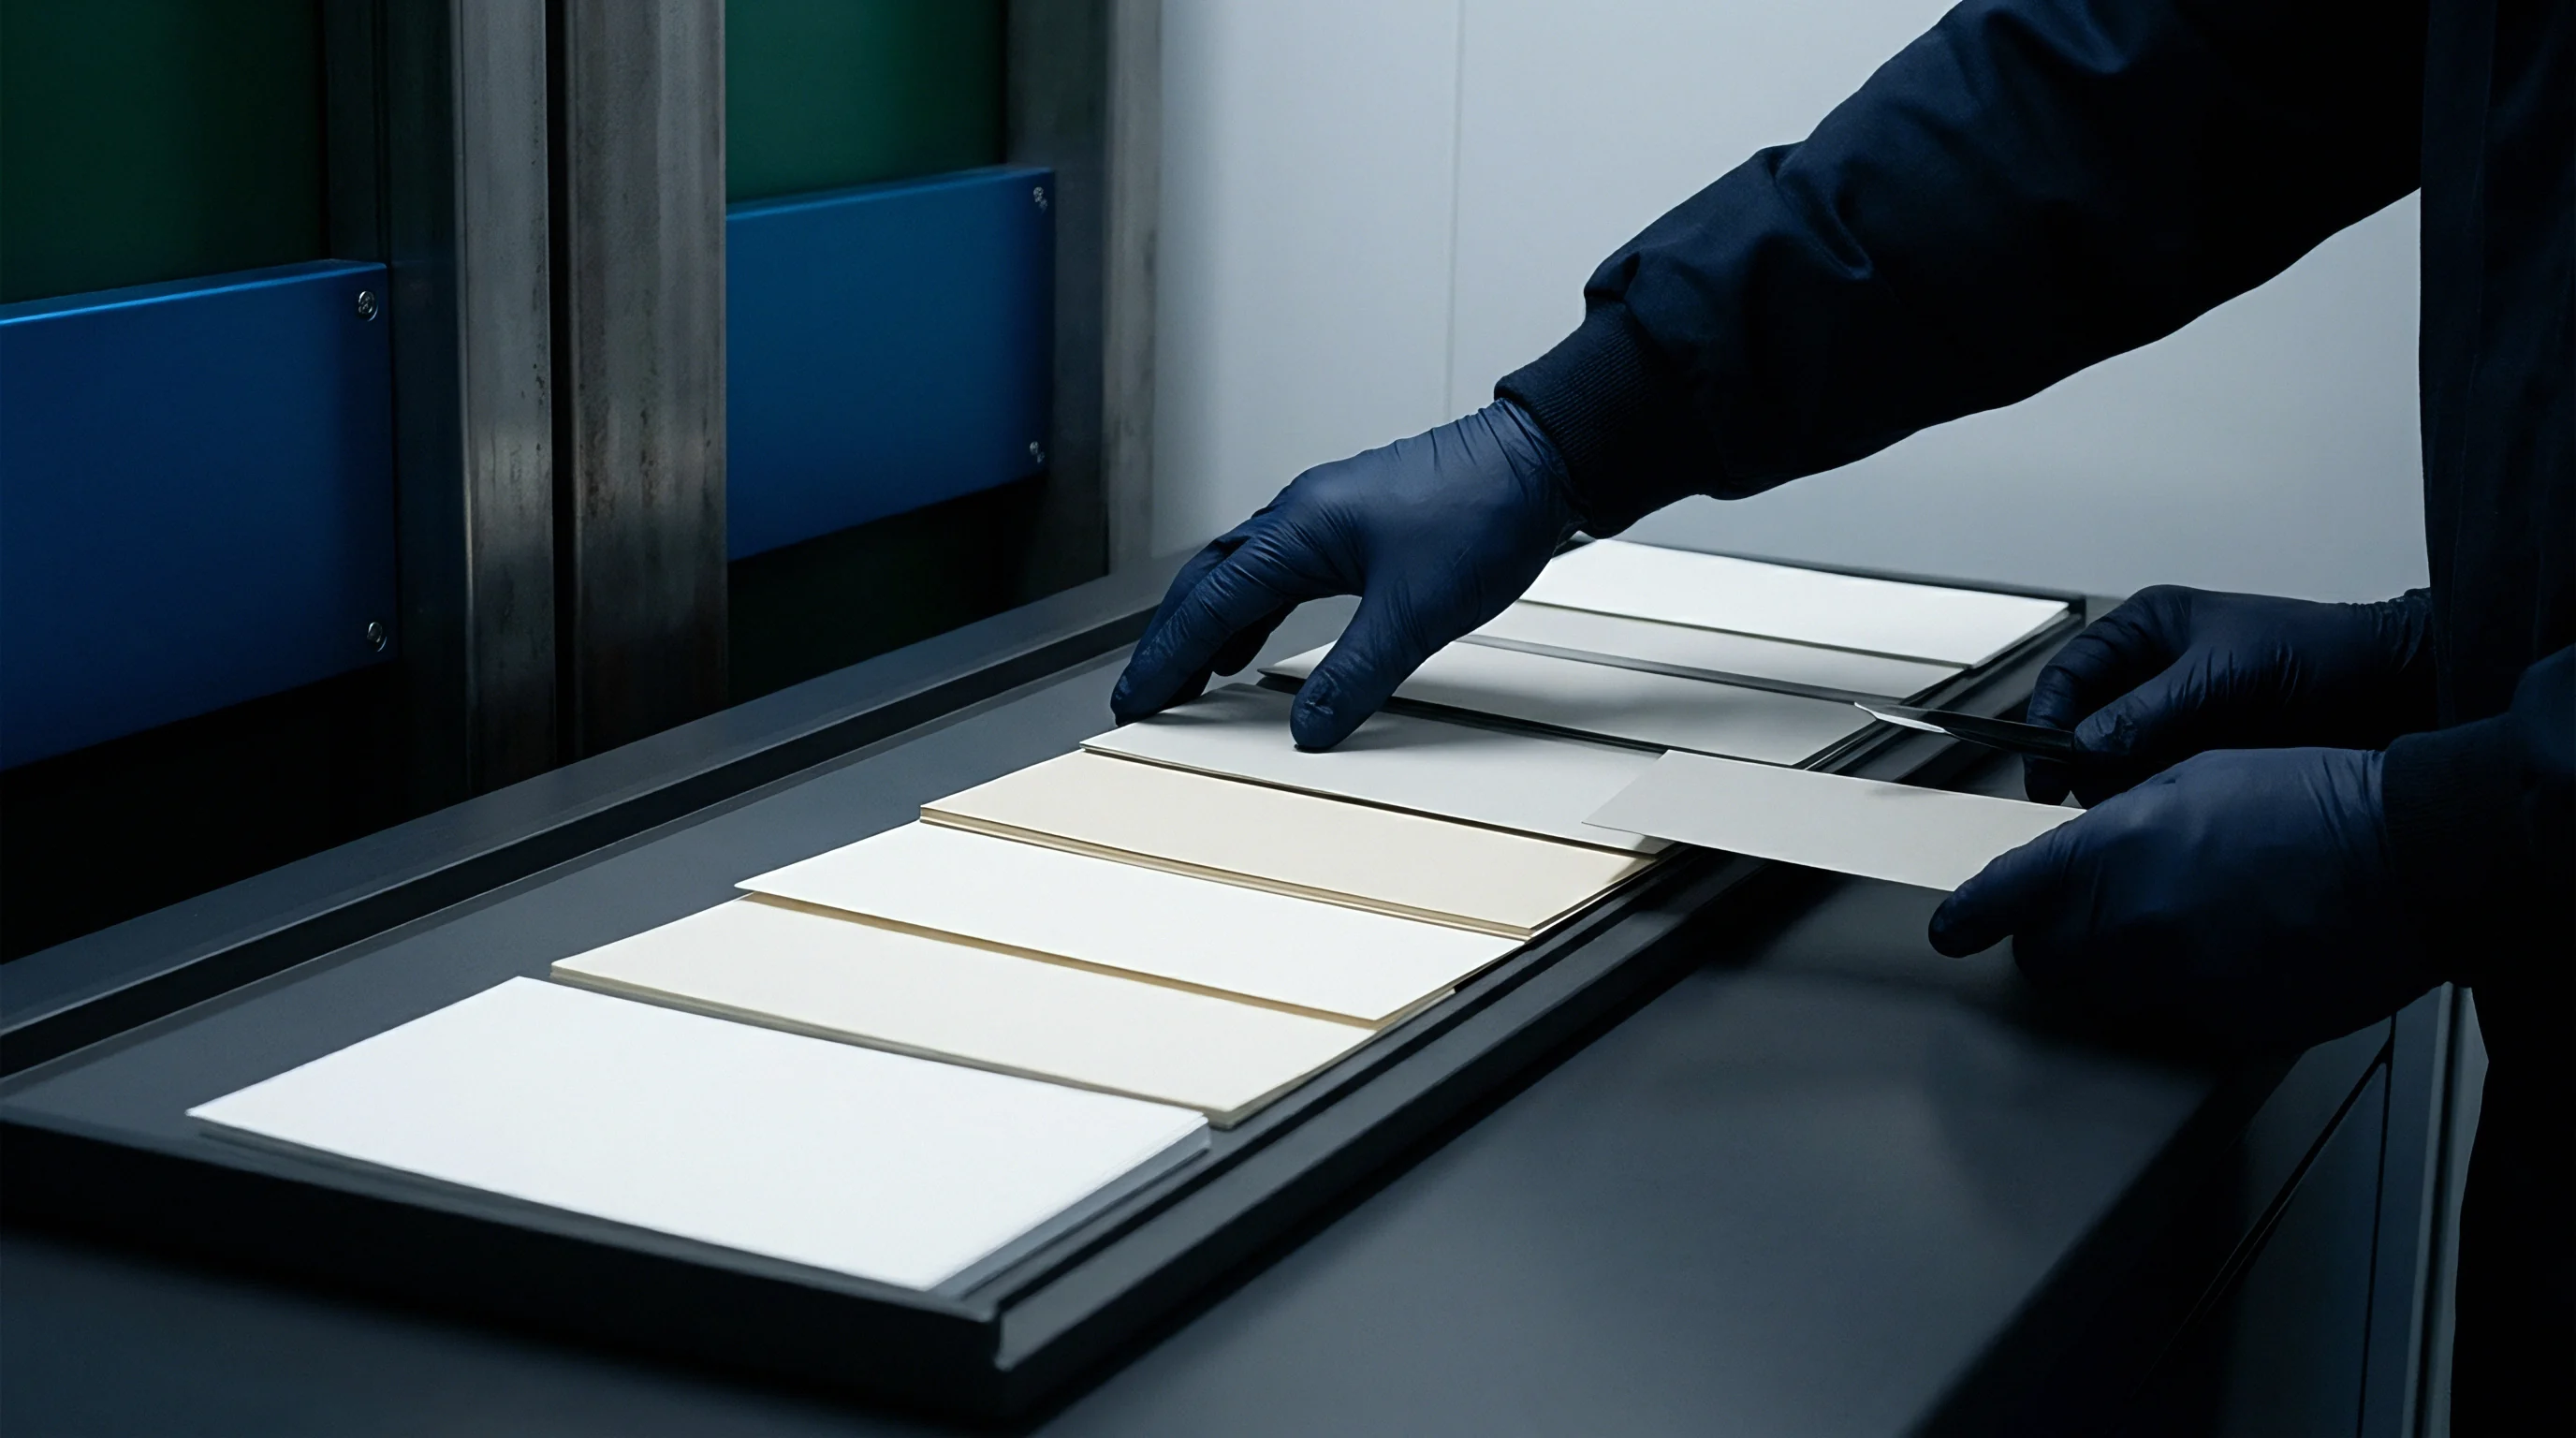
Bending stiffness governs the structural integrity of folded cartons and corrugated shipping containers during stacking and high-speed packaging line runs. High bending resistance prevents panel bulge under load and ensures predictable cartoon squareness during high-speed erection.
Why Do Laboratory Stiffness Measurements Shift between Operating Methods?
Discrepancies arise because different instruments employ distinct bending angles, specimen lengths, and load application geometry to quantify resistance to deformation. ISO 2493-1 specifies the 2-point bending resistance method using a 15° deflection angle over a 50 mm bending length, whereas ISO 2493-2 defines the Taber stiffness method operating with a 15° arc over a 50 mm width and a 38 mm or 50 mm span. Resonance methods under ISO 5629 apply dynamic vibrational excitation without static mechanical clamping.
Machine Direction (MD) stiffness consistently exceeds Cross Direction (CD) stiffness due to fiber alignment during wet-end sheet forming on the paper machine. MD/CD stiffness ratios typically range between 1.8 and 2.5 in continuous multi-ply folding boxboard grades.

Taber versus L&W Bending Resistance Mechanics
Instruments utilizing two-point bending clamp one end of the specimen while a motorized roller applies force to the free edge. Taber stiffness units expressed in milliNewton-meters (mN·m) or Taber Units (ST) relate directly to L&W 15° bending force (F15) in milliNewtons (mN) through geometric conversion factors:
ST = fracF15 × L × sin(15circ)π / 12
where L represents the test bending length (50 mm). Using improper unit conversions or comparing 7.5° bending angles against 15° standard tests creates contract disputes during board qualification.
Crease Recovery and Score Bend Verification
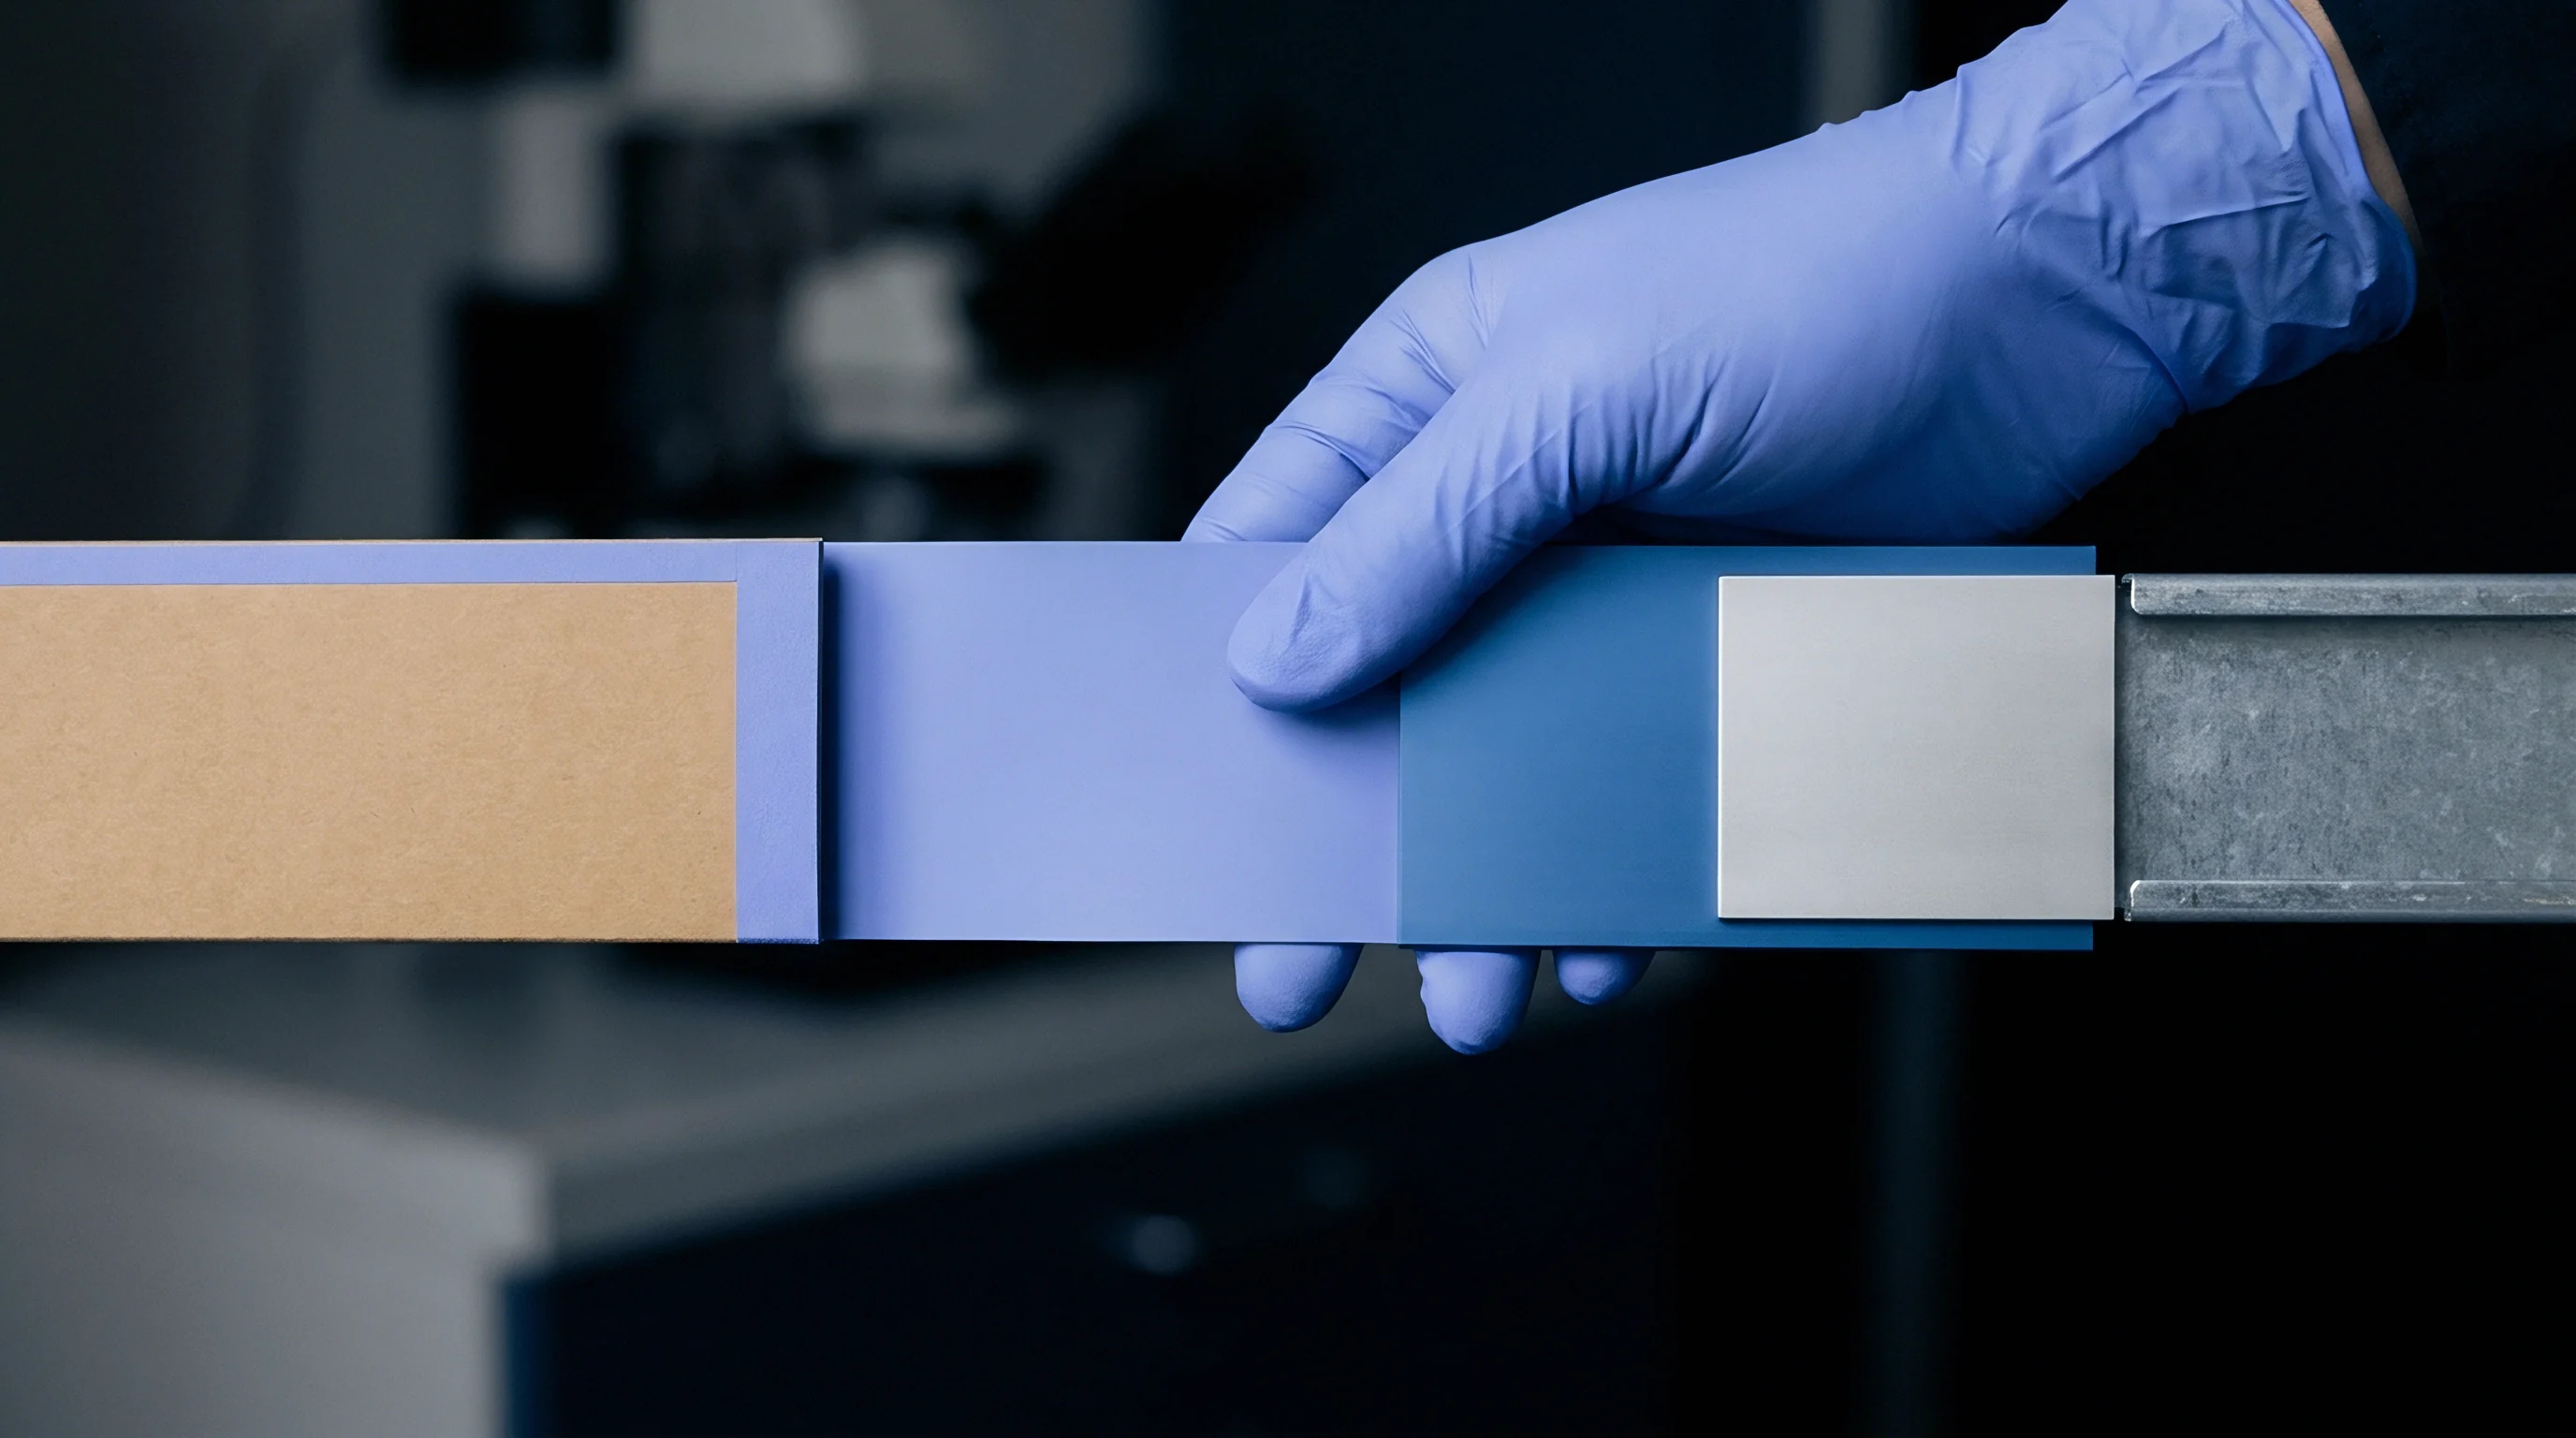
Packaging conversion requires scoring paperboard to form clean folds without fracturing top liner coats or causing excessive force during carton erection. Crease stiffness testing under TAPPI T 829 and ISO 9895 measures the bending moment remaining in a scored board line folded to a 90° angle. The ratio of creased bending force (Fc) to uncreased board stiffness (Fu) establishes the crease factor (CF):
CF = fracFcFu × 100%
Ruled creases weaken board. Angle influences bending force. Target crease factors range between 30% and 50%.
A crease factor above 60% indicates insufficient scoring, causing carton panel bow and automated gluer jams. A crease factor below 20% signals severe fiber fracture along the score line, compromising box corner stack strength.
| Method Standard | Instrument Type | Bending Angle (°) | Test Span (mm) | Specimen Width (mm) | Primary Yield Units |
|---|---|---|---|---|---|
| ISO 2493-1 | L&W 2-Point Stiffness Tester | 15.0 | 50.0 | 38.0 | milliNewtons (mN) |
| ISO 2493-2 | Taber V-5 Stiffness Tester | 15.0 | 38.0 or 50.0 | 38.1 | mN·m or Taber Units |
| TAPPI T 556 | Pneumatic Bending Resistance | 15.0 or 7.5 | 50.0 | 38.0 | milliNewtons (mN) |
| TAPPI T 829 | Score Bend / Crease Tester | 90.0 | 12.7 | 25.4 or 38.0 | milliNewtons (mN) |
Cross-direction stiffness dictates carton wall bulge under load, while machine-direction stiffness determines line speed through high-speed folder-gluers.
- Permanent Crease Shear occurs when scoring knives crush internal plies without clean fiber displacement, causing uneven carton squareness.
- Crease Springback Resistance measures residual torque in folded flaps that forces carton end closures open after adhesive application.
- Asymmetric Plies Failure develops in multi-layer board when outer liner tension exceeds inner ply compressive strength during 15-degree bending.
Section 6.3 of TAPPI T 556 invalidates stiffness data obtained from specimens containing visible score lines or watermarks within the 50-millimeter bending span, changing acceptance boundaries for converted board samples.
Bond
Internal delamination resistance quantifies the energy required to split multi-ply paperboard along its internal fibrous layers during high-speed printing and converting. Inadequate ply bond strength allows offset print tack to pick outer fibers or causes structural panel shear during creasing and folding operations.

Internal Delamination Resistance via Scott Bond
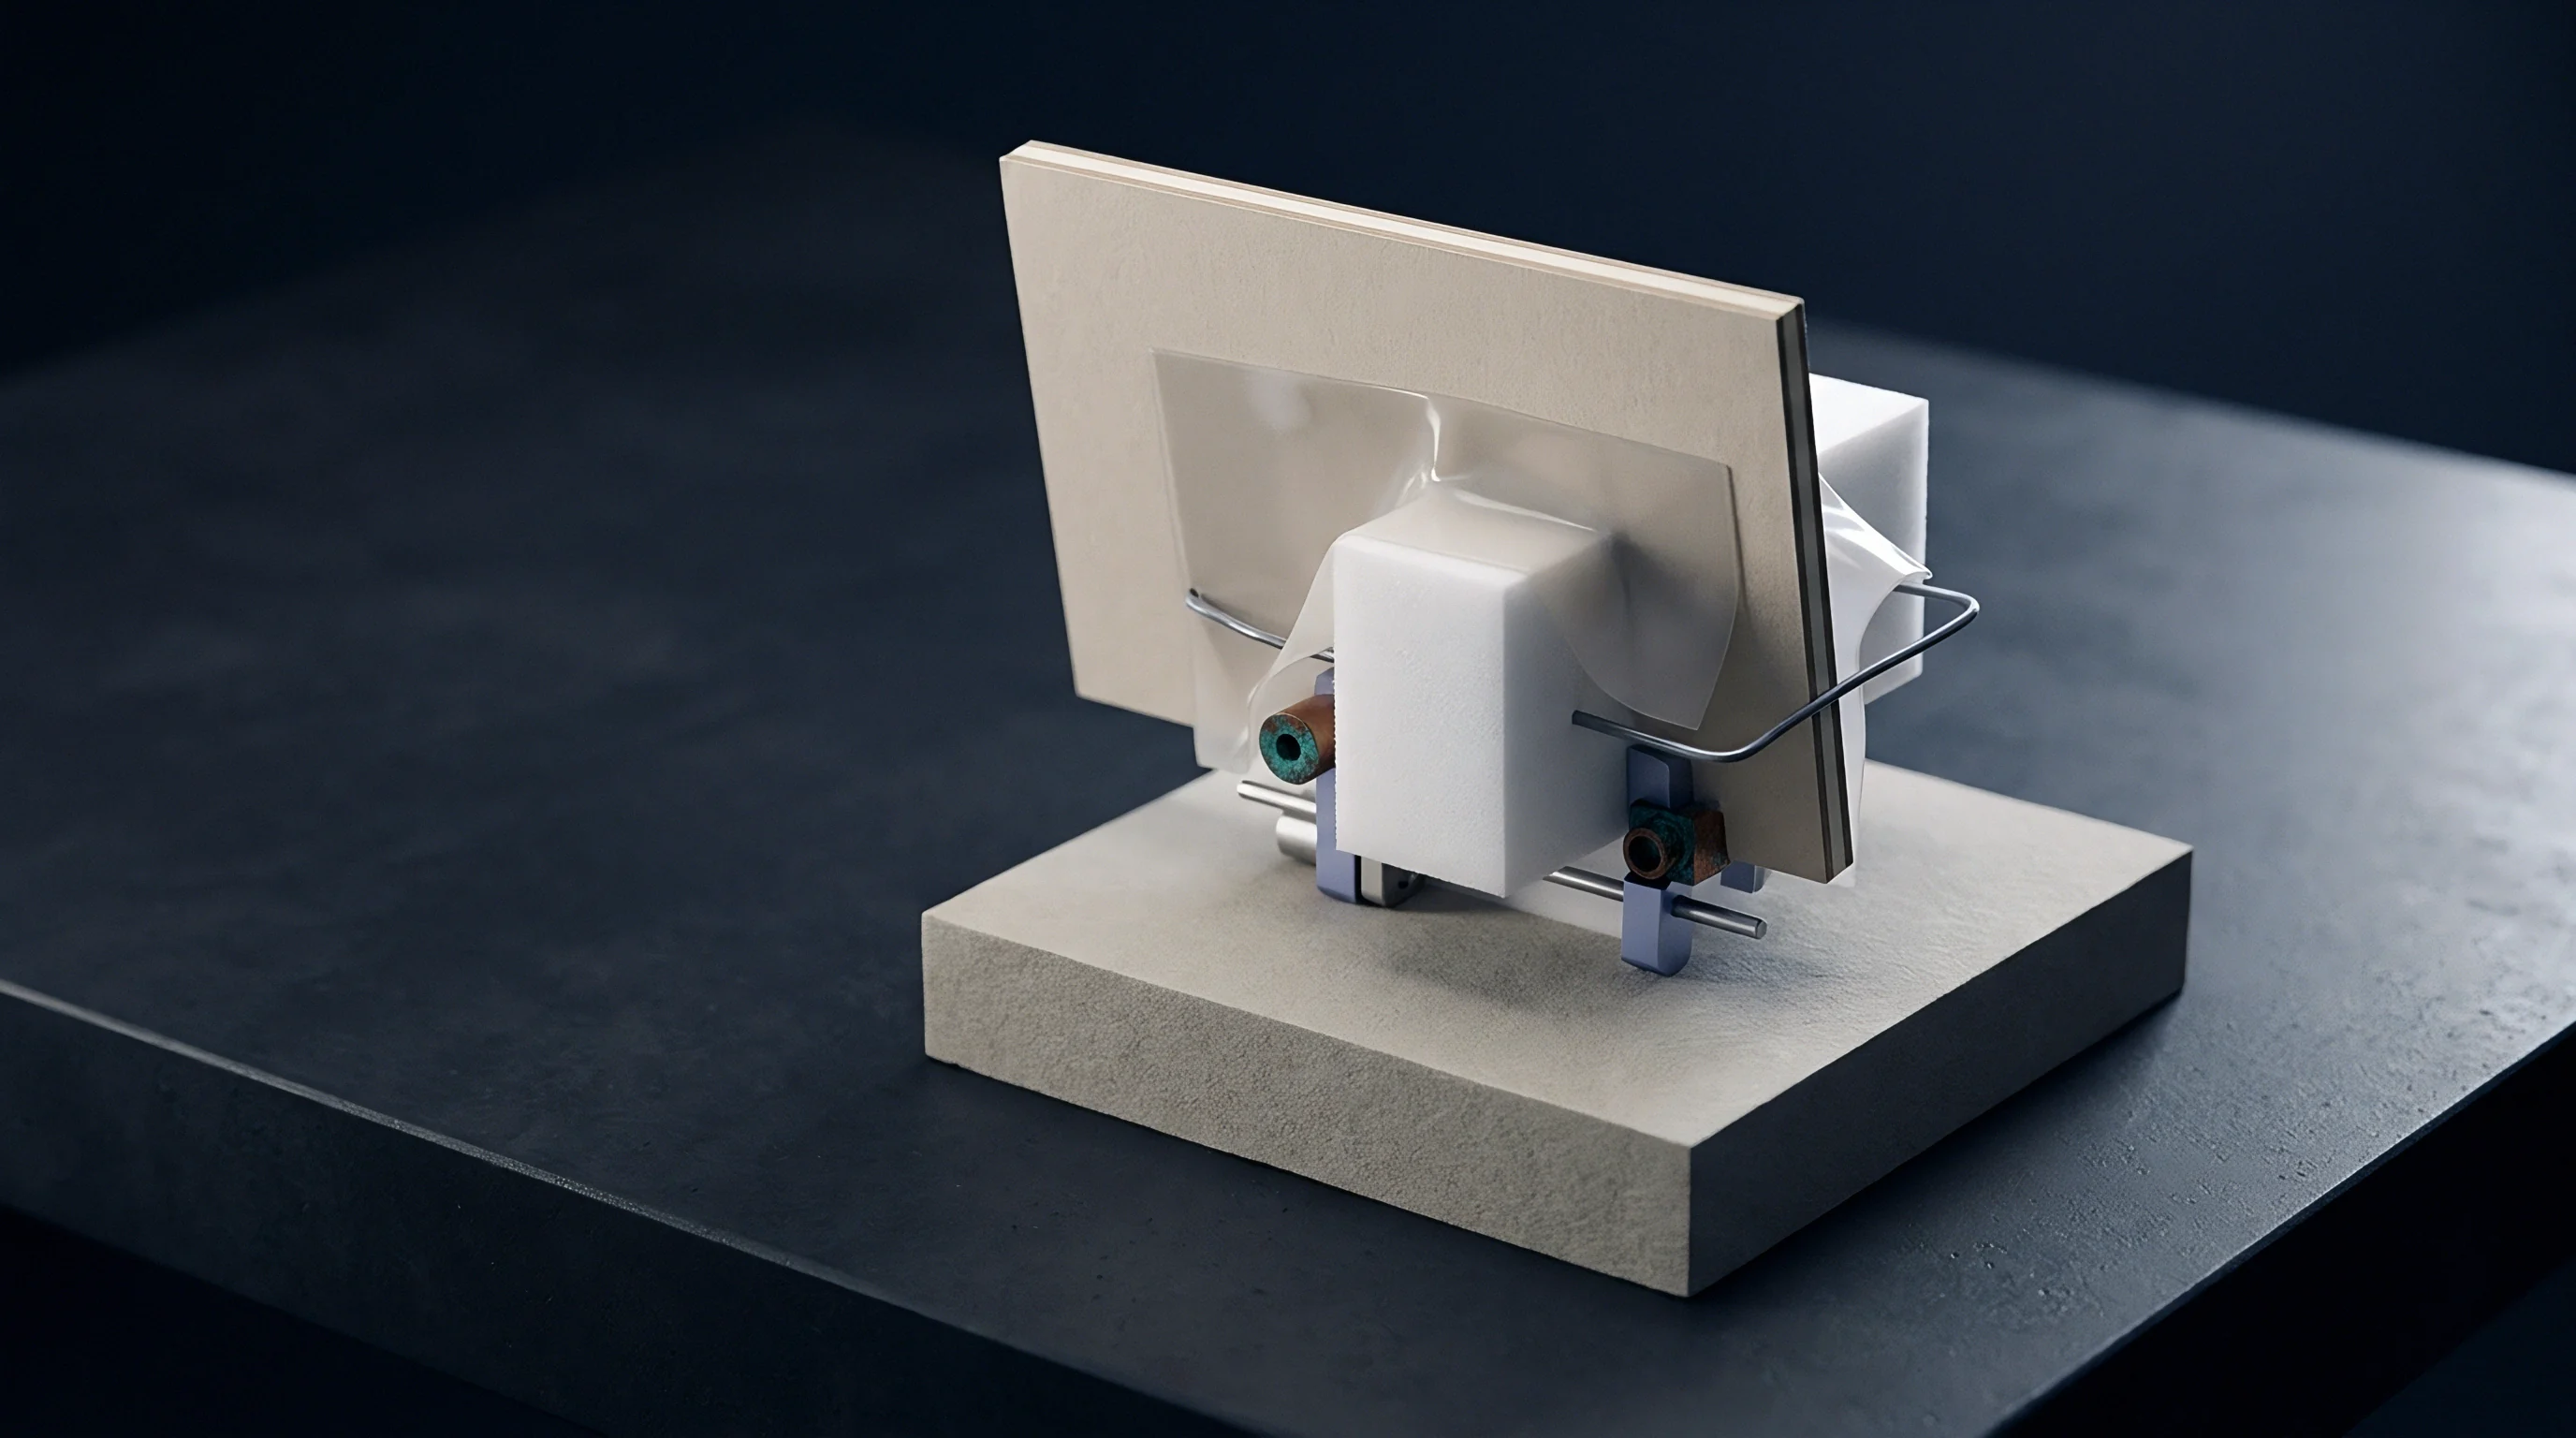
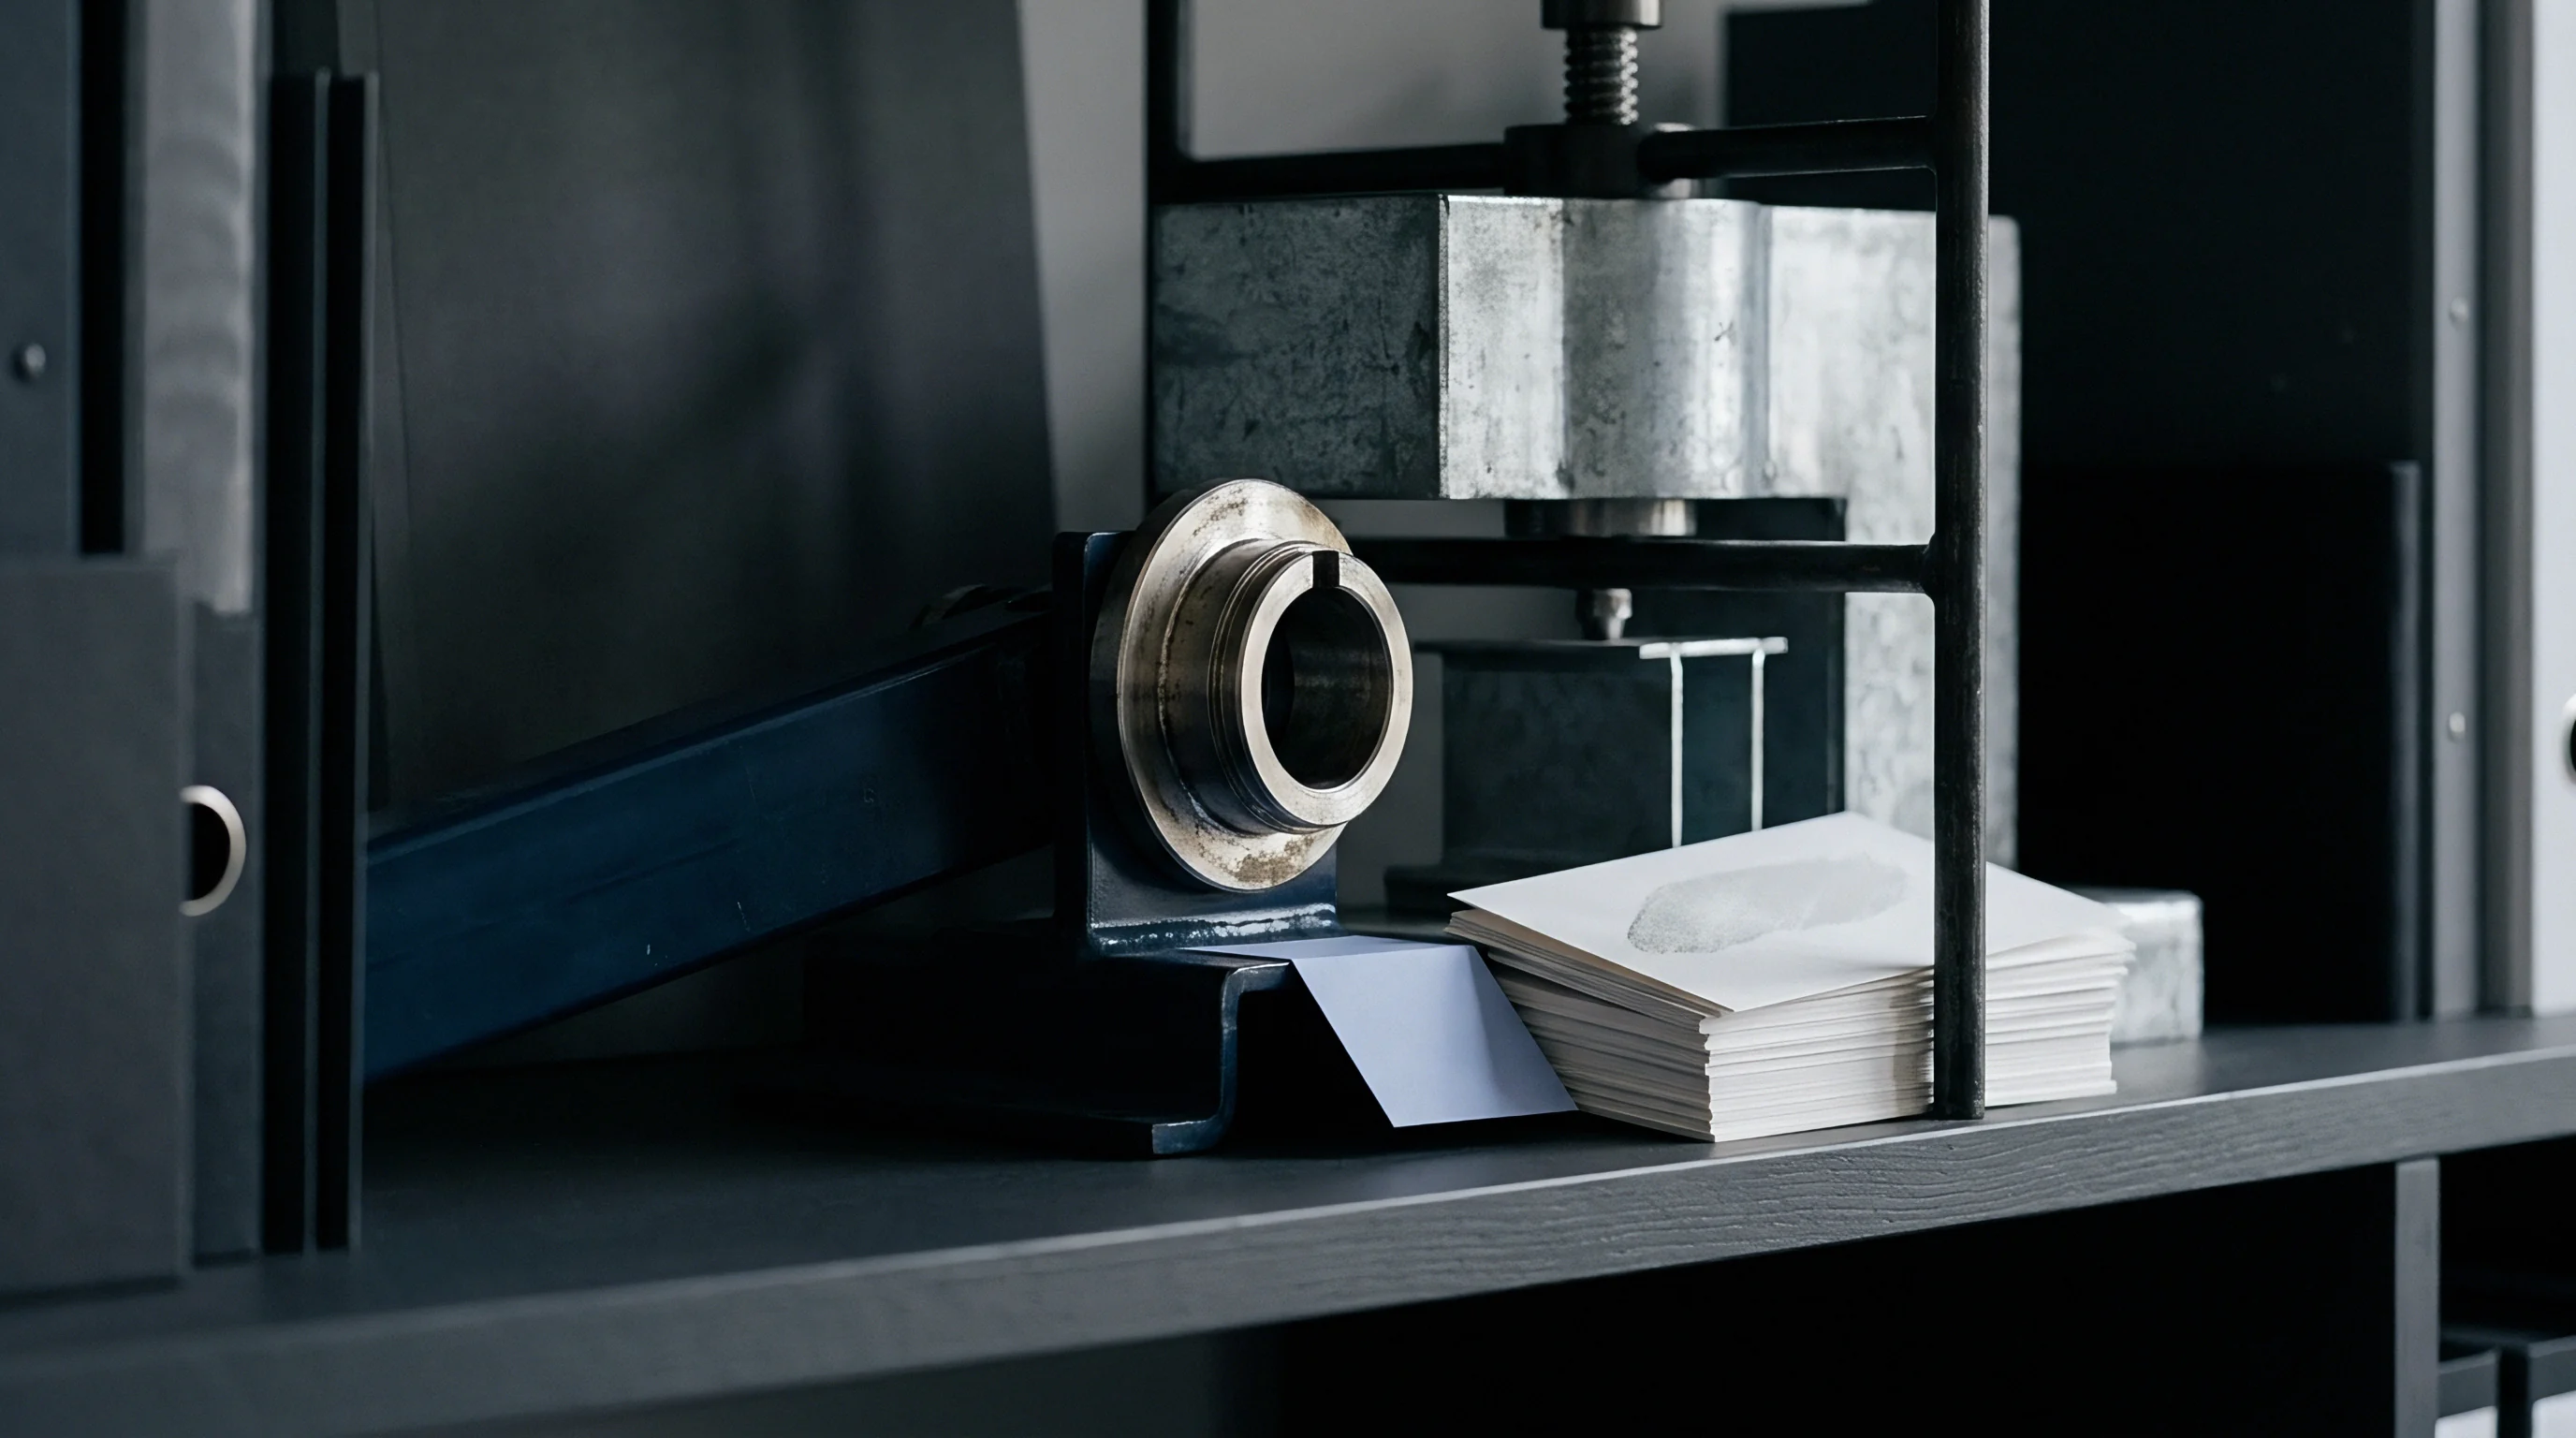
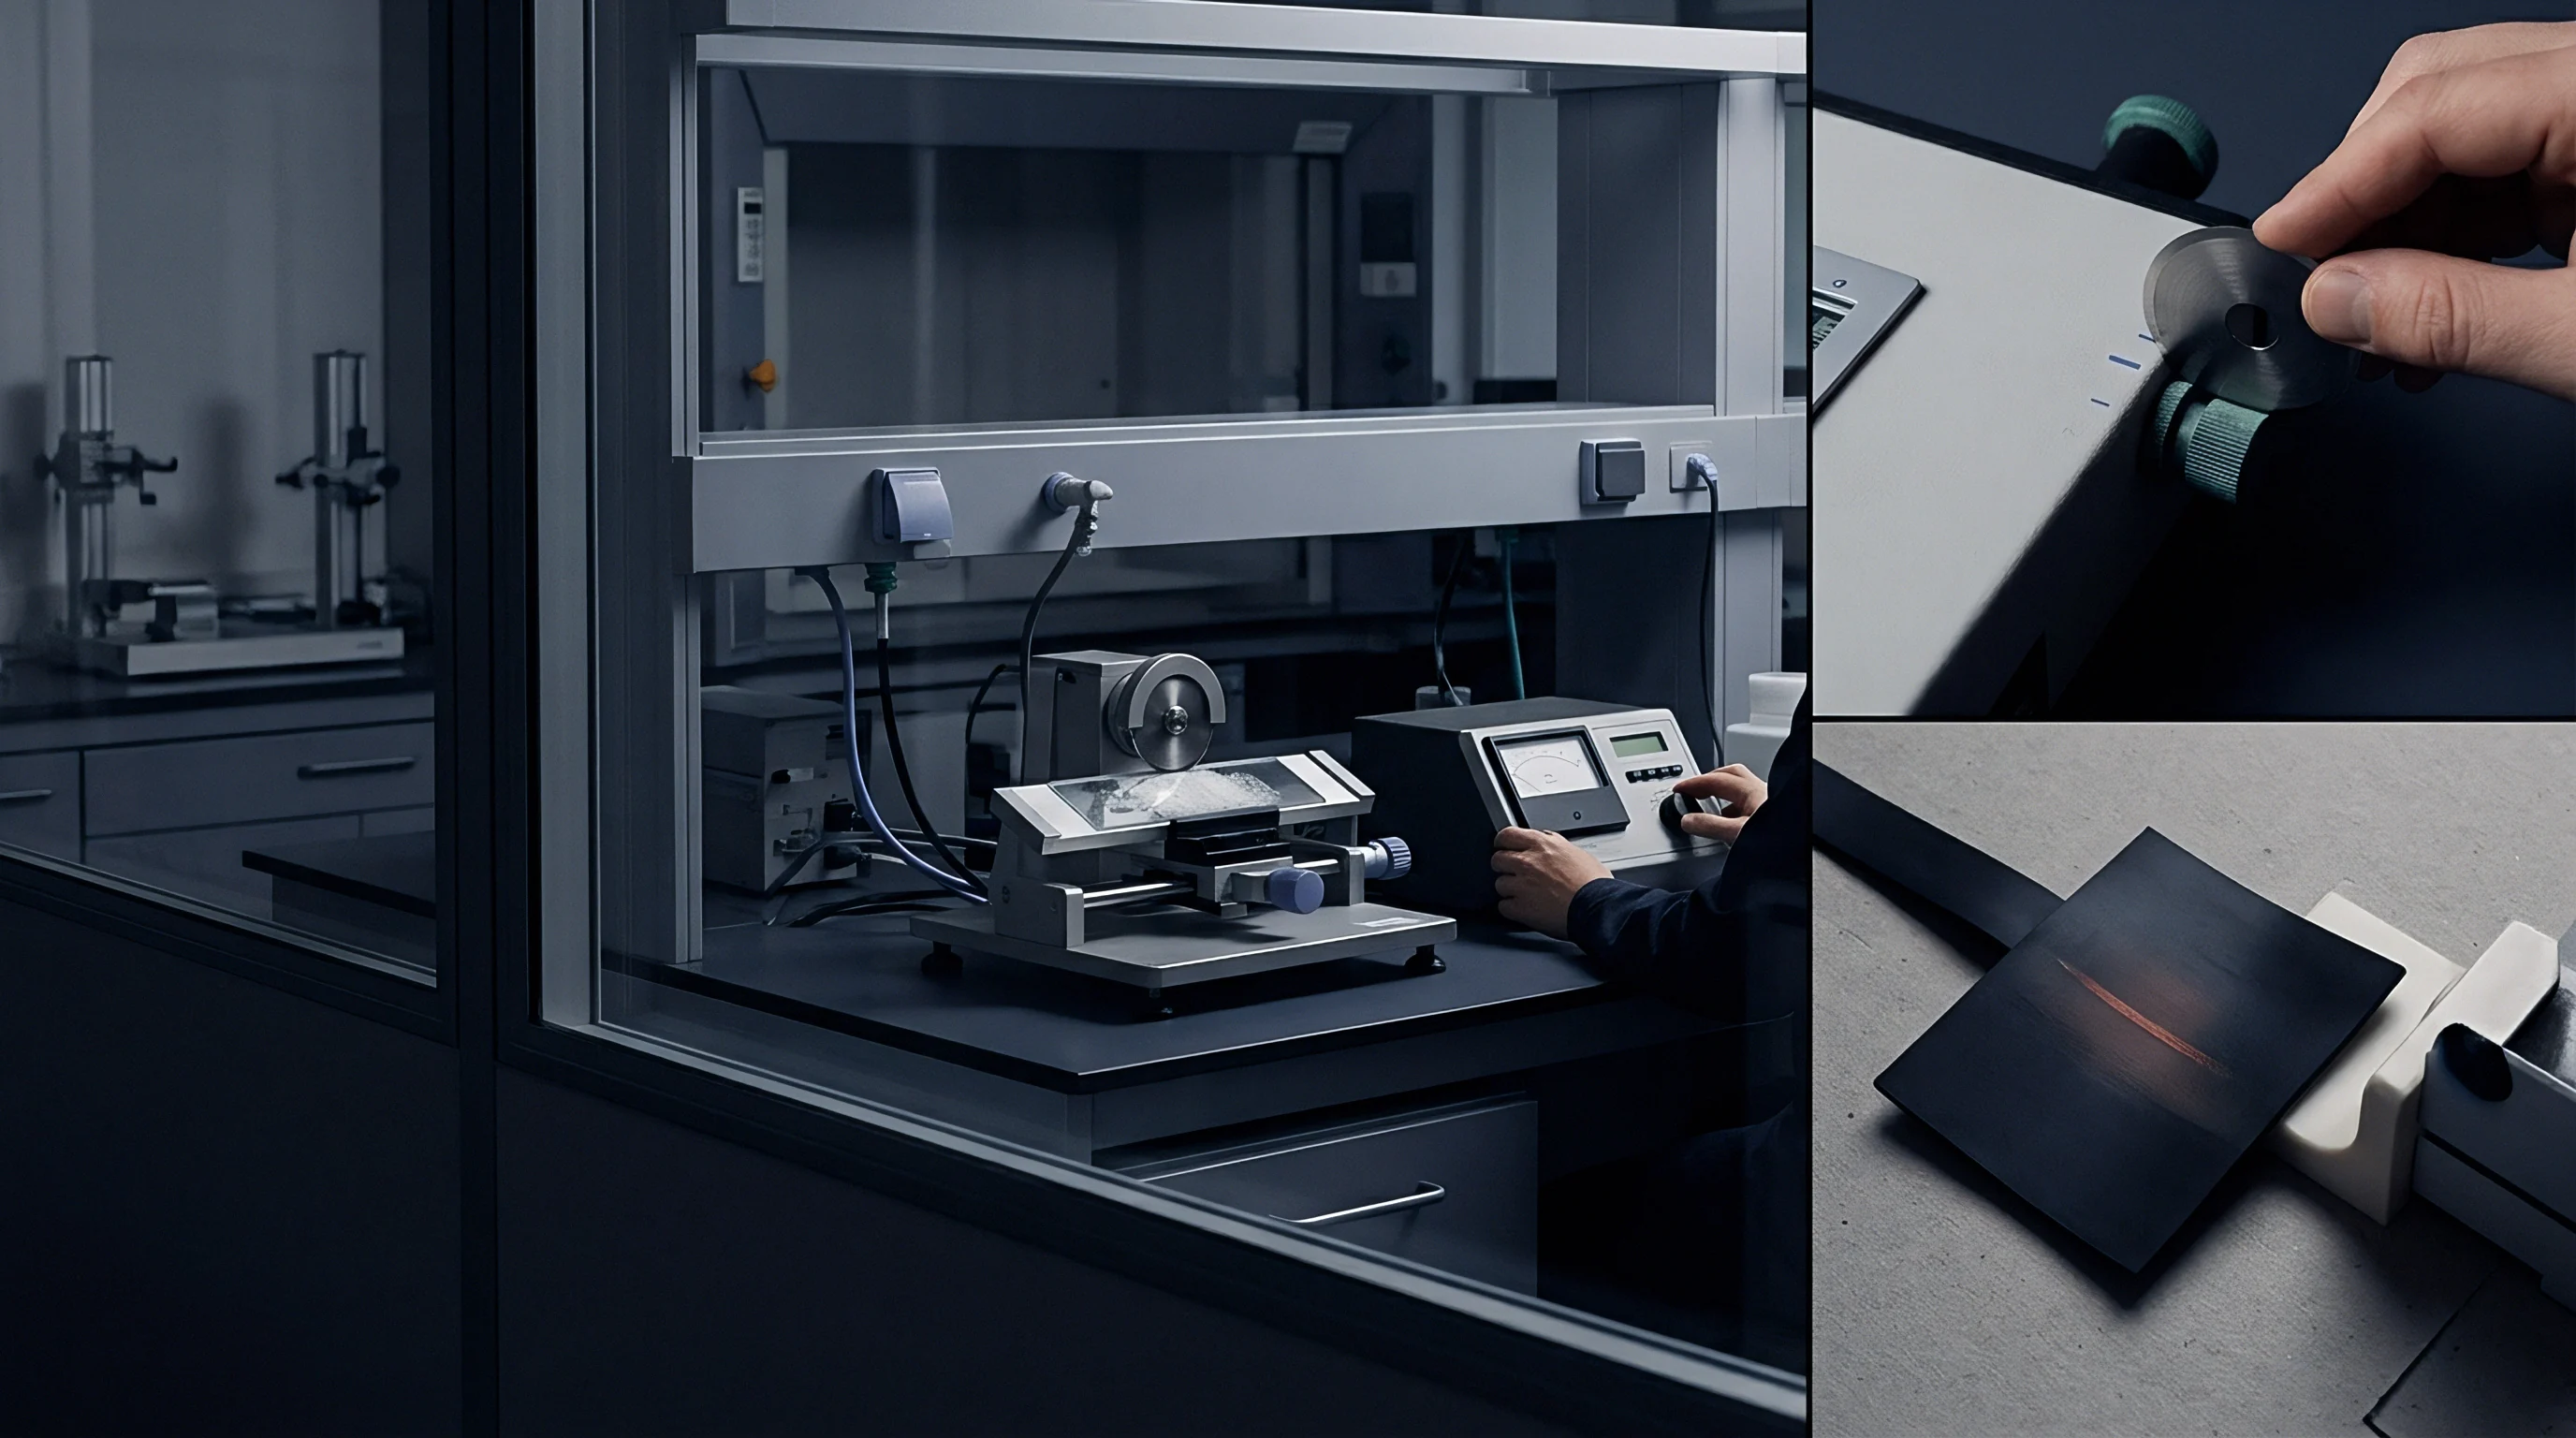
Impact testing under ISO 16260 and TAPPI T 569 utilizes a falling pendulum to strike an aluminum angle adhered to the paperboard specimen surface. Double-sided pressure-sensitive adhesive tape secures the test sample between a fixed base platen and the upper aluminum angle block. A standard pressing station consolidates the tape-paperboard assembly under a calibrated pressure of 0.7 MPa to 1.4 MPa for 3 seconds.
When the pendulum drops from its 90° resting position, it impacts the vertical leg of the aluminum angle, shearing the paperboard substrate along its weakest Z-directional internal ply interface. The instrument records energy absorption in Joules per square meter (J/m²). Typical Scott Bond values range from 150 J/m² for low-density Coated Recycled Board (CRB) up to 350 J/m² or higher for virgin Solid Bleached Sulphate (SBS) packaging grades.
Short-Span Compression and Z-Directional Tensile Limits
Axial load capacity evaluated over extremely short distances isolates fiber compression strength from structural column buckling effects. Short-Span Compressive Strength (SCT) testing governed by ISO 9895 and TAPPI T 826 clamps a single sheet between two pneumatic jaws separated by a narrow gap of exactly 0.70 mm ± 0.05 mm. Pneumatic clamping force applied at 2300 N ± 50 N prevents sheet buckling, forcing pure compressive yield across the un-clamped fiber zone.
Shear forces split plies. Delamination voids compressive strength. SCT values expressed in kiloNewtons per meter (kN/m) directly feed McKee’s formula for predicting corrugated box compression strength (BCT).
Z-directional tensile strength testing under ISO 15754 applies direct perpendicular tension through bonded metal blocks, measuring ultimate surface layer pull-off force in kiloPascals (kPa).
- Adhesive Tape Failure occurs when double-sided mounting tape delaminates from the aluminum anvil before fiber rupture develops.
- Compression Over-Consolidation alters Scott Bond values when excessive specimen preparation pressure compacts soft recycled fibers.
- Z-Direction Tension Shear introduces off-axis forces during perpendicular tensile testing if pulling jaws lack precise alignment.
- Short-Span Micro-Buckling degrades SCT compression values when specimen clamping jaws contain oil residue or surface wear.
Whether high-speed Scott Bond impact tests accurately reflect slow delamination stress experienced by heavy board cartons during prolonged stacking remains a subject of ongoing laboratory investigation.
Tolerance
Statistical acceptance sampling bridges raw laboratory measurement data and commercial contract enforcement when verifying large shipments at importing terminals. Physical property verification files serve as legal proof of compliance under cross-border purchasing agreements and environmental packing mandates.

Statistical Batch Verification and Acceptance Sampling
Representative sampling per ISO 186 or TAPPI T 400 requires taking random units across a production lot to form a statistically valid test composite. The required sample unit count (n) scales relative to total lot packages (N):
n = 0.5 × sqrtN
Individual property measurements must yield a process capability index (Cpk) exceeding 1.33 to guarantee that lot variance stays within upper and lower contractual specification limits. When verifying physical properties against purchase specifications, standard deviation calculations govern whether a batch passes or faces commercial rejection.
Verification Dossier Construction for Regulatory Compliance
Importers assemble physical test results alongside chain of custody documentation to demonstrate packaging minimisation under European Union Packaging and Packaging Waste Regulation rules. The PPWR demands documentary proof that paperboard grammage and caliper represent the absolute minimum structural mass required to fulfill product protection requirements. Over-packaging liabilities apply when board specifications exceed physical strength limits without structural justification.
| Physical Property | Primary Test Standard | Alternative Standard | Typical Commercial Tolerance | Failure Consequence |
|---|---|---|---|---|
| Grammage (Mass/Area) | ISO 536 | TAPPI T 410 | ± 3.0 % of target g/m² | Invoicing adjustment or lot rejection |
| Caliper (Thickness) | ISO 534 | TAPPI T 411 | ± 5.0 % of specified µm | Feeder jams and folder-gluer misalignments |
| Bending Stiffness | ISO 2493-1 | TAPPI T 556 | ± 10.0 % of minimum MD/CD | Carton panel bulging and stacking collapse |
| Bursting Strength | ISO 2759 | TAPPI T 807 | – 10.0 % maximum lower limit | Puncture failure during transport handling |
| Short-Span Compression | ISO 9895 | TAPPI T 826 | – 8.0 % maximum lower limit | Corrugated box compression failure |
| Internal Bond (Scott) | ISO 16260 | TAPPI T 569 | – 12.0 % maximum lower limit | Print surface picking and ply splitting |
A mill test certificate documenting compliance at origin fails to protect an importer when physical property degradation occurs during transit under uncontrolled ambient conditions.
Lot variability demands sampling. Moisture changes invalidate certificates. Customs inspect physical dossiers.
Documentary evidence verifying that paperboard physical properties meet both structural strength targets and packaging minimisation rules requires maintaining complete test records tied directly to specific reel and batch identification numbers on the import invoice.