Measuring Paper Thickness with Optical Triangulation Gauges
Optical triangulation gauges measure paper thickness without surface contact but require wavelength filtering and furnish offsets to correct light penetration depth.

Focus
Non-contact caliper profiling of paper webs relies on geometric optical triangulation to capture continuous cross-direction thickness profiles without compressing the sheet surface. Optical triangulation sensors project a focused light spot onto the substrate at a known angle and image the resulting diffuse reflection onto a linear position-sensitive detector or digital charge-coupled device. Position changes of the reflected spot along the detector array correspond directly to displacement changes of the paper surface.
When evaluating paper thickness online, single-head units measure displacement relative to a precision reference cylinder, whereas dual-head differential systems measure top and bottom displacement simultaneously across an open pass-line.
Precision measurement depends on maintaining optical alignment and beam quality. Laser diodes operating in single transverse mode generate elliptical beam spots sized to minimize spatial averaging over sheet surface structure. Optical triangulation units project light through high-numerical-aperture lenses to maintain a narrow depth of focus.
Position resolution on the detector reaches sub-micrometer levels under steady thermal conditions. Single-head setups require continuous physical contact between the sheet and the reference drum. Any air boundary layer beneath the paper web introduces clearance gaps that registration software misinterprets as increased caliper.

Geometry of Optical Triangulation Gauges
Direct distance calculation uses basic trigonometry derived from the sensor geometry. The laser diode emits a beam along an axis normal or inclined to the paper surface. The receiving lens system sits offset by a triangulation angle, focusing the diffuse light spot onto the detector matrix.
Physical displacement of the sheet along the surface normal alters the position of the focused spot across the detector elements. The system converts pixel position into physical distance using factory calibration polynomials derived from precision optical flats.
| System Parameter | Single-Head Reference Drum Setup | Dual-Head Differential Laser Setup |
|---|---|---|
| Position Resolution | 0.10 µm | 0.05 µm |
| Web Speed Limit | 1200 m/min | 2200 m/min |
| Sensitivity to Web Tilt | Low | High |
| Sheet Stability Dependency | High (requires drum contact) | Moderate (requires flutter suppression) |
| Optical Alignment Tolerance | ±1.0 mm | ±0.02 mm Coincidence |
Dual-head systems eliminate physical drum contact by mounting matched optical transducers on opposing sides of the paper web. The top and bottom sensors measure local displacement values relative to their respective mounting points. Summing the two displacement distances and subtracting the value from the total baseline optical distance yields the instant local sheet caliper.
Differential setups require strict optical coincidence between upper and lower beams. Lateral offset between upper and lower laser spots creates position errors when measuring sheets with local basis weight variations or surface topography.

Differential Dual Head Configurations
Opposing sensor heads mounted on traversing C-frames move across the web at speeds up to 500 millimeters per second. Frame flexure caused by acceleration forces and thermal gradients alters the baseline sensor gap. Optical encoders and internal inductive proximity sensors monitor frame deflection continuously, supplying real-time correction vectors to the triangulation processing software.
Spot size selection balances spatial resolution against noise. A spot size under 50 micrometers detects micro-topography, whereas a larger spot averages local roughness asperities into a stable thickness envelope.
Optical sensors record the surface envelope. Laser diodes generate high power density. Spot alignment requires precision mechanical mounts.
Differential calculations rely on simultaneous data capture. Sensor manufacturers frequently assert that high-frequency optical sampling eliminates the necessity for mechanical web stabilization, claiming algorithmic filtering cancels out out-of-plane web motion.

Transducer
Non-contact optical thickness measurement in fibrous matrices faces a physical boundary defined by light penetration. Paper webs are not opaque solid bodies. Wood fibers, mineral fillers, and internal void structures scatter incoming laser light beneath the physical plane of the surface.
Optical triangulation transducers image the centroid of the reflected light spot. When light penetrates into the sheet structure before scattering back to the detector lens, the perceived light centroid shifts deeper into the material, causing the sensor to report a thinner sheet than physically exists.
Optical penetration depth depends on furnish composition, sheet bulk, and filler loading. Uncoated mechanical pulps containing high lignin contents exhibit high light absorption, confining subsurface scattering to a shallow surface zone. Bleached chemical pulps combined with calcium carbonate or titanium dioxide pigments produce extreme internal light scattering.
Laser light enters the porous fiber matrix, undergoing multiple refraction events before exiting. The triangulation receiver sees an elongated, diffuse light spot shifted from the true geometrical reflection point.
Subsurface Light Scattering in Porous Furnishes
Subsurface light propagation alters the apparent location of the illuminated surface plane. In low-density newsprint or high-bulk packaging boards, optical penetration depth reaches 15 to 30 micrometers. Measuring a 200 micrometer sheet with an optical penetration depth of 20 micrometers yields an optical caliper measurement of only 180 micrometers unless corrected.
The degree of light scattering varies directly with local sheet density and moisture content, causing dynamic changes in optical bias across a single paper machine reel.
A 405 nanometer blue laser diode reduces optical penetration bias in uncoated mechanical furnishes by 12 micrometers compared to a 670 nanometer red emitter at 23 degrees Celsius and 50 percent relative humidity.
Fibre composition alters optical depth. Filler loading changes light refraction. Density variations shift optical calibration.
Blue lasers reduce light scatter. Subsurface refraction alters beam paths. Specular reflection originates at the surface interface, whereas diffuse reflection originates from both the surface and the internal fiber matrix.
Polarized optical receivers filter out cross-polarized diffuse light, isolating the co-polarized specular component reflected directly from the outer surface envelope.

Spectral Wavelength Selection and Coating Bias
Wavelength selection plays a primary role in controlling subsurface light penetration. Traditional optical triangulation systems utilize red semiconductor lasers operating at 650 or 670 nanometers. Red light passes easily through pure cellulose fibers and mineral fillers, maximizing penetration depth and generating significant thickness errors.
Shorter light wavelengths suffer much higher absorption and surface scattering within organic polymers and mineral crystals.
Transitioning from red diode emitters to 405 nanometer violet-blue lasers reduces optical penetration depth substantially. Blue light interacts strongly with the surface fiber layers and coating minerals, forcing the reflection centroid closer to the true physical surface boundary. Applied coatings further alter optical behavior.
Heavy clay and calcium carbonate coating formulations create an opaque, highly reflective surface layer that minimizes laser penetration. Uncoated porous sheets generate maximum penetration bias, requiring aggressive mathematical offset factors when calibrating against mechanical micrometers.
The ongoing challenge remains whether multi-wavelength sensor arrays can dynamically isolate filler-induced scattering from true physical caliper variations across high-speed coated board lines.

Web
High-speed paper machines moving at 1500 meters per minute generate aerodynamic lift forces that perturb the sheet pass-line. Out-of-plane displacement, known as sheet flutter, alters the absolute position of the paper web within the measurement range of optical triangulation transducers. While differential dual-head configurations theoretically cancel out parallel vertical web motion, real-world flutter introduces sheet angular tilt and sensor spot de-coincidence.
If the paper web tilts by even 2 degrees relative to the optical axis, upper and lower laser spots separate laterally, introducing false caliper readings across high-density regions.
Pass-line stability demands mechanical stabilization solutions within the sensor scanning track. Stabilizer plates create a controlled aerodynamic boundary layer using negative pressure. Vacuum shoes pull the moving web onto a flat ceramic surface perforated with micro-apertures.
The paper sheet slides over a thin air film, fixing the pass-line height within ±10 micrometers. Non-contact air-bearing stabilizers use opposing air jets to suspend the web between pressure pads, eliminating mechanical surface friction while maintaining out-of-plane positional stability.

Pass Line Stability and Vacuum Stabilization
Maintaining sheet flatness requires matching vacuum levels to web speed and grammage. Low-grammage tissue papers require low vacuum levels to prevent sheet tearing, whereas heavy paperboard stocks demand strong negative suction to overcome bending stiffness and tension waves. Aerodynamic drag over scanning C-frames causes local air turbulence.
Windage covers and aerodynamic cowlings enclose the optical paths, preventing boundary layer air currents from disrupting laser beam propagation.
Web stabilization shoes that hold sheet flutter within the Rayleigh range of the receiving optics eliminate cross-talk between displacement signals.
Vacuum shoes maintain pass line. Profile variations generate web breaks. Aerodynamic drag alters web stability.
Sheet tilt creates displacement error. Optical alignment prevents spot separation. The operational protocol for setting up online optical triangulation sensors follows a structured sequence on the paper machine line.
- Position the upper and lower optical sensor heads on the scanning C-frame using precision laser alignment targets.
- Calibrate the absolute zero gap between facing sensors using a certified gauge block set at 23 °C.
- Adjust the vacuum shoe air pressure to stabilize sheet pass-line height within ±50 micrometers.
- Run static zero reference passes across the full scanning width to establish frame deflection profiles.
- Verify thermal drift parameters by cycling frame temperature through its operational operating window.

Do Web Flutter Dynamics Alter Dual Sensor Coincidence?
Dynamic out-of-plane web motion alters the exact intersection points of top and bottom laser beams. When a sheet moves vertically out of the focal plane, the focal spots expand, reducing peak energy density on the position-sensitive detector. Detector processing firmware must recalculate light intensity centroids from wider Gaussian distribution curves.
High web speeds exacerbate high-frequency vibration modes, generating noise components that mask genuine caliper variations.
Sensor integration times match web velocity to prevent motion blurring. At web speeds of 1800 meters per minute, a sensor with a 100-kilohertz sampling rate collects thickness data points spaced 0.3 millimeters apart along the machine direction. High sampling rates enable digital signal processors to apply spatial filtering algorithms, separating micro-roughness frequencies from macroeconomic caliper trends.
Out-of-plane vibration frequencies under 500 hertz are isolated and removed through real-time differential subtraction routines.
Failing to suppress out-of-plane sheet motion forces continuous sensor recalculations, introducing caliper errors that cause over-calendering and ruined sheet bending stiffness.


Resolution
Caliper data gathered by non-contact optical triangulation rarely matches values from ISO 534 dead-weight micrometers without empirical transformation. ISO 534 defines paper thickness as the distance between two plane, parallel circular anvils applying a static pressure of 50 kilopascals over an area of 200 square millimeters. Mechanical anvils crush surface asperities and compress the internal fiber structure during measurement.
Optical triangulation gauges measure the uncompressed external envelope of the sheet surface, modified by light penetration effects.
| Substrate Grade | Grammage (g/m²) | Bendtsen Roughness (mL/min) | ISO 534 Contacting Caliper (µm) | Optical 670nm Caliper (µm) | Optical 405nm Caliper (µm) | Uncorrected Delta (µm) |
|---|---|---|---|---|---|---|
| Bleached Softwood Kraft | 80 | 250 | 102.4 | 91.2 | 105.8 | -11.2 |
| Newsprint (TMP Furnish) | 45 | 150 | 68.1 | 58.5 | 69.3 | -9.6 |
| Coated Folding Boxboard | 280 | 35 | 385.0 | 381.2 | 387.1 | -3.8 |
| Triple Coated Fine Paper | 150 | 15 | 135.2 | 134.8 | 136.0 | -0.4 |
| Uncoated Recycled Testliner | 140 | 800 | 195.0 | 178.5 | 198.4 | -16.5 |
Empirical correlation models convert raw optical displacement measurements into equivalent ISO 534 contacting values. The conversion relies on a linear regression equation incorporating surface roughness parameters and furnish-specific penetration constants. Uncoated rough grades exhibit large positive discrepancies when measured with short-wavelength optical sensors because light bridges compressional valleys without depressing the surface.
Red lasers yield negative discrepancies on porous white sheets due to heavy subsurface scattering dominance over roughness effects.
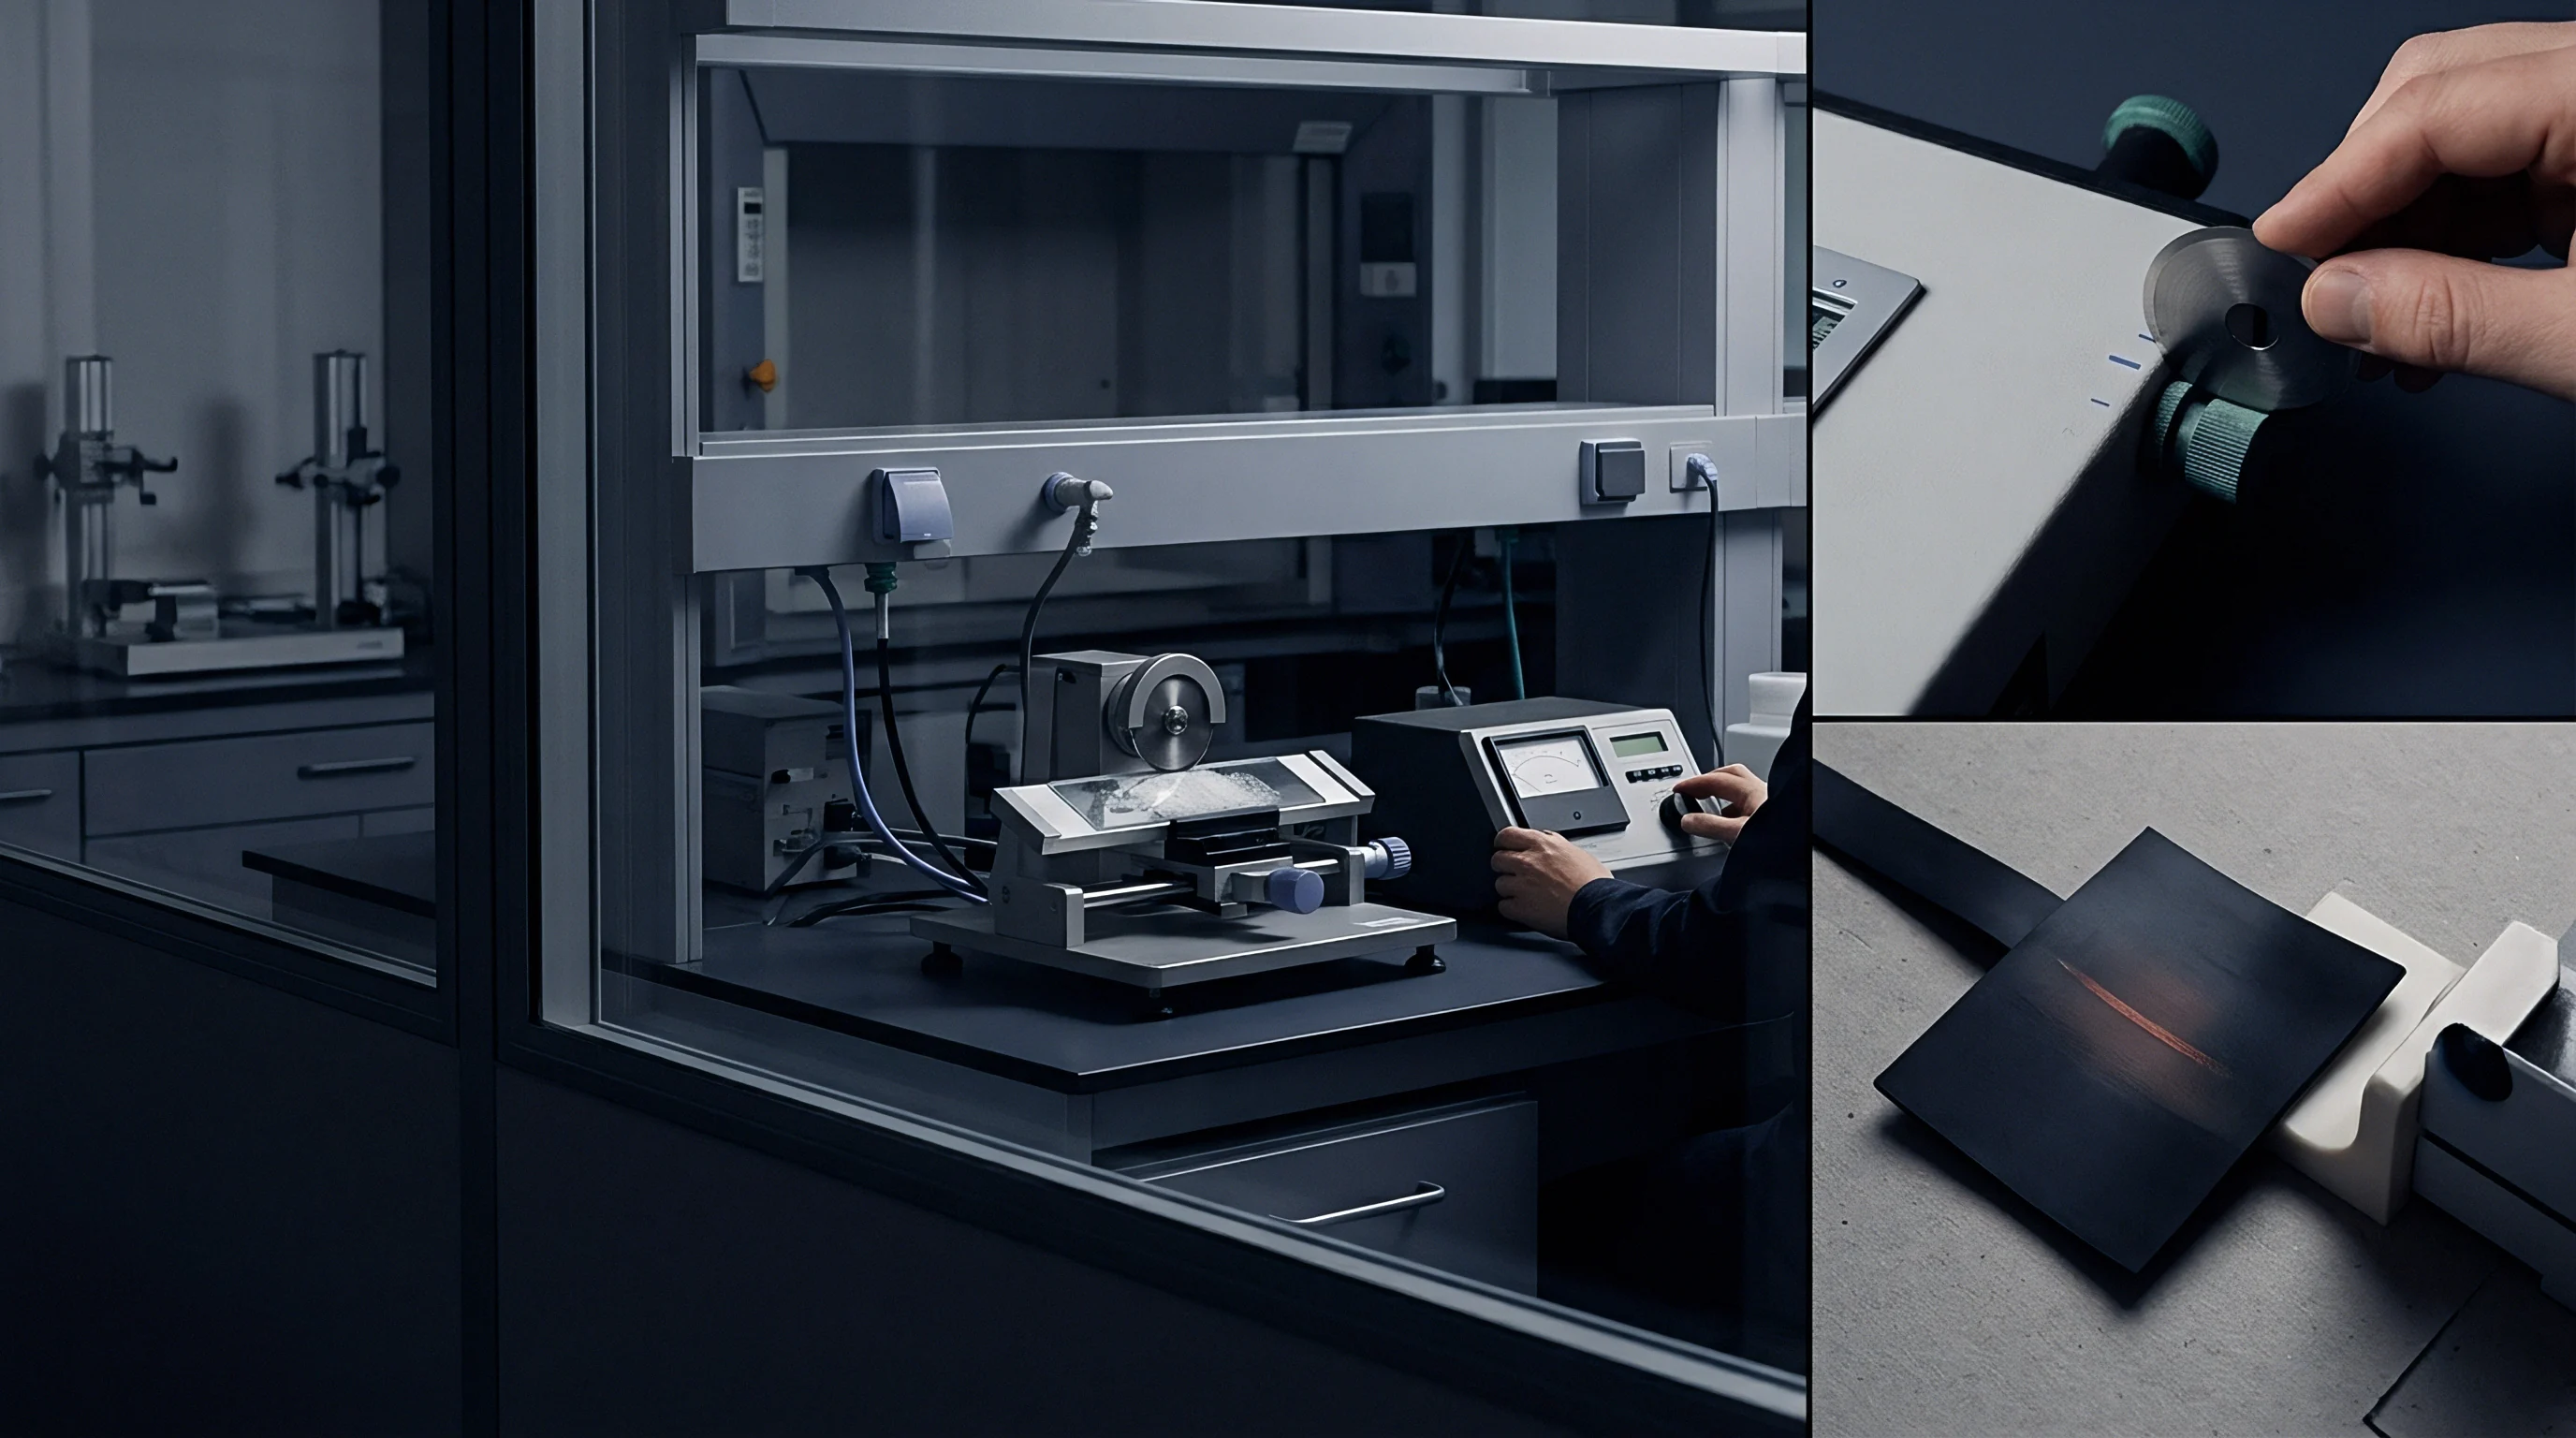
Correlation Models for Dead Weight Contact Standards
Establishing correlation algorithms requires off-line reference testing on paper samples conditioned to ISO 187 standards at 23 °C and 50 percent relative humidity. Laboratory technician protocols demand taking dead-weight micrometer measurements at exact physical locations previously scanned by an off-line optical triangulation bench rig. Fitting regression lines yields mathematical offset constants and slope correction coefficients customized for each paper grade produced on the machine line.
Mill specifications defining caliper under ISO 534 override online optical triangulation profile logs during commercial lot acceptance disputes.
Dead-weight micrometers apply mechanical force. Contacting anvils compress surface peaks. Calender rolls establish baseline bulk.
Coating layers flatten surface roughness. Roughness values dictate compression offsets. Optical gauge calibration routines rely on strict verification parameters before validating online measurements against certified lab standards.
- Static Optical Calibration Blocks Verification of baseline optical gap requires quartz optical flats with certified thickness tolerances under ±0.1 micrometers.
- Furnish Penetration Offsets Every furnish blend requires dedicated optical-to-contact offset curves to adjust for density and filler changes.
- Thermal Frame Compensation Scanning C-frames expand thermally, necessitating real-time laser distance feedback from frame temperature sensors.
- Surface Glaze Adjustments Highly calendered surfaces demand altered specular reflection thresholds within the sensor processing firmware.

Empirical Calibration Workflows across Furnish Grades
Gauge Repeatability and Reproducibility studies assess the capability of optical triangulation installations. A capable measurement system demonstrates a precision-to-tolerance ratio under 10 percent when assessing tight commercial caliper bands. Optical noise originating from electronics, laser power drift, and ambient light interference contributes to systemic measurement variance.
Temperature-controlled sensor enclosures equipped with monochromatic narrow-pass optical filters block background mill lighting, isolating the specific laser emission wavelength.
Density shifts alter calibration accuracy. When a mill increases recycled fiber content in a packaging linerboard grade, the altered absorption coefficient shifts optical light penetration depth. If the online control system retains the optical calibration curve derived from 100 percent virgin kraft furnish, the triangulation system reports false thickness increases.
Machine operators respond by increasing calender nip pressures, accidentally crushing the sheet and dropping structural stiffness below contract specifications.
Standard purchasing contracts incorporating ISO 534 testing requirements stipulate that non-contact optical profile logs serve strictly as process control tools, leaving offline contacting micrometers as the sole binding referee during claims.


Allowance
Target caliper specification limits govern the tonnage shipped off the reel and the functional performance of the finished carton. Converting operations demand uniform cross-direction thickness profiles to ensure predictable carton feeding, precise creasing, and reliable box compression strength. Online optical triangulation profiling provides real-time thickness feedback to automatic profile control actuators on calender stacks and diluting headboxes, tightening cross-direction thickness variance bands.
| Operational Parameter | Legacy Contact Gauge Control | High-Resolution Optical Profile Control |
|---|---|---|
| Target Sheet Caliper | 350.0 µm | 350.0 µm |
| Cross-Direction Caliper Variance (±3σ) | ±15.8 µm (±4.5 %) | ±5.25 µm (±1.5 %) |
| Mean Operating Grammage | 240.0 g/m² | 232.5 g/m² |
| Tonnage Yield per 40-Tonne Batch | 166,666 m² | 172,043 m² |
| Additional Delivered Area | Baseline | +5,377 m² (+3.23 %) |
| Cost Savings per 40-Tonne Reel Lot | Baseline | $4,516 Savings |
Tightening cross-direction caliper variation allows paper mills to target lower average basis weights without breaching minimum caliper guarantees. Paperboard buyers purchase stock by the tonne but sell converted units by the area or individual folding carton. Downgauging grammage while holding target caliper yields more square meters of board per tonne of fiber purchased, creating substantial monetary returns across continuous production runs.

Yield Economics of Optical Profile Control
Evaluating a 40-tonne order of 350 micrometer folding boxboard demonstrates the financial return of optical profile control. Legacy contacting gauges with wide profile error bands force the mill to run at an elevated average grammage of 240 grams per square meter to ensure no point across the web drops below the 335 micrometer minimum functional threshold. High-resolution optical triangulation systems, operating with 405 nanometer blue lasers and vacuum web stabilization, hold cross-direction caliper variation within a tight ±1.5 percent tolerance band.
Tight profile control allows the mill to safely shift the average target grammage down to 232.5 grams per square meter while maintaining the exact same 335 micrometer minimum physical caliper guarantee. This 3.23 percent reduction in grammage yields an additional 5,377 square meters of usable board per 40-tonne reel lot. Assuming a base packaging board price of $1,400 per tonne, the yield enhancement yields $4,516 in raw material fiber savings on a single 40-tonne mill order.
| Profile Control Quality Level | Grammage Shift Potential (g/m²) | Yield Gain per 100 Tonnes (m²) | Landed Cost Savings per 100k Cartons |
|---|---|---|---|
| Uncontrolled Drift (±6.0 %) | 0.0 (Baseline) | 0 | $0.00 |
| Legacy Mechanical (±4.5 %) | -4.5 | 5,400 | $780.00 |
| Standard Optical Red (±2.5 %) | -10.2 | 12,600 | $1,820.00 |
| Advanced Optical Blue (±1.5 %) | -15.0 | 18,900 | $2,730.00 |

Commercial Specification Limits and Downgauging
Reel yield determines landed cost. Stiffness governs carton runnability. Grammage drift alters light absorption.
Caliper variations create printing misregistration. Profile control optimizes sheet area. Mismanaged optical gauges generate severe commercial consequences across converting and packaging supply chains.
- Unintended Sheet Weight Drift Uncompensated laser penetration leads operators to increase calender pressure, unnecessarily stripping sheet bulk.
- Cross-Direction Crease Cracking Undetected localized thin spots reduce structural stiffness, resulting in package failure on high-speed cartoning lines.
- Reel Trim Spoilage Profile drift near the reel edges forces trim rejections when caliper falls outside certified customer windows.
- Excessive Material Usage Over-specifying sheet thickness to guarantee minimum stiffness inflates raw material costs across long packaging production runs.
Substrate specifications must establish clear testing protocols governing optical gauge calibration. When paper mills replace legacy contacting nuclear or mechanical caliper sensors with optical triangulation units, supply contracts require updated correlation curves that account for furnish scattering biases. Packaging buyers auditing mill certificates must verify whether reported thickness values represent true ISO 534 dead-weight micrometer tests or uncorrected optical envelope measurements.
Maintaining narrow cross-direction caliper bands preserves sheet stiffness while maximizing landed sheet yield across high-volume folding boxboard conversions.