Commercial Landed Cost Variance Mechanics and De Inkability Fee Surcharges in Packaging Grade Substitution
Commercial landed cost variance depends on sheet yield, press spoilage, and EPR de-inkability fee surcharges triggered by grade substitution.
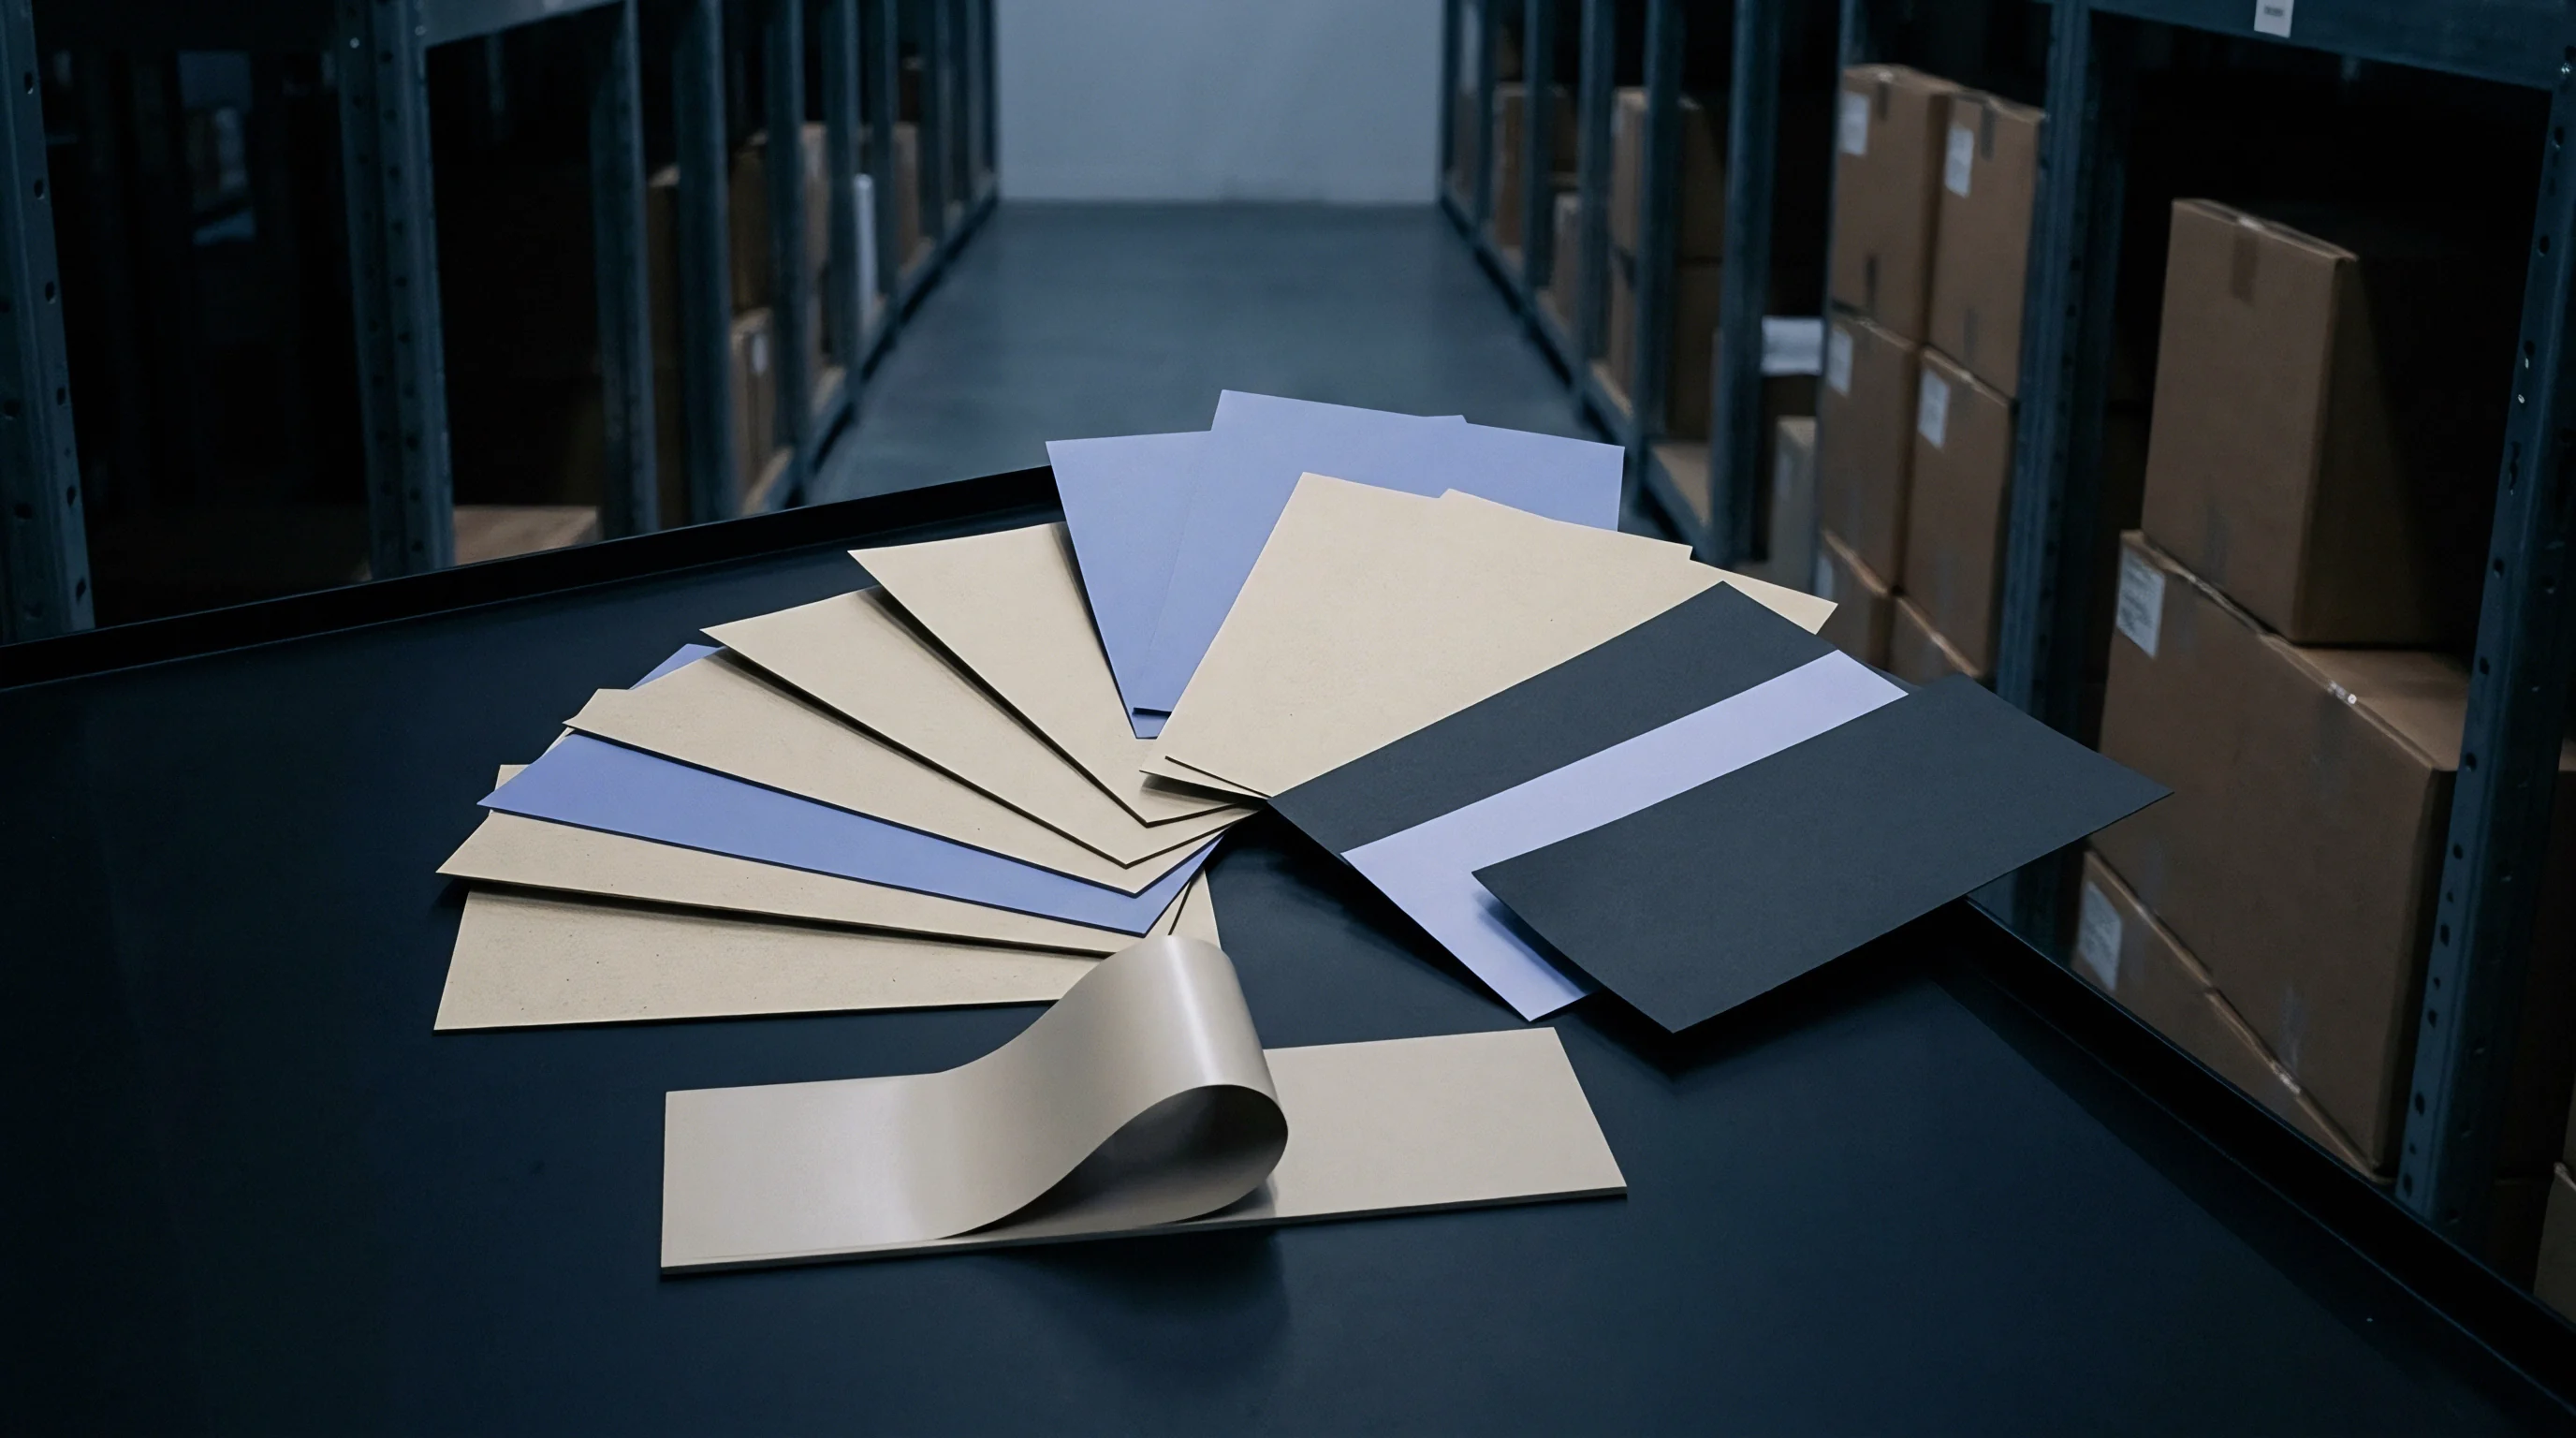

Sheet
A micrometer anvil closing on a board sample at 50 kilopascals pressure exposes the structural reality of mill grade swaps. Paper is purchased by mass, but presses print by surface area. When a packaging specification substitutes virgin folding boxboard (FBB) with coated recycled board (CRB or WLC), the purchase order records a lower price per metric tonne.
That initial price advantage on the invoice may look favorable, but whether it survives conversion into finished cartons depends entirely on how basis weight, caliper, and bending stiffness interact.
Swapping substrates changes the actual volume of wood fiber hitting the pressroom floor. Virgin bleached chemical pulps deliver high stiffness at lower overall sheet density. Recycled furnish is packed with shortened, repeatedly dried fibers and mineral fillers that pull down internal bond strength and bulk.
Matching bending resistance on a packaging line requires running a thicker caliper or accepting sagging pallets.
Equivalence Curves in Substrate Swaps
Bending stiffness determines whether a carton holds its shape under vertical stacking loads. Under ISO 2493-1, bending resistance measures the force needed to deflect a vertical sample by 15 degrees. That stiffness scales with the elastic modulus of the outer liners and the cube of sheet caliper.
Moving from Solid Bleached Sulfate (SBS) to Coated Recycled Board (CRB) causes a sharp drop in elastic modulus because of degraded fiber quality.
High bulk saves mass, so maintaining stiffness across a grade swap requires direct recalibration. If a 300 grams per square meter SBS board at 380 micrometers caliper is swapped for recycled chipboard, matching that 15-degree bending resistance takes a caliper bump to roughly 440 micrometers. That extra thickness pushes basis weight up to 370 grams per square meter.
Recycled stock might carry a price per tonne fifteen percent lower than virgin board, but the mass needed to make one thousand identical cartons jumps by twenty-three percent. Yield per metric tonne drops accordingly, wiping out the expected savings before the job ever hits the press.
ISO 534 thickness tolerances permit a plus or minus five percent caliper variance across a single production reel.
Basic mechanics set the boundaries for any substrate swap. Comparing mill certificate data against delivered reel performance catches potential line failures before processing. Flexural rigidity rests mostly on the tensile strength of the outer liners.
In virgin FBB, mechanical pulp sits sandwiched between dense layers of bleached chemical pulp, maximizing the sheet’s moment of inertia. Recycled multi-ply board lacks this distinct layering, yielding a lower flexural modulus per unit of basis weight.
Density Shift and Caliper Scaling
Compacting furnish alters the volume wood fibers occupy in the sheet. Density is simply basis weight divided by caliper, expressed in grams per cubic centimeter, while bulk is its inverse. Solid bleached boards sit around 0.80 grams per cubic centimeter, unbleached kraft papers hover near 0.70 grams per cubic centimeter, and heavily filled recycled chipboards often climb past 0.92 grams per cubic centimeter.
The table below outlines measured physical properties and yield calculations for four standard packaging grades conditioned to ISO 187 standards (23°C, 50% relative humidity).
| Substrate Grade | Basis Weight (g/m²) | Caliper (µm) | Bulk (cm³/g) | MD Bending Resistance (mN) | Parent Sheet Yield (sheets/tonne) | Substrate Price ($/tonne) | Raw Cost per 1k Sheets ($) |
|---|---|---|---|---|---|---|---|
| Solid Bleached Board (SBS) | 300 | 375 | 1.25 | 210 | 4,761 | 1,450 | 304.56 |
| Folding Boxboard (FBB / GC1) | 275 | 412 | 1.50 | 215 | 5,194 | 1,380 | 265.69 |
| Coated Recycled Board (CRB / GD2) | 350 | 437 | 1.25 | 208 | 4,081 | 1,120 | 274.44 |
| Coated Unbleached Kraft (CUK) | 260 | 364 | 1.40 | 225 | 5,494 | 1,410 | 256.64 |
Density shifts explain why buying paperboard strictly by weight misleads procurement teams. FBB offers high bulk because of its mechanical pulp core, delivering solid bending resistance at a lower basis weight. Moving from SBS to FBB reduces raw sheet costs by thirteen percent through caliper scaling.
Moving from SBS to CRB actually increases raw sheet costs, even with a twenty-two percent discount on the per-tonne purchase price. Structural equivalence, not nominal pricing, determines actual material spend.
Raw Sheet Yield Vs Tonnage Pricing
Mill invoices bill by weight, but pressrooms run by area. Converting parent sheet dimensions to square meters reveals the actual usable output of a reel. True yield calculations must factor in side trim, gripper margins, and layout efficiency along the machine direction.
For example, a 2.8 meter mill trim running a 700 by 1000 millimeter sheet layout produces a completely different scrap ratio than the same deckle running an 800 by 1200 millimeter format.
- Softwood Kraft Fiber Proportion – Long fibers build flexural strength at lower grammages, keeping sheet yield per metric tonne high.
- Mineral Filler Addition – Calcium carbonate filler improves surface smoothness, but it lowers bending resistance per unit caliper and forces higher grammage.
- Multi-Ply Furnish Stratification – Placing high-modulus virgin pulp in the outer liners maximizes the moment of inertia, improving structural efficiency.
Yield figures mean little without factoring in mill minimum order quantities and trim offage. Changing grade specifications often means switching suppliers, and different machine web widths alter deckle efficiency. A drop in deckle utilization from ninety-eight percent down to ninety-one percent adds an immediate landed cost penalty that easily wipes out small sheet discounts.
Writing ISO 2493 bending resistance minimums directly into purchase orders shifts compliance risk back onto the paper mill.


Crease
High-speed flatbed die-cutters subject board to intense shear forces during scoring. As male creasing rules push the sheet into female matrix channels, internal plies must delaminate in a controlled manner. Virgin fiber plies stretch under tension without breaking.
Recycled plies, with their low tensile energy absorption, tend to crack right along the crease crown ~ spoiling the printed surface and revealing dark fibers beneath.
Cracked score lines ruin finished cartons, and converting speeds depend directly on predictable board flexibility. Switching from FBB to CRB forces operators to adjust matrix channel depth and width to keep outer liners from cracking. Re-tooling dies extends make-ready downtime and generates extra waste, eroding job profit margins.

Mechanical Strain at the Score Line
When outer plies split during folding, it usually points to poor fiber bonding inside the sheet. Tensile strength under ISO 1924-2 measures the maximum force per unit width a board handles before breaking. Repeated repulping shortens and hornifies recycled fibers, lowering internal bond strength measured by TAPPI T 541 Scott Bond testing.
Low Scott Bond values cause messy, uncontrolled ply separation during folding, while values that are too high keep creases from forming cleanly.
Score line cracking forces operators to slow down folder-gluers. A line running at 400 meters per minute on virgin board often drops to 280 meters per minute on recycled stock with poor score ductility. Debris creates another problem: low fiber strength generates micro-dust during blanking, which accumulates on offset blankets and photopolymer plates.
Every plate wash stops the press and eats up billable time.
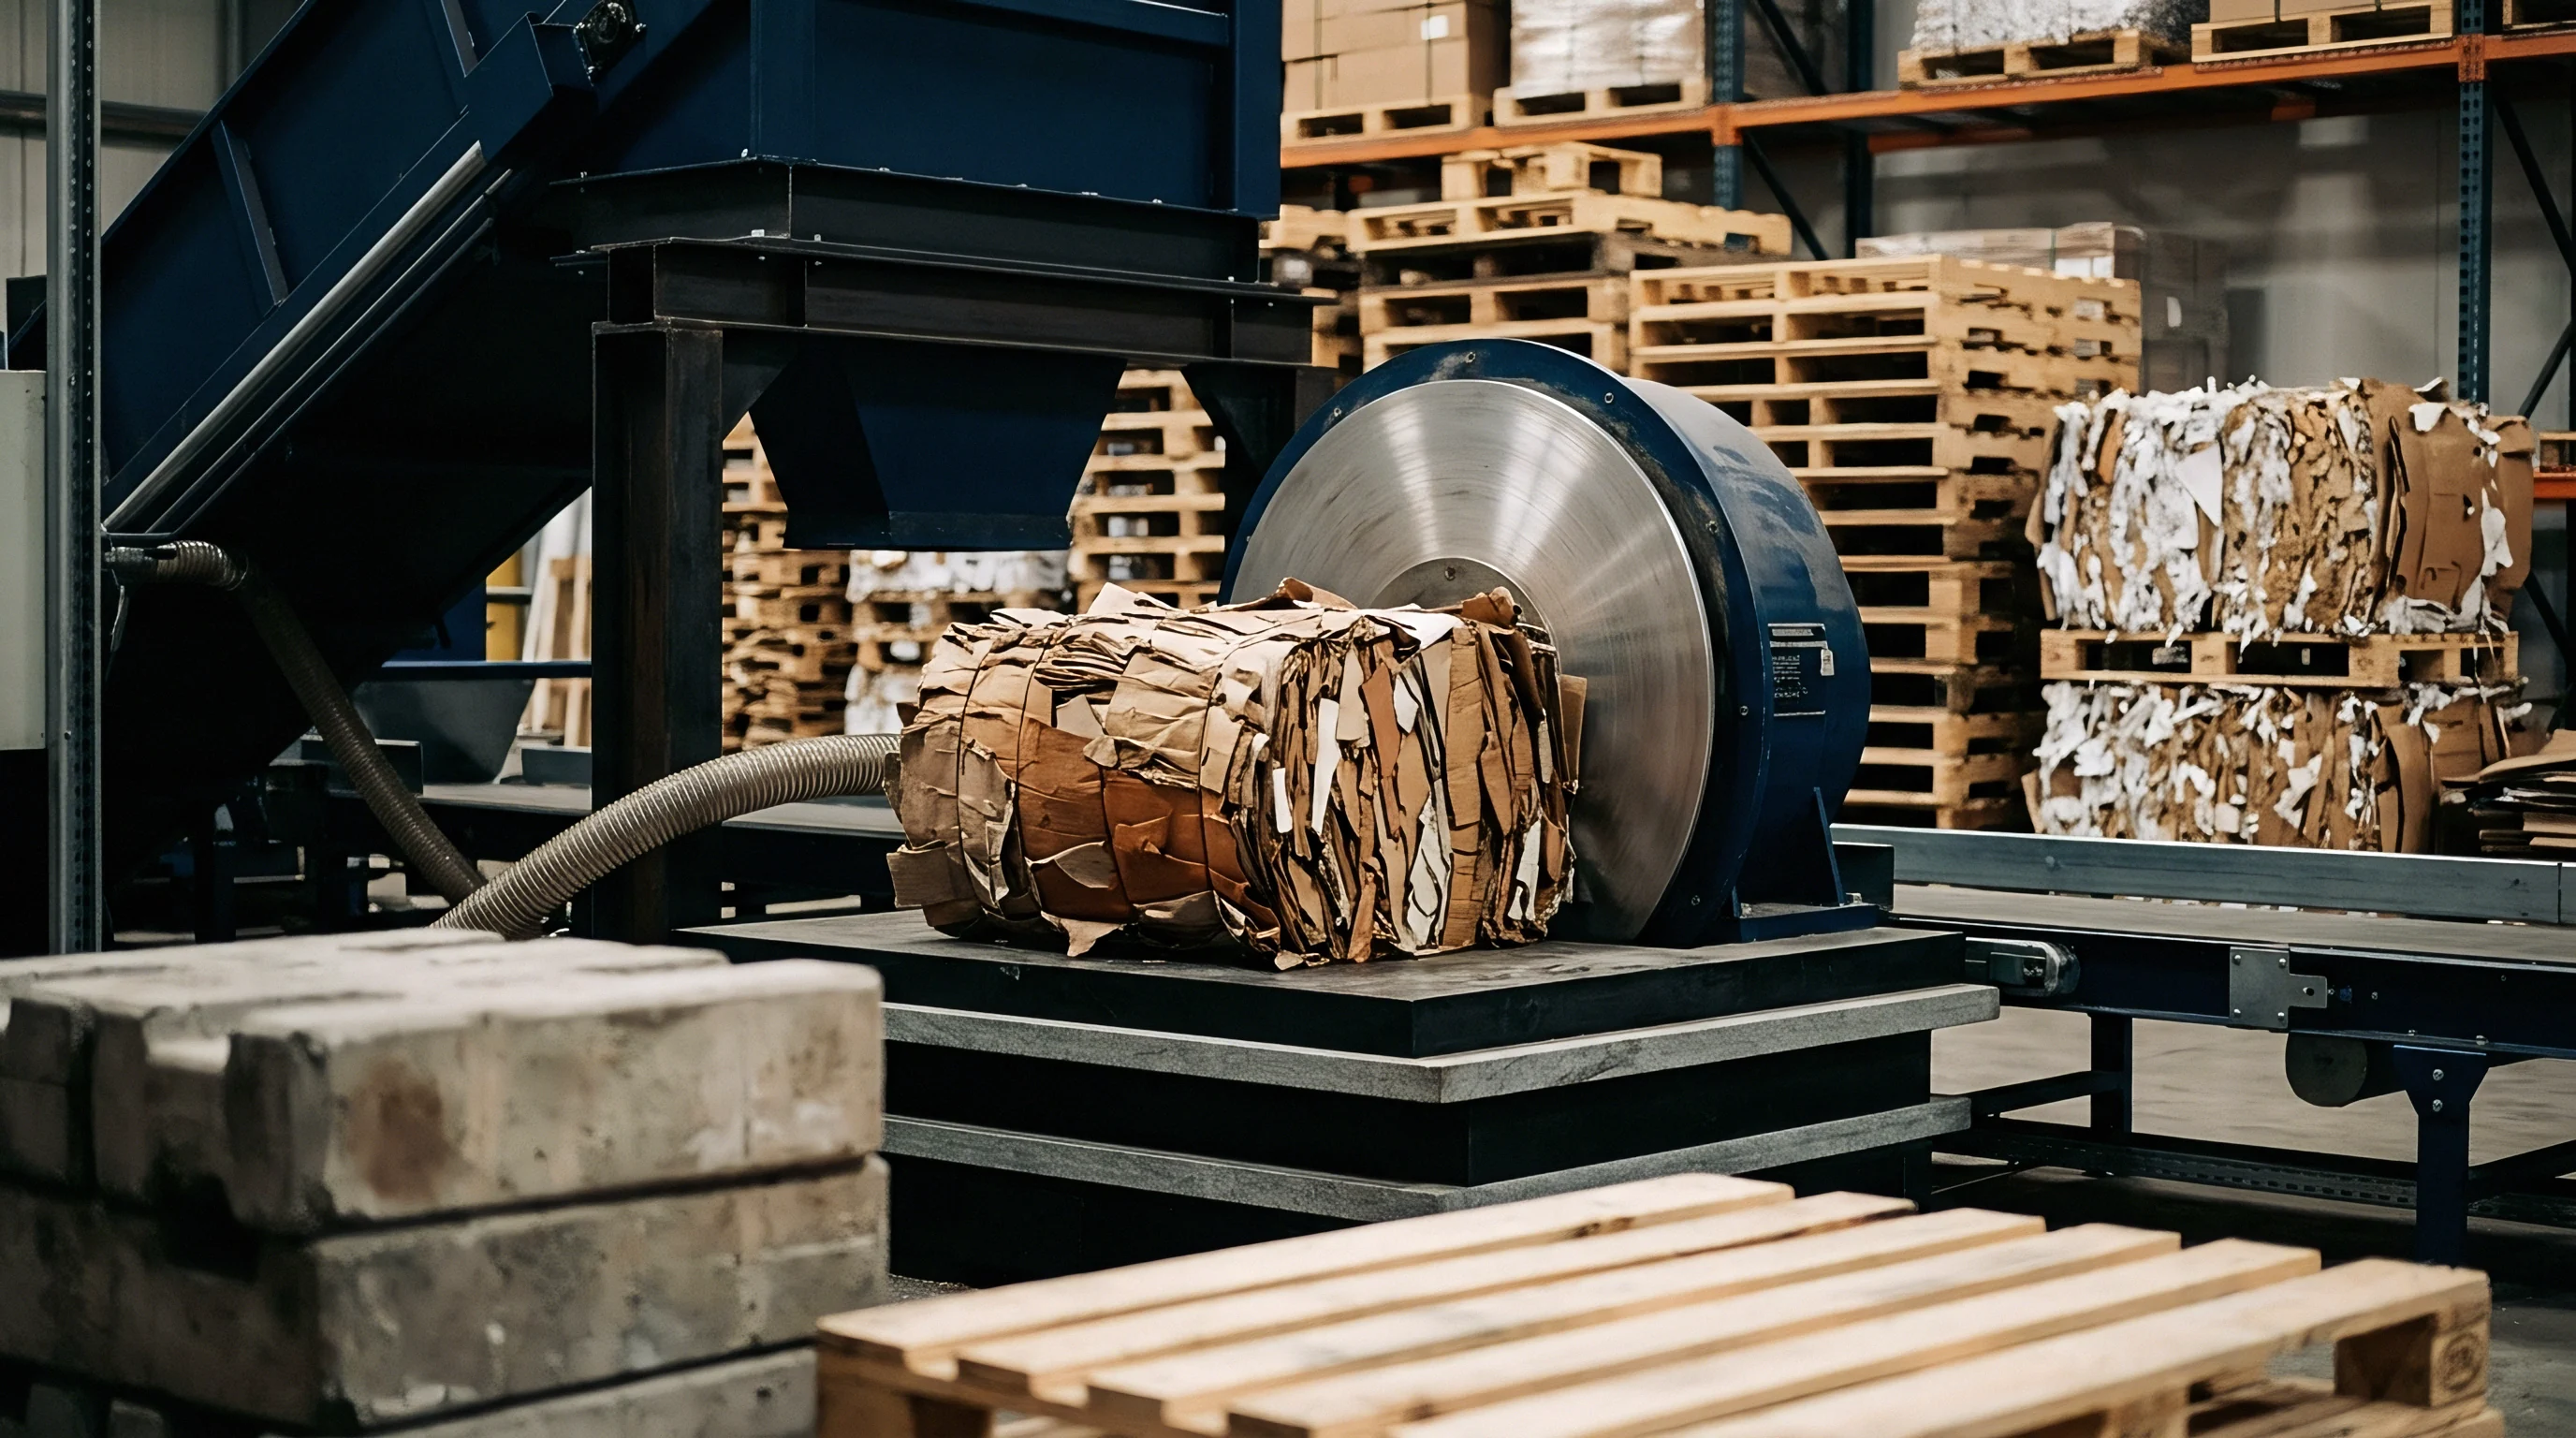
Converting Line Spoilage and Matrix Waste
Jams on automatic folder-gluers spike whenever caliper drifts across a pallet. Thickness variations alter friction as blanks pass through feeder belts. A three percent caliper increase over spec can trigger double feeds, while a three percent drop leads to missed feeds and misregistration at the glue station.
The table below outlines converting performance data collected across production runs using different substrate types.
| Substrate Category | Tensile Energy Absorption (J/m² ISO 1924-2) | Score Cracking Failure Rate (%) | Die-Dust Mass (mg/kg) | Make-Ready Waste (Sheets) | Total Converting Spoilage (%) |
|---|---|---|---|---|---|
| Virgin SBS | 145 | 0.2 | 12 | 250 | 1.8 |
| Virgin FBB (GC1) | 130 | 0.5 | 18 | 300 | 2.1 |
| Recycled Board (GD2) | 85 | 4.2 | 85 | 650 | 5.6 |
| Coated Kraft (CUK) | 180 | 0.1 | 15 | 280 | 1.9 |
Spoilage jumps from roughly two percent to nearly six percent when swapping virgin board for low-grade recycled chipboard. That extra scrap directly raises real material costs. Running 100,000 sheets at a five-point-six percent waste rate burns 5,600 extra sheets, compared to just 1,800 on SBS.
At a base sheet cost of 274 dollars per thousand, the extra scrap represents 1,041 dollars in lost material, on top of wasted press time.
An ISO 535 60-second Cobb absorption value exceeding 45 g/m² on reverse liners causes adhesive bleed-through during carton gluing at 23°C and 50% relative humidity.
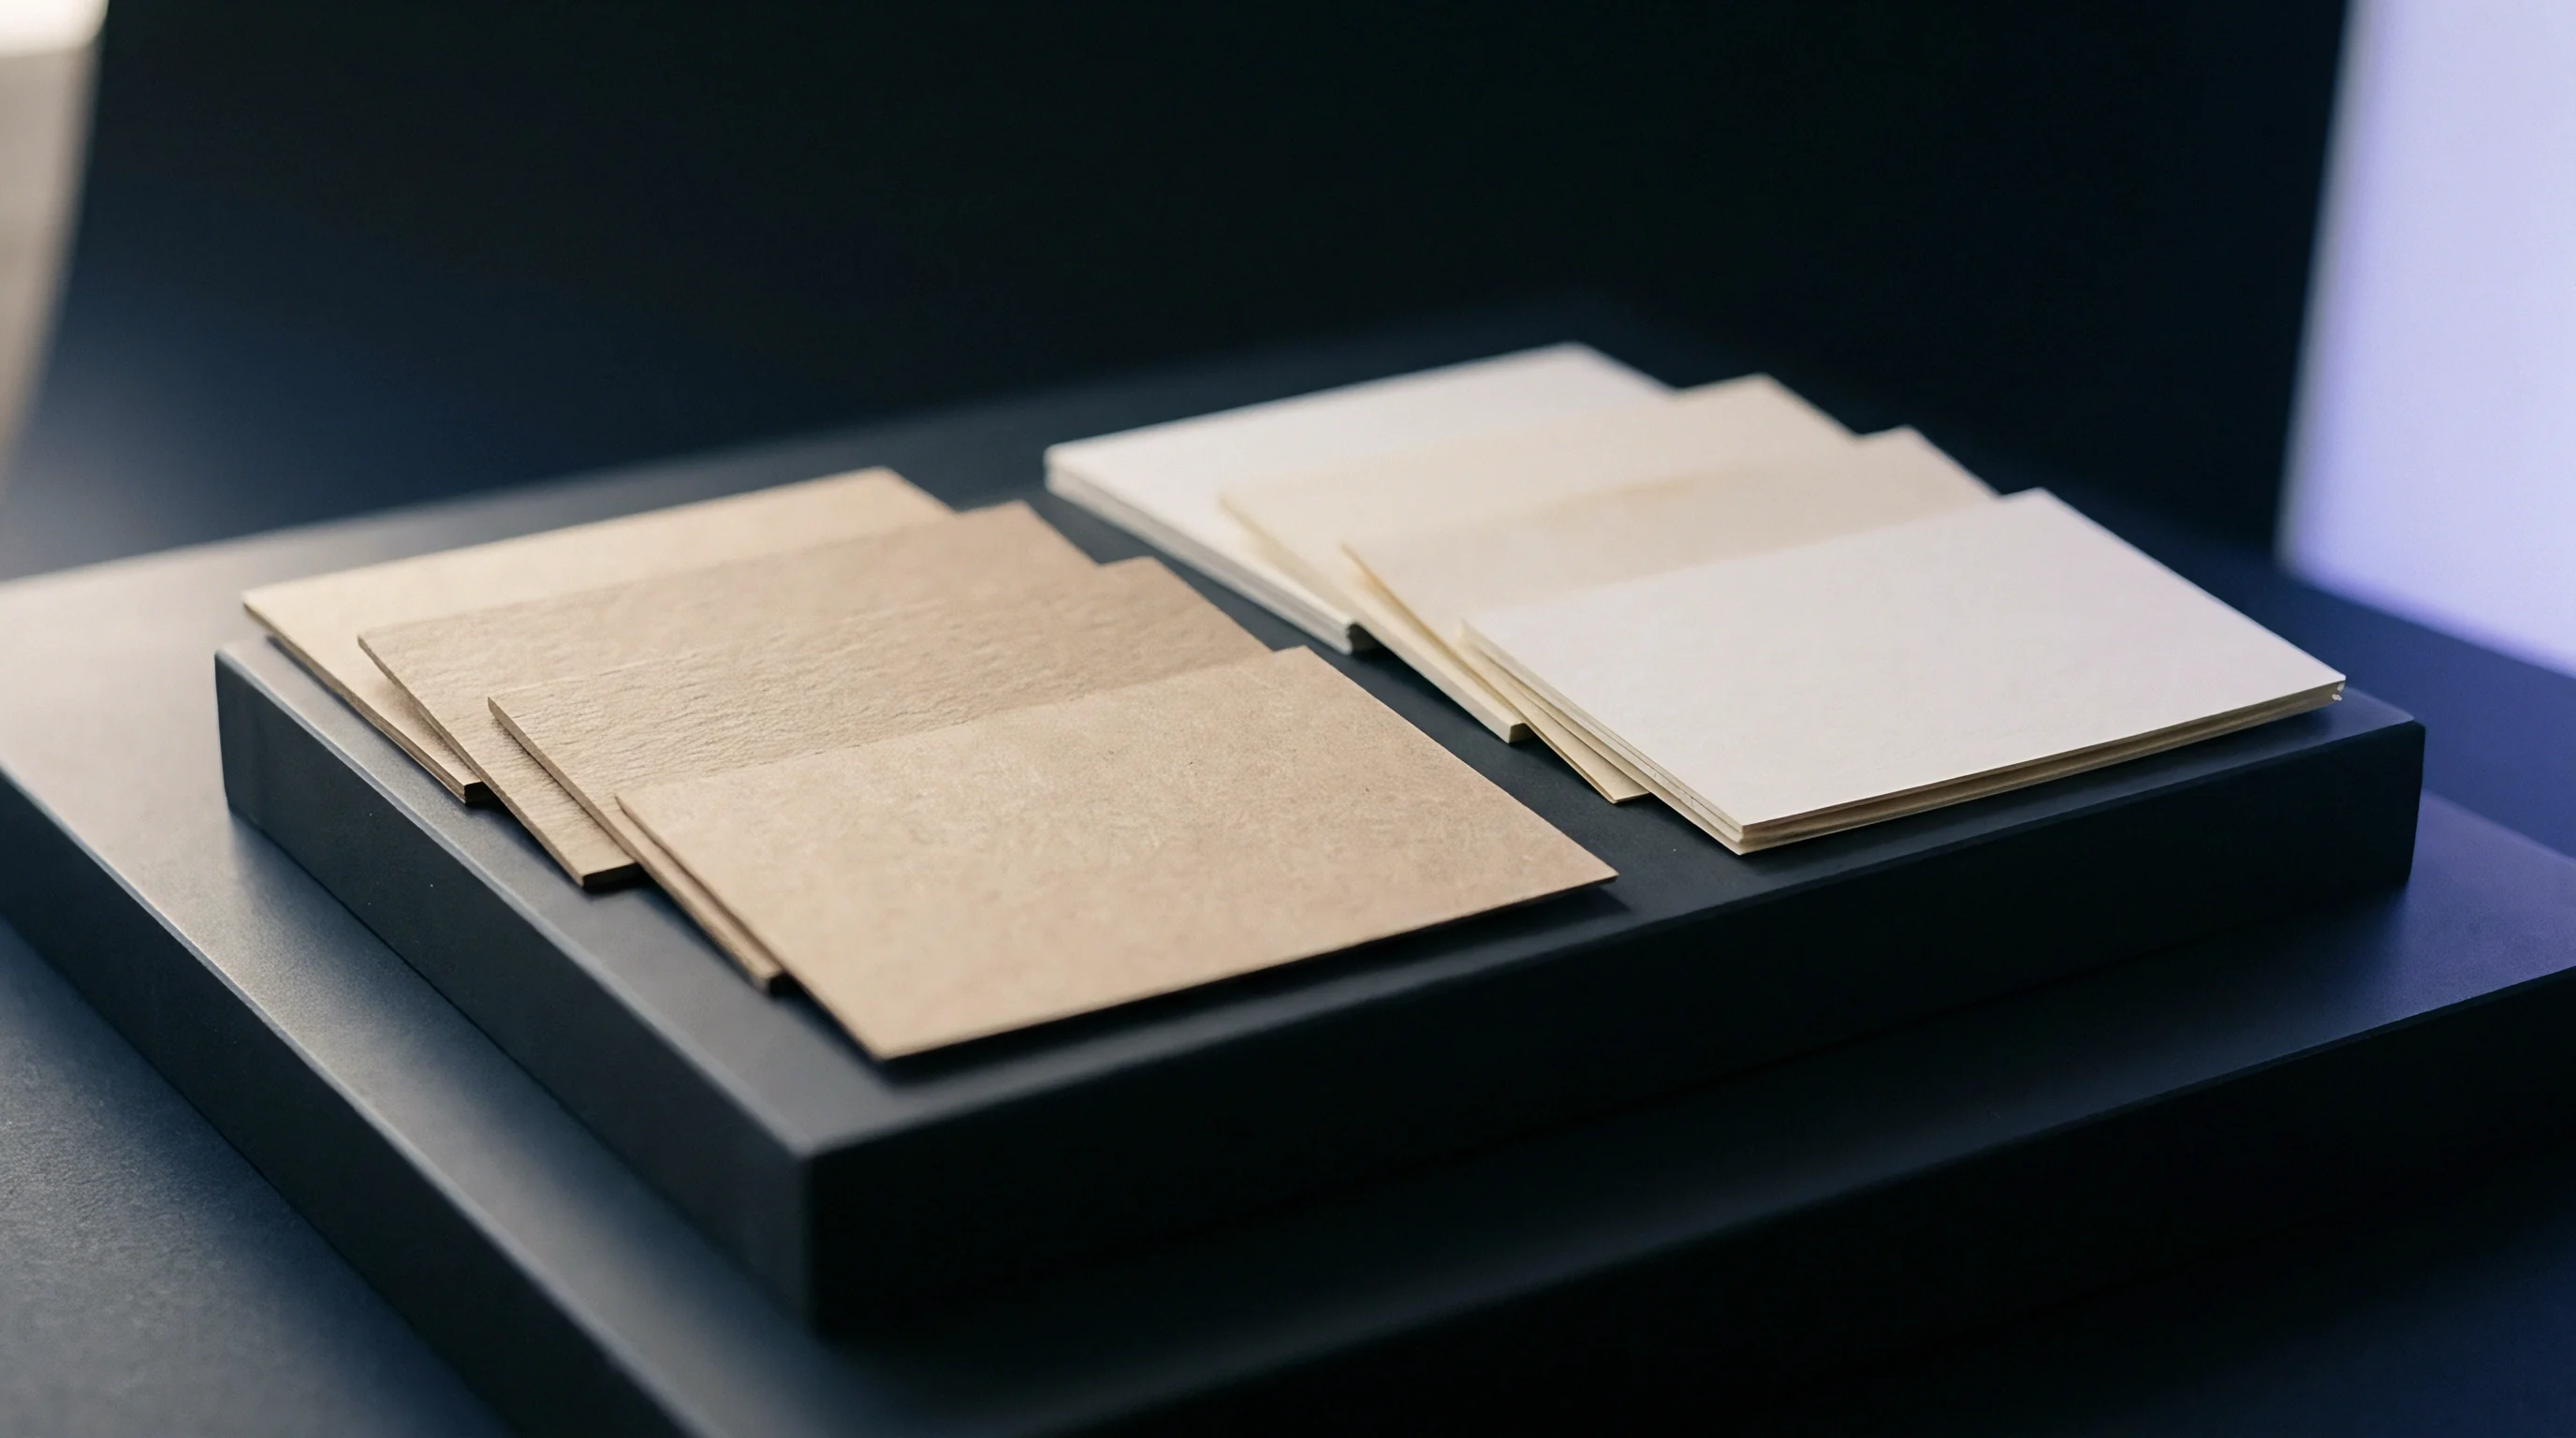
Glue Line Kinetics and Sizing Variance
Setting times for water-based adhesives rely on controlled capillary absorption into the back of the sheet. The ISO 535 Cobb test measures how many grams of water one square meter of surface absorbs over a set period. If reverse sizing is too heavy, Cobb values drop below 20 grams per square meter, preventing cold glues from biting into the fiber matrix.
That leads directly to joint failure during cold storage.
- Pallet Moisture Verification – Check stack humidity with a sword hygrometer before moving stock into pressroom conditioning bays.
- Score Depth Calibration – Adjust female matrix channels to match caliper changes when switching grades.
- Adhesive Penetration Timing – Test drop absorption rates on reverse liners to avoid glue joint pop-opens later on.
Sizing drives glue absorption. Cobb values above 50 grams per square meter draw water in too quickly, causing glue open times to collapse. Cold glue sets before carton flaps hit the compression belt, leaving cartons unsealed.
Tweaking adhesive viscosity and open assembly times takes extra setup labor and hurts productivity on short-run jobs.
While score cracking on recycled board is often attributed to pressroom humidity levels, board fiber degradation remains the primary driver.

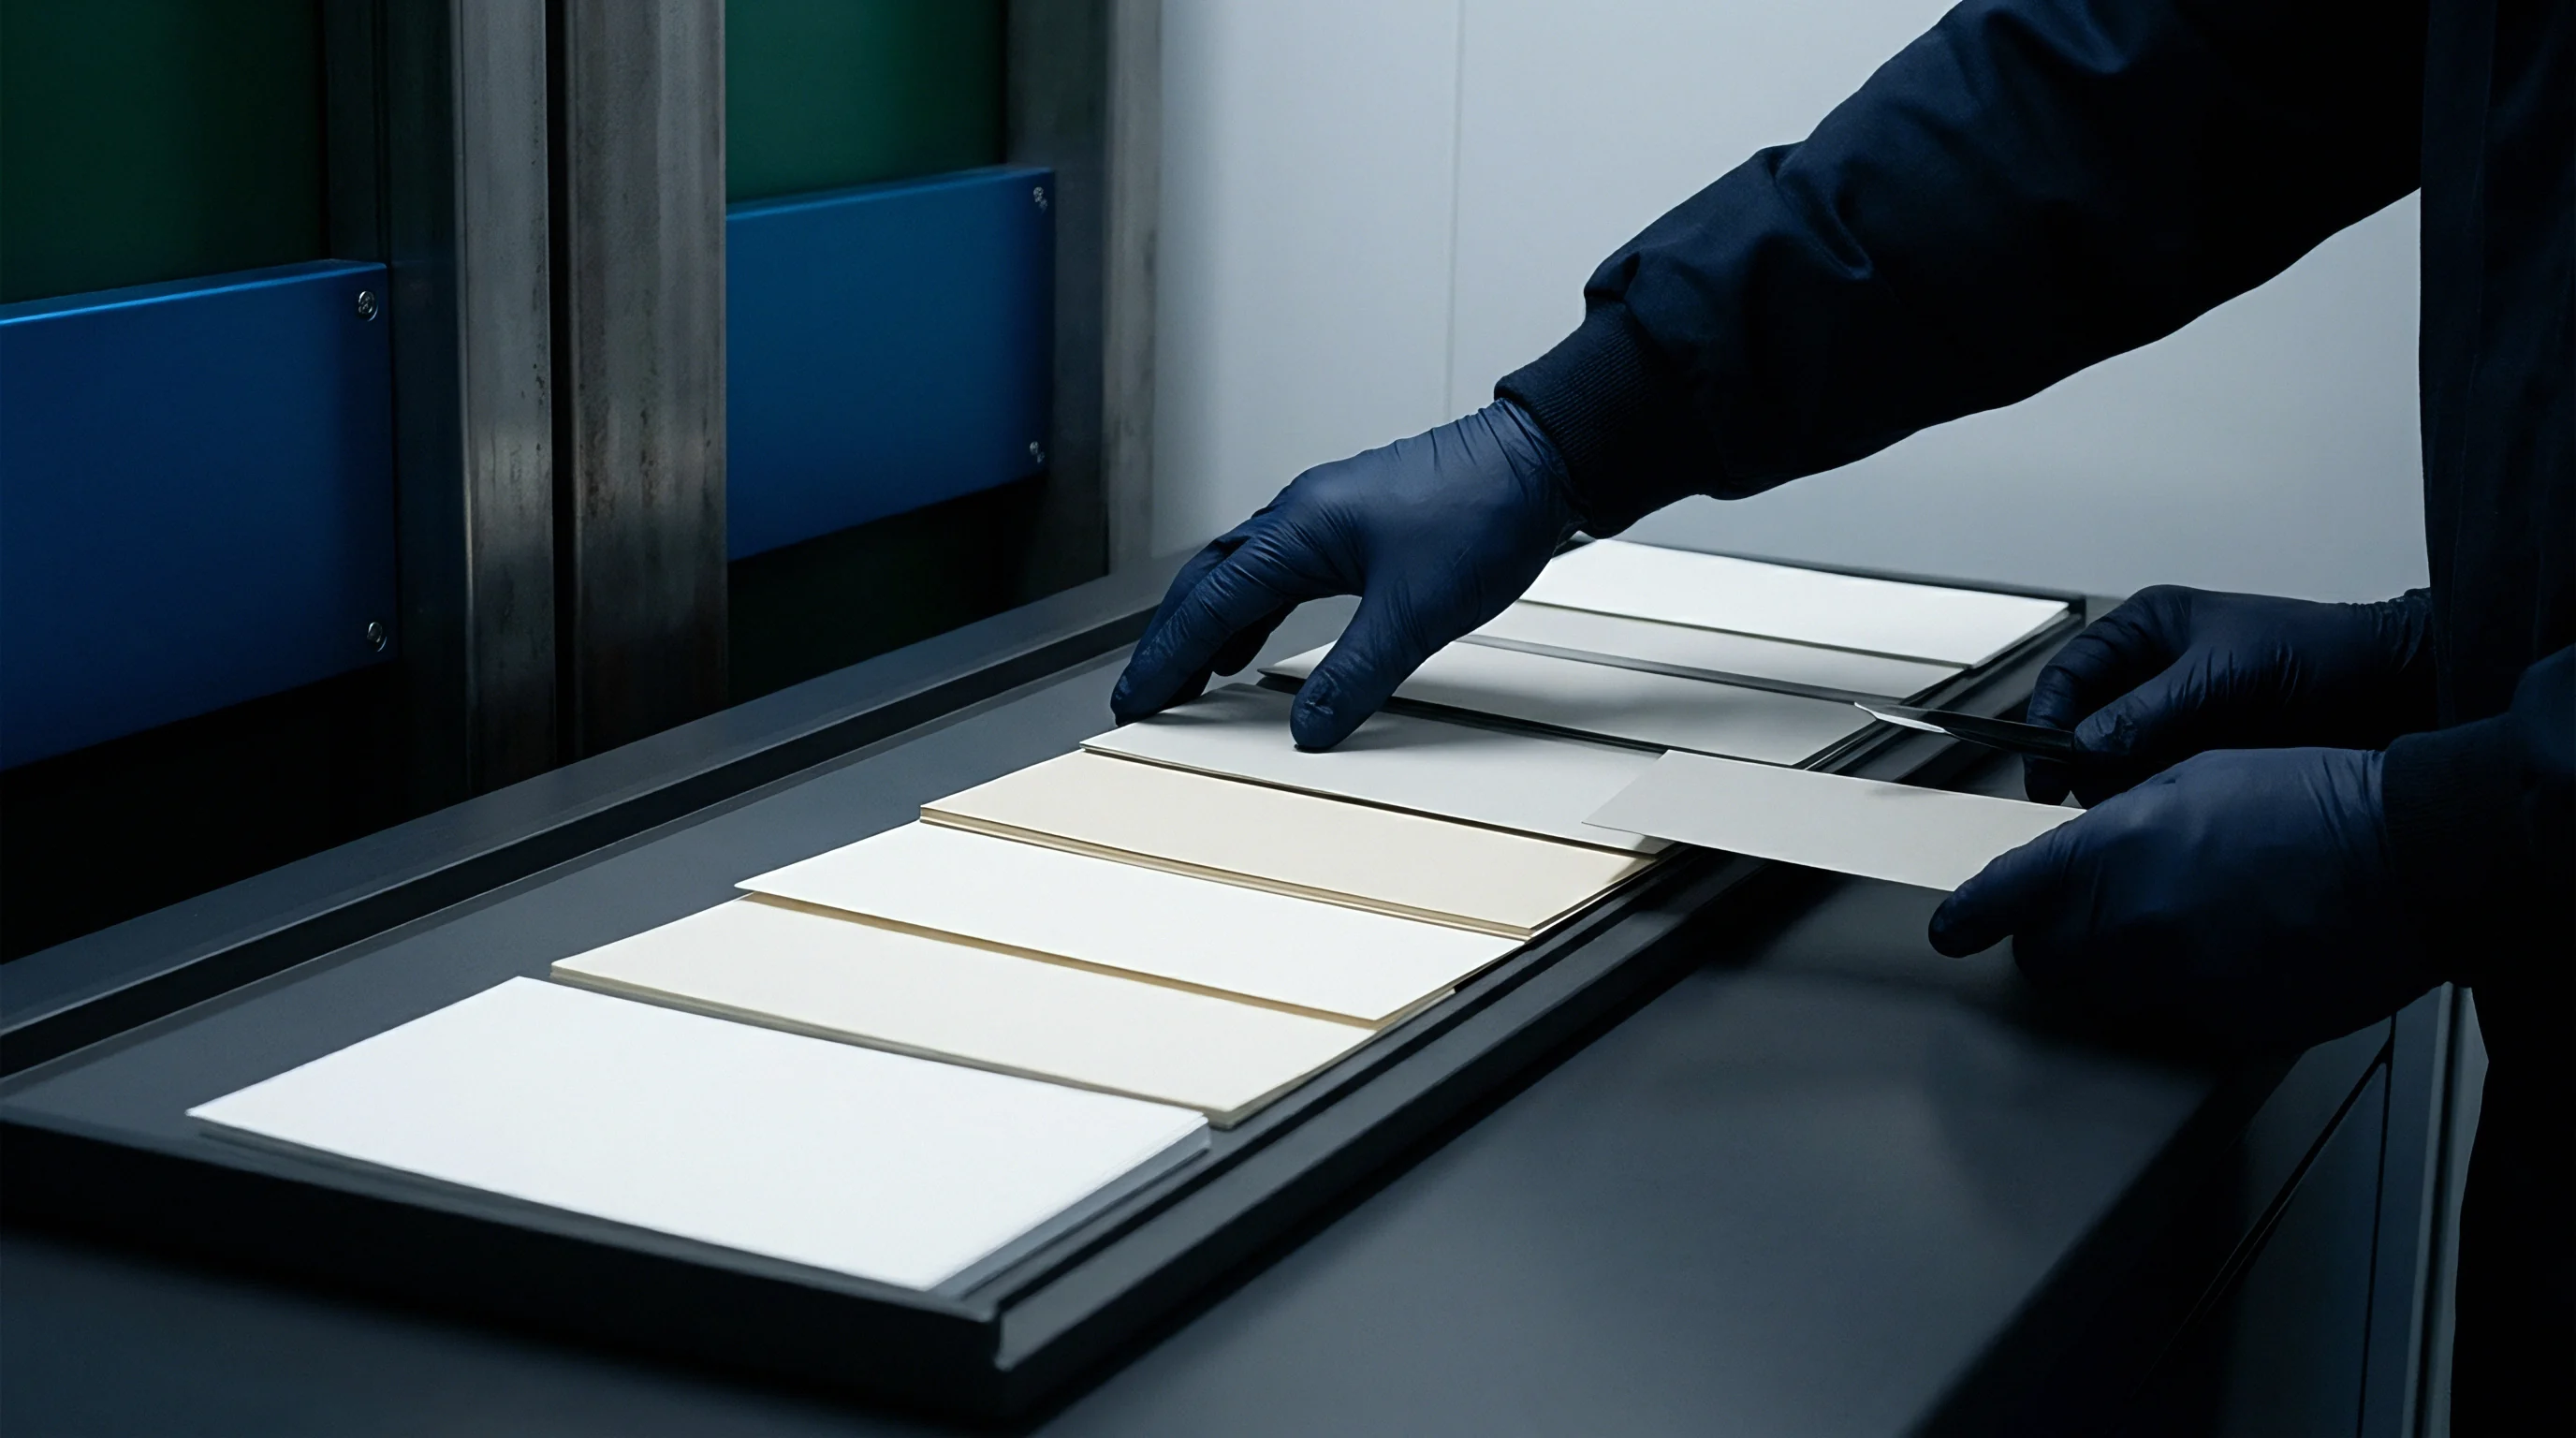
Ink
Whether recovered fibers can return to high-grade packaging streams depends on how cleanly pigments separate during repulping. Flotation cells in modern deinking plants rely on hydrophobic ink particles hitching to air bubbles and floating off as foam. When a substrate swap introduces non-deinkable inks, cross-linked UV varnishes, or stubborn synthetic binders, that detachment breaks down.
Ink stays bound to the fibers or breaks into coarse specks, ruining the pulp slurry.
Under European INGEDE Method 11 standards, paper de-inkability is evaluated through lab pulping, flotation, and optical testing on handsheets. The protocol scores five areas: luminosity, shade, dirt speck area, dirt speck count, and filtrate discoloration. A failure on any single metric drags down the total Deinkability Score, triggering financial penalties under extended producer responsibility schemes.

Hydrophobic Detachment Mechanics
Alkaline pulping baths hydrolyze surface binders, detaching vehicle resins from the fiber. Standard sheetfed offset inks use vegetable oils and alkyd resins that saponify under alkaline conditions (pH 9.5 to 10.5 at 45°C), forming hydrophobic soaps. These soaps clump ink pigments into an ideal 10 to 100 micrometer size range for air bubbles to catch during flotation.
Swapping standard offset printing for UV-curable or electron-beam inks changes this mechanism entirely. UV inks undergo free-radical polymerization when cured, building dense, cross-linked acrylic polymer networks. During pulping, these networks do not hydrolyze into micron-sized particles; instead, they break into large, flexible flakes ranging from 200 to 1000 micrometers across.
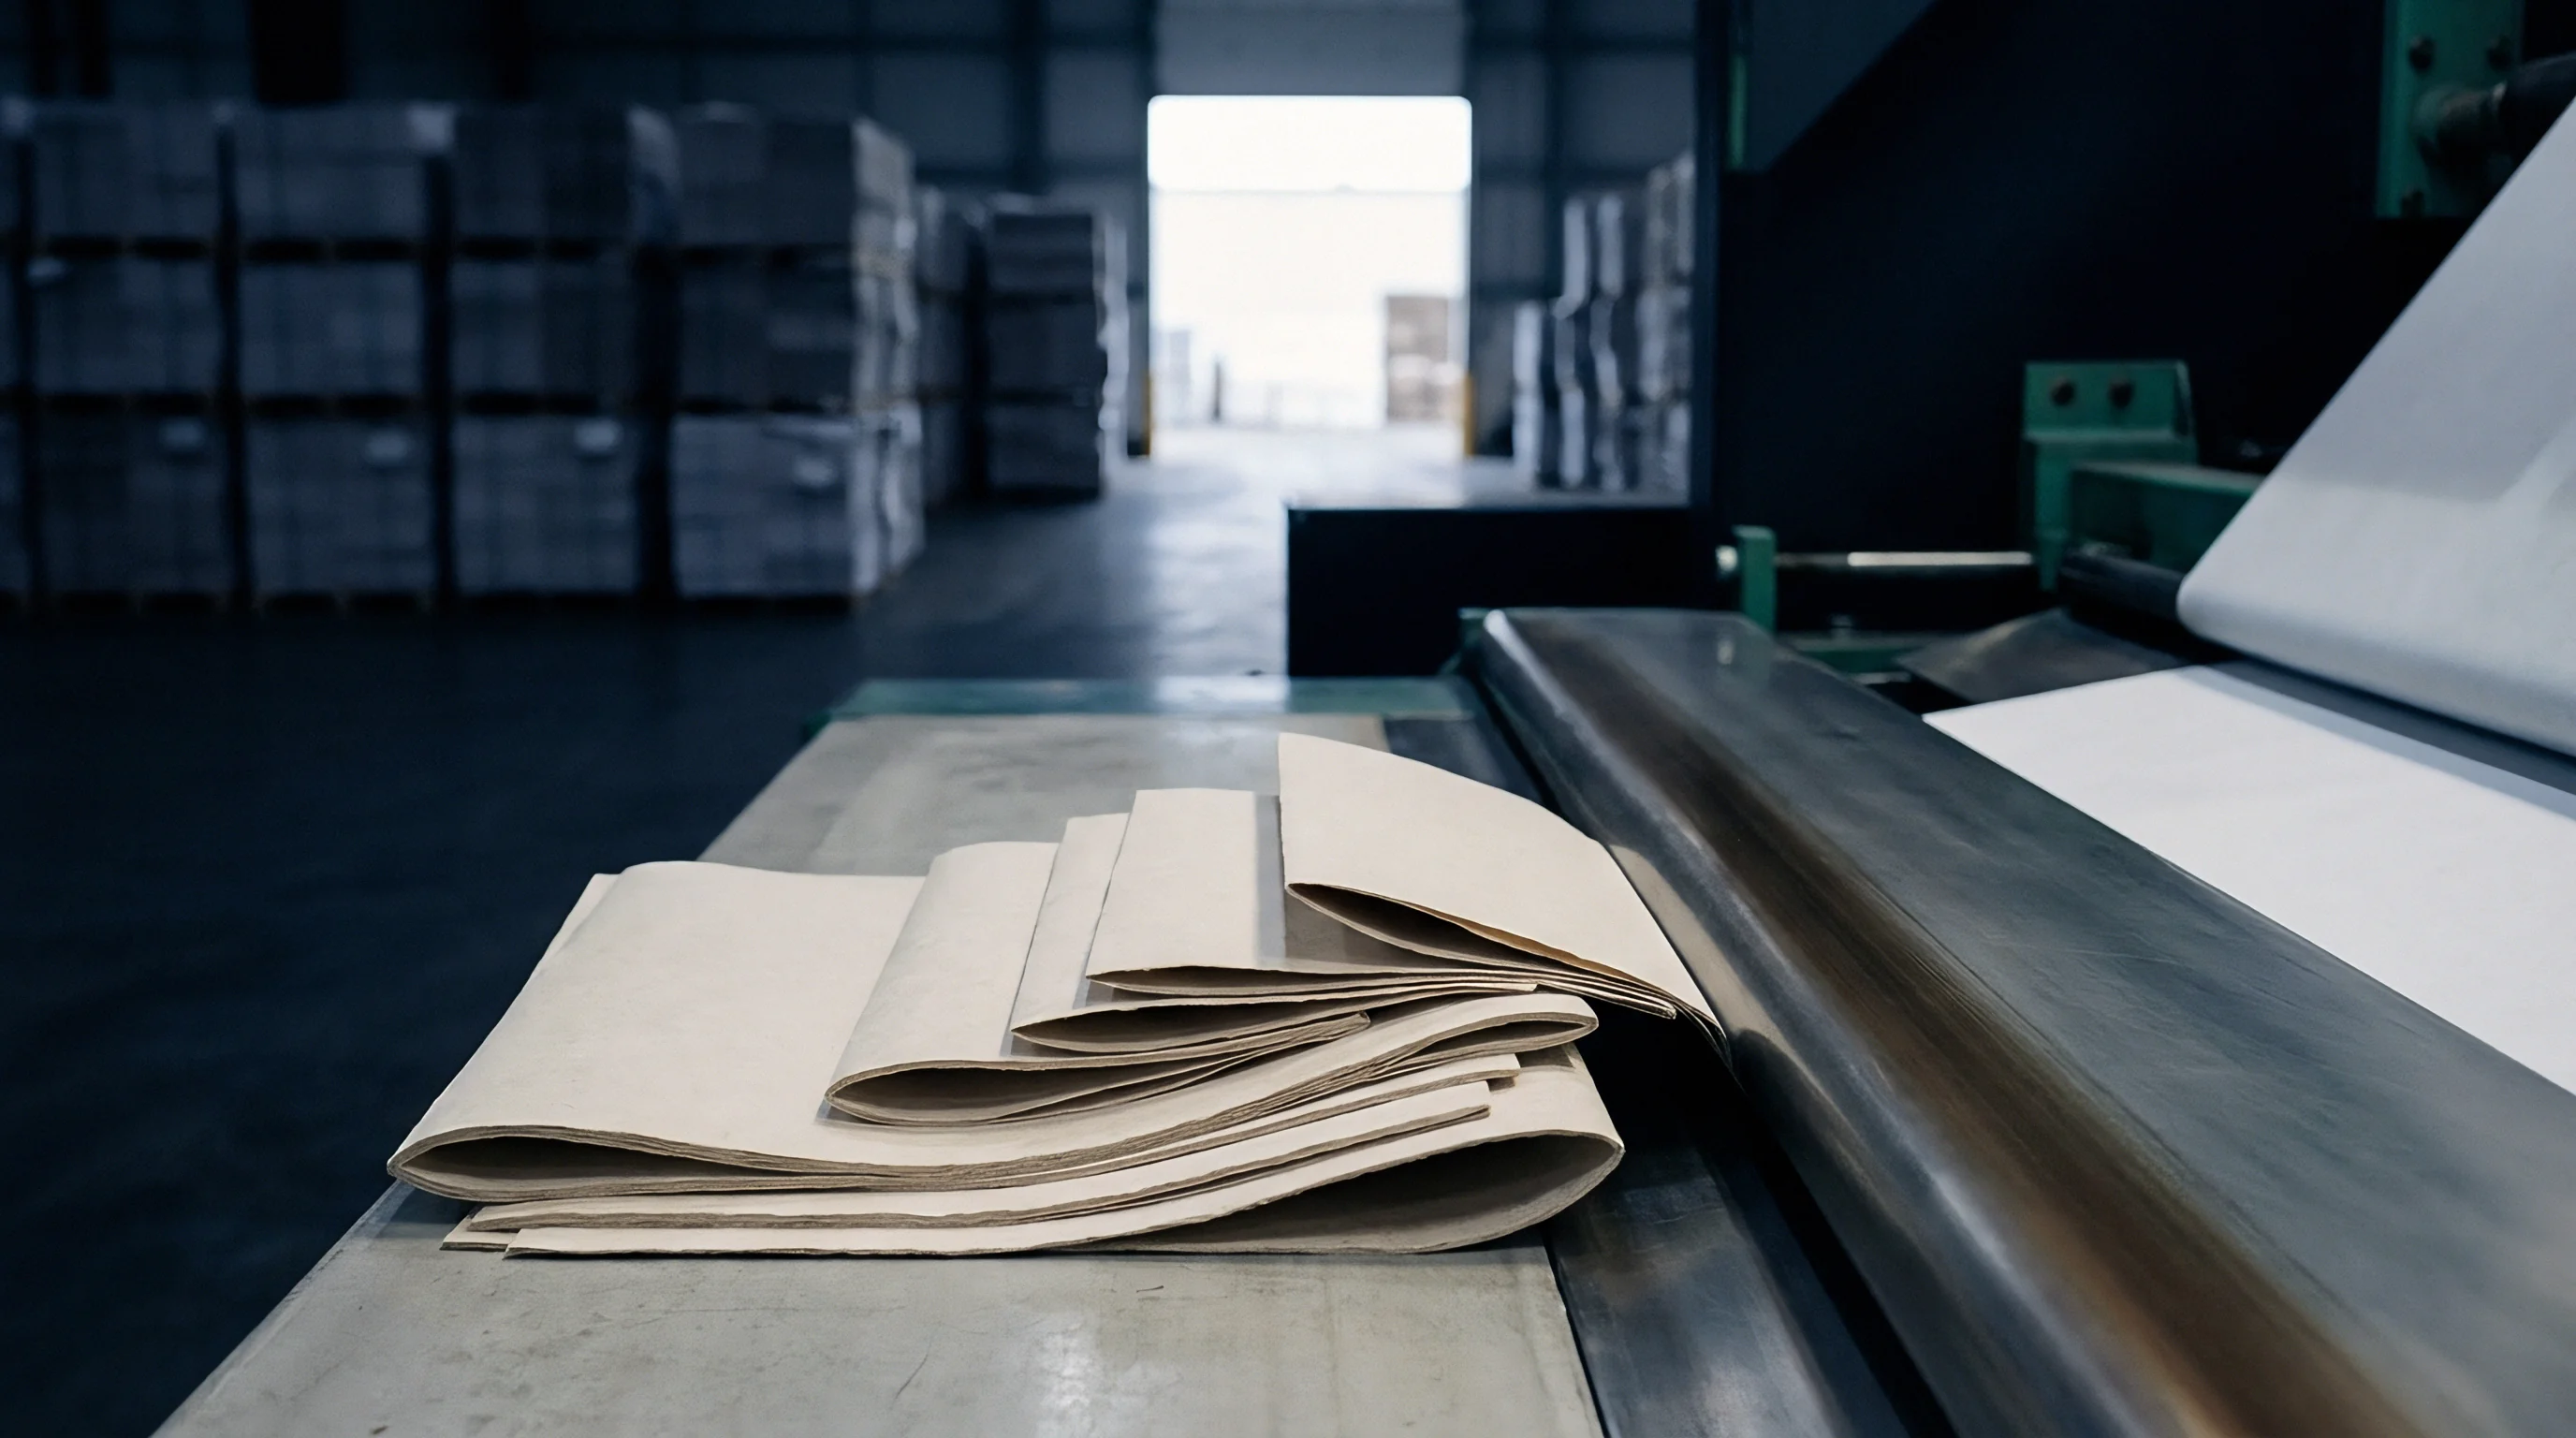
Is Flotation De-Inkability Degrading Eco-Modulation Compliance?
Cross-linked synthetic resins trap carbon black in the pulp slurry. Large UV ink flakes are simply too heavy for rising air bubbles to lift during flotation, so they settle back into the stock as dark specks in the finished board. On the other end, liquid electrophotography (LEP) digital inks break into sub-micron particles under 5 micrometers, which remain suspended in the wash water and stain the filtrate.
Testing substrates in controlled lab environments isolates fiber performance from room humidity. When a brand owner switches from standard GC1 board with conventional offset inks to a high-gloss UV-coated board printed with water-based flexo inks, the Deinkability Score drops sharply. Water-based flexo resins dissolve in alkaline pulping liquor, releasing ultra-fine carbon black and organic pigments that permanently stain the fibers and destroy optical brightness.
Heavy ink coverage combined with polymeric lacquers prevents air bubbles from attaching to pigment particles during flotation separation.

Optical Brightening and Dirt Speck Analysis
Automated image systems scan repulped handsheets for residual dark specks down to fifty micrometers. Under ISO 2470, diffuse blue reflectance (ISO brightness) measures optical whiteness under standard lighting. Finely dispersed ink residue can drop ISO brightness from a target eighty-two percent down to seventy-four percent, making the recycled pulp unusable for graphic or food-contact board.
Dirt count analysis under INGEDE Method 11 imposes strict limits on equivalent black area (EBA) per square meter. The table below outlines the scoring matrix used to evaluate fiber compatibility.
| Evaluation Parameter | Test Method / Target Unit | Target Range (100 Points) | Threshold Range (50 Points) | Failure Level (0 Points) |
|---|---|---|---|---|
| Luminosity (Y Value) | ISO 2469 (%) | > 62.0 | 55.0 to 62.0 | < 55.0 |
| Color Shade (a Value) | ISO 5631-1 (CIELAB) | -1.0 to +1.0 | -2.0 to +2.0 | < -2.0 or > +2.0 |
| Dirt Speck Area (>50 µm) | ISO 15755 (mm²/m²) | < 400 | 400 to 1200 | > 1200 |
| Dirt Speck Count (>50 µm) | Automated Image Analysis (count/m²) | < 1500 | 1500 to 4500 | > 4500 |
| Filtrate Discoloration (Y) | Photometric Filter (%) | > 50.0 | 40.0 to 50.0 | < 40.0 |
A total Deinkability Score above 80 points earns a Pass rating, qualifying the package for top-tier eco-modulation rebates. Scores from 50 to 79 land in an intermediate tier, while anything below 50 ~ or a dirt speck area over 1200 square millimeters per square meter ~ classifies the package as non-deinkable. That classification triggers maximum regulatory surcharges across European Union markets.
Varnish Cross-Linking and Flotation Interference
UV-cured overprint lacquers break into continuous polymer sheets during repulping. Water-based dispersion coatings, on the other hand, use styrene-acrylic copolymers that shear apart cleanly at normal pulping temperatures. Replacing a water-based coating with a high-gloss UV varnish to improve rub resistance can push a package from fully compliant straight into failure.
UV inks resist standard repulping. Polymerized lacquer sheets wrap around fibers, blocking chemical access to underlying ink. These combined ink-and-film fragments end up neutrally buoyant, so flotation skimming misses them.
They pass right through primary screens and show up as dark specks in the finished board web.
Finding bio-based coatings that provide moisture resistance without ruining flotation deinking remains an ongoing challenge for the industry.


Levy
Extended Producer Responsibility (EPR) regulations penalize packaging designs that disrupt recycling infrastructure. Frameworks across France, Germany, the UK, and the broader EU Packaging and Packaging Waste Regulation adjust producer fees according to recyclability. Packs designed for clean fiber recovery pay baseline fees, while those using non-deinkable inks, plastic laminates, or stubborn barrier coatings trigger heavy surcharges.
Those penalties quickly erase savings at the mill. Sourcing decisions based solely on substrate cost per tonne often trigger eco-modulation fees that far exceed any initial material savings. Switching from virgin FBB with conventional inks to a cheaper recycled board printed with non-deinkable UV inks can push a package out of a discounted fee tier and directly into a penalty rate.

Eco-Modulation Tiers and Compliance Thresholds
Regulatory frameworks classify packaging into performance tiers based on repulpability. Under French Citeo guidelines and Germany’s Duales System Deutschland regulations, paperboard packaging undergoes detailed recycling audits. Packs scoring Class A or B under CEEPR guidelines pay baseline EPR fees.
If ink or varnish choices cause a de-inkability failure, the pack falls to Class D or E, bumping fees up by as much as one hundred percent.
EPR recyclability surcharges scale directly with the total tonnage placed on the market.
Under the EU Packaging and Packaging Waste Regulation (PPWR), mandatory recyclability grading rules are coming into force. Packaging with less than seventy percent recyclability by mass faces a full market ban by 2030, while packs between seventy and eighty percent face escalating penalty tariffs. Non-deinkable substrate and ink combinations fall into lower tiers because of heavy fiber losses during industrial pulping.

Financial Exposure in Substrate Grade Swaps
Procurement teams calculating substrate savings often overlook end-of-life eco-modulation fees. Factoring these fee structures into early material qualification protects real landed unit costs. For a brand placing 5,000 metric tonnes of printed board on the European market, de-inkability compliance alone can swing regulatory costs dramatically.
The matrix below outlines base EPR fees and penalty surcharges across major European regulatory systems.
| Jurisdiction / Scheme | Packaging Recyclability Tier | Base EPR Levy (€/tonne) | De-Inkability Penalty (€/tonne) | Barrier Surcharge (€/tonne) | Total Levy Exposure (€/tonne) |
|---|---|---|---|---|---|
| France (Citeo) | High Performance (Class A) | 160 | 0 | 0 | 160 |
| France (Citeo) | Non-Deinkable (Class D) | 160 | 160 | 0 | 320 |
| Germany (DSD) | Standard Recyclable | 145 | 0 | 0 | 145 |
| Germany (DSD) | Distorted Recycling Stream | 145 | 110 | 75 | 330 |
| UK EPR (Proposed Tier 1) | Fully Recyclable Stream | 220 | 0 | 0 | 220 |
| UK EPR (Proposed Tier 3) | Hard-to-Recycle / Non-Deinkable | 220 | 180 | 120 | 520 |
Looking at these fee matrices reveals the real risk of unverified substrate swaps. Saving eighty euros per tonne on paperboard turns into an eighty euro per tonne net loss if an ink or coating triggers a one-hundred-and-sixty euro Citeo de-inkability surcharge. Landed cost models have to track regulatory levies alongside raw material prices and converting scrap.
- Non-Deinkable Ink Surcharges – Formulations using cross-linked UV binders hit top-tier penalties under European EPR systems.
- Polyethylene Barrier Penalties – Laminated film layers over five percent of total pack mass lose recyclable status, drawing extra plastic levies.
- Mineral Oil Residue Penalties – Recycled board that introduces unrefined mineral oil hydrocarbons into food-contact applications faces steep regulatory fines.
The true cost of placing packaging on the market includes end-of-life liabilities. Swapping virgin FBB for an uncertified recycled alternative creates immediate financial exposure. If testing turns up high dirt counts or dark specks in repulped handsheets, regulatory bodies reclassify the stream and backdate surcharges across past volume filings.
An unverified solvent ink system caused an entire packaging run to fail INGEDE Method 11 testing, incurring thirty-two thousand euros in unbudgeted surcharges.

Balance
Calculating true landed cost requires connecting mill prices with converting performance and regulatory fees. Looking only at the invoice price per tonne distorts the real budget picture. Total landed cost variance combines raw material pricing, basis weight differences, converting line scrap, freight adjustments, and end-of-life EPR fees.
Because material yield dictates final unit expense, an economic model must translate raw material metrics into net cost per thousand delivered cartons. When evaluating a grade swap, engineers need to model all five cost vectors together to see the true commercial outcome.

Master Landed Cost Variance Equations
Unit economic analysis connects bulk material costs to the price of finished packs. Net Landed Cost per thousand finished packs follows a simple calculation combining material yield, pressroom scrap, freight variations, and regulatory fees. The core relationship runs as follows:
Net Cost per 1k Packs = Effective Material Cost + Freight Cost + EPR Eco-Modulation Surcharge per 1k Packs
Tracking landed variance across every substrate swap protects profit margins. Evaluating a proposed change means calculating raw sheet consumption based on target bending stiffness, adding expected converting scrap, factoring in transport density, and applying eco-modulation fees based on INGEDE Method 11 test scores.

Sensitivity Audit of Packaging Grade Swaps
Modeling trade-offs isolates the variables that drive actual financial exposure. Consider a baseline run of 100,000 folding cartons produced from virgin FBB (GC1) with standard offset inks, evaluated against a proposed alternative using recycled chipboard (GD2) with high-gloss UV ink.
- Calculate target sheet yield from basis weight and parent sheet dimensions.
- Adjust converting line scrap assumptions based on score cracking and matrix runnability.
- Compute freight charges using density and volume scaling factors.
- Add certified EPR eco-modulation surcharges based on de-inkability test results.
Unbudgeted score cracking scrap caused a seven percent unit cost jump across three consecutive converter runs. The sensitivity analysis below models the baseline virgin FBB job against the proposed recycled chipboard alternative, tracking every step in the landed cost chain.
| Cost Component / Parameter | Baseline: Virgin FBB (GC1) + Standard Ink | Proposed Swap: Recycled (GD2) + UV Ink | Net Commercial Variance (%) |
|---|---|---|---|
| Substrate Price ($/tonne) | 1,380.00 | 1,120.00 | -18.84% |
| Basis Weight for Equal Stiffness (g/m²) | 275 | 350 | +27.27% |
| Raw Material Cost per 1,000 Sheets ($) | 265.69 | 274.44 | +3.29% |
| Converting Spoilage Rate (%) | 2.10% | 5.60% | +166.67% |
| Effective Material Cost per 1k Packs ($) | 271.39 | 290.72 | +7.12% |
| Freight Cost per 1k Packs ($) | 14.50 | 18.45 | +27.24% |
| INGEDE 11 De-Inkability Score | 92 (Pass / Bonus) | 38 (Fail / Penalty) | De-inkability Failure |
| EPR Eco-Modulation Levy ($/1k Packs) | 12.50 | 35.80 | +186.40% |
| Net Landed Cost per 1,000 Packs ($) | 298.39 | 344.97 | +15.61% |
The audit shows that swapping virgin FBB for recycled board printed with UV ink causes a fifteen-point-six percent increase in net landed cost per thousand cartons ~ despite an eighteen-point-eight percent drop in per-tonne purchase price. Higher basis weight needed for equivalent stiffness pushes up base sheet cost. Extra converting scrap and heavier transport weights add further expense, while severe EPR penalties from de-inkability failure lock in a net loss.
Incorporating total pressroom waste metrics into unit landed cost calculations grounds sourcing decisions during business reviews. Packaging procurement has to treat material selection, print chemistry, converting performance, and regulatory compliance as one interconnected commercial system.
Evaluating material swaps on raw tonnage price alone simply pushes expenses downstream into converting waste and regulatory fines.