Process Capability Analysis for Barrier Film Lamination in Flexible Packaging
Process capability analysis for barrier laminates requires transforming non-normal permeation data before calculating Cpk to prevent latent containment failures.
Tolerance
Flexible barrier packaging operations rely on precise numerical boundaries to separate conforming roll stock from scrap. Quantitative capability metrics convert raw sensor readings and laboratory destruction tests into actionable statistical indices. Defining upper and lower specification limits for lamination parameters requires establishing exact physical boundaries for mechanical bond strength, gas permeation rates, and residual volatile compounds.
Peel strength measurement under ASTM F904 establishes the force required to separate laminated plies per unit width. A primary flexible laminate specification fixes the lower specification limit for bond strength at 2.5 Newtons per 15 millimeters for structural integrity during pouch forming and thermal processing. Dropping below this threshold creates high risks of delamination along sealing lines during retort or hot-fill execution.
Oxygen transmission rate parameters, measured under ASTM D3985 at 23 degrees Celsius and 0 percent relative humidity, enforce an upper specification limit of 1.0 cubic centimeter per square meter per 24-hour period for high-barrier food packaging. Water vapor transmission rate values, governed by ASTM F1884 or ASTM F1249 at 38 degrees Celsius and 90 percent relative humidity, frequently carry an upper specification limit of 0.5 grams per square meter per day.
Specification Setting Protocols
Setting process boundaries demands aligning converting line physics with packaging machine performance. Operating targets set too close to functional failure limits produce frequent field claims, while overly tight boundaries force unnecessary process downtime and material rejection.
Adhesive coat weight forms the operational pivot for laminate performance. Dry coat weight targets typically range between 1.8 and 4.5 grams per square meter depending on whether the process uses solvent-based, solventless, or waterborne polyurethane systems. Deviations in dry coat weight direct impact both barrier continuity and bond strength.
A dry deposit falling below 1.5 grams per square meter yields incomplete film coverage, producing microscopic voids that compromise oxygen isolation. Deposits exceeding 4.0 grams per square meter on thin films cause solvent entrapment, elevated residual solvent figures, and adhesive migration.
The lower specification limit for structural bond strength sits at 2.5 Newtons per 15 millimeters under ASTM F904 conditioning.
Residual solvent concentration measured by static headspace gas chromatography under EN 13628 carries a strict upper specification limit of 5.0 milligrams per square meter total volatiles, with individual retains for hazardous species like ethyl acetate capped below specific sensory thresholds. Process capability calculations evaluate whether the adhesive applicator, drying tunnel, and web handling equipment consistently hit these target distributions without crossing specification limits.
Process capability analysis quantifies the relationship between the natural variability of the converting machinery and the engineering specifications. Calculate short-term capability using process standard deviation derived from within-subgroup variation:
Cp = (USL – LSL) / (6 sigma_within)
Calculate process capability index adjusting for centering off-target:
Cpk = min((USL – mean) / (3 sigma_within), (mean – LSL) / (3 sigma_within))
Process capability evaluations on barrier lamination lines face physical distribution constraints. Permeation values and residual solvent levels cannot drop below zero, creating natural boundary limits that skew sample distributions away from standard Gaussian curves. Traditional statistical capability equations assume normal distribution curves.
Applying standard capability formulas directly to positively skewed gas permeation data overstates process capability, masking true defect risks at the upper specification limit.
How much process capability margin remains hidden when converting lines run non-normally distributed barrier metrics through standard Gaussian equations without non-linear data transformations?


Substrate
Laminate performance depends on the chemical and physical compatibility of adjacent film webs. Primary flexible packaging structures combine primary structural films, inorganic barrier deposits, coextruded sealant layers, and cross-linking adhesive systems. Variations in base film surface energy, film gauge uniformity, and thermal stability directly alter process capability calculations across converting runs.
Biaxially oriented polyethylene terephthalate provides high tensile strength, thermal resistance, and excellent gas isolation when vacuum-metallized or coated with silicon oxide. Cast polypropylene and polyethylene films supply heat-sealing capabilities but exhibit higher thermal elongation under tension. Ethylene vinyl alcohol coextrusions supply gas resistance that varies depending on relative humidity levels.
Surface treatment of non-polar polyolefin films forms a primary operational control point. Polyethylene surfaces demand dyne levels of 40 to 42 dynes per centimeter for proper wetting of polyurethane adhesives, while polyester webs require dyne levels above 52 dynes per centimeter.
| Structure Composition | Target Peel (N/15mm) | OTR Limit (cc/m2/day) | WVTR Limit (g/m2/day) | Coat Weight (g/m2) |
|---|---|---|---|---|
| 12 um PET / 7 um Alufoil / 70 um LLDPE | 3.5 | 0.05 | 0.05 | 3.2 |
| 12 um PET / 15 um BOPA / 50 um CPP | 4.0 | 15.00 | 2.50 | 3.8 |
| 12 um PET-SiOx / 60 um PE-EVOH-PE | 2.8 | 0.50 | 0.80 | 2.2 |
| 20 um BOPP-Met / 30 um LLDPE | 2.2 | 25.00 | 0.60 | 1.8 |
Barrier Integrity Degradation Mechanics
Inorganic barrier coatings like vacuum-deposited aluminum, aluminum oxide, and silicon oxide present distinct process control challenges. Thin brittle barrier layers measuring between 10 and 50 nanometers in thickness fracture easily under mechanical stress. Excess web tension over laminating rollers creates micro-cracks in the inorganic layer.
These micro-fractures elevate oxygen and moisture transmission rates by orders of magnitude without showing visual defects on the converting floor.
Corona treatment intensity requires tight operational monitoring. Undertreated film leads to adhesive dewetting, low peel strength, and eventual inter-layer separation. Overtreated film generates low-molecular-weight oxidized species on the film surface.
These weak boundary layers cause adhesive failure at low stress values, even when initial surface tension tests indicate high dyne readings.
Substrate thickness variations introduce transverse web tension differentials during lamination. A gauge band variation of plus or minus 5 percent on a 50-micrometer polyethylene film creates localized high-pressure zones in the lamination nip. High-pressure zones cause adhesive squeeze-out, leaving thin adhesive deposits along ridge lines while adjacent valleys retain thick, uncured adhesive pockets.
This uneven distribution shifts local bond strength and curing kinetics, widening the process standard deviation and lowering long-term capability ratios.
Converters frequently blame raw film supplier gauge variations when lamination bond strength distributions fail to hit target capability indices.

Tack
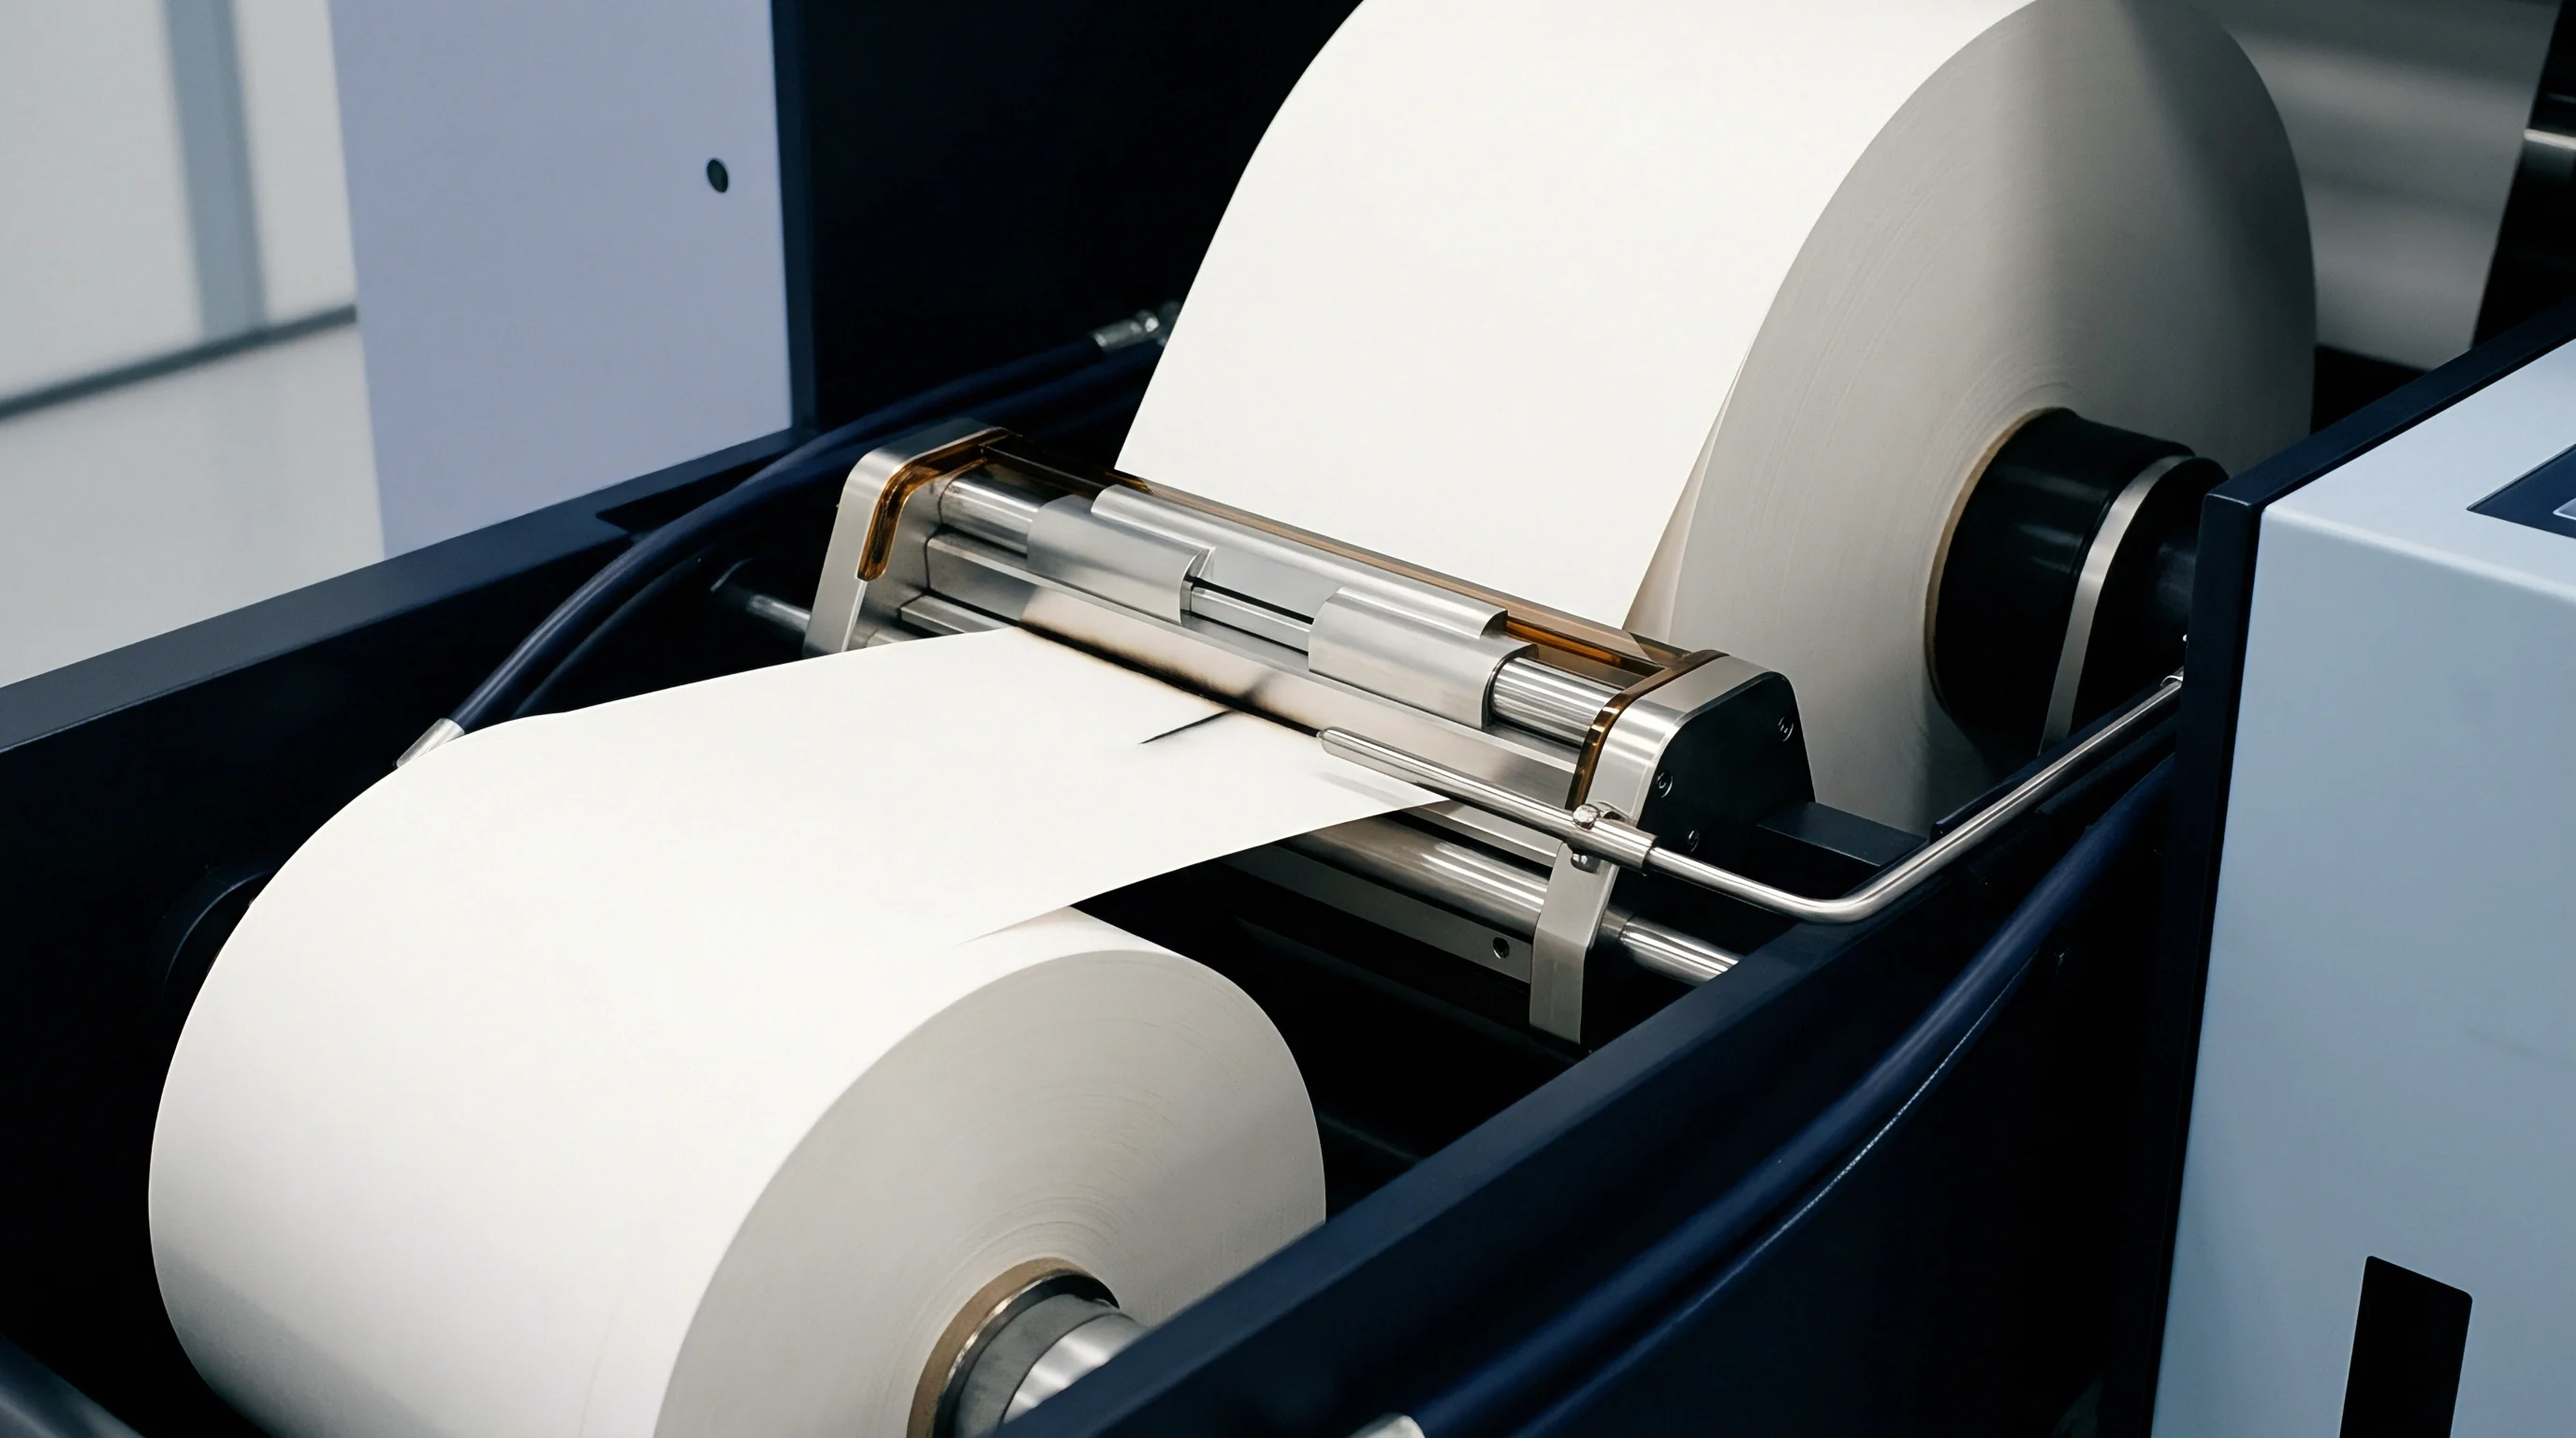
Lamination machinery balances heat, pressure, line speed, and web tension to form permanent bonds between film plies. Modern solventless and solvent-based laminators operate at speeds exceeding 400 meters per minute, leaving nip dwell times under 15 milliseconds. Achieving wet tack and long-term chemical bonding within these short timeframes demands tight control over process variables.

Where Does Interfacial Tension Fail in Corona Treatment?
Dynamic wetting occurs at the exact point of adhesive application. When surface energy mismatches occur, the liquid adhesive film splits unevenly, creating microscopic voids across the web surface. Low interfacial tension allows the adhesive to flow smoothly across film micro-topography before entering the nip pressure zone.
Adhesive application and curing follow precise procedural steps that dictate final process capability figures:
- Verify unwinder web tension settings across primary and secondary film stations using calibrated load cells.
- Measure corona treater power output and confirm dynamic dyne level on incoming non-polar webs prior to adhesive application.
- Control adhesive mixing ratios for two-component polyurethane systems using automatic metering units with density monitoring.
- Regulate application cylinder temperature and smooth roll gap settings to hold target wet coat weight within plus or minus 0.1 grams per square meter.
- Maintain drying tunnel temperature zones and exhaust airflow velocity to remove carrier solvents while preventing surface skinning.
- Set lamination nip steel roll temperature between 60 and 80 degrees Celsius with pneumatic cylinder pressure set to 4 to 6 bar.
- Transfer laminated rolls to a temperature-controlled curing chamber held at 40 degrees Celsius for 24 to 72 hours to complete chemical cross-linking.
Solventless laminators apply 100 percent solid liquid polyurethane adhesives at elevated temperatures. Application rolls operate between 40 and 60 degrees Celsius to drop adhesive viscosity to workable application ranges. Lower application temperatures increase adhesive viscosity, causing orange-peel optical defects and uneven coat weight profile.
Higher temperatures accelerate premature cross-linking inside the adhesive pan, leading to coat weight drift across long production runs.
A two-component polyurethane adhesive system requires 48 hours of climate-controlled curing at 40 degrees Celsius before achieving maximum mechanical shear strength.
Curing kinetics introduce time-dependent variation into capability measurements. Two-component polyurethane adhesives react monomeric isocyanates with hydroxyl-terminated polyols. Initial tack immediately after the nip relies purely on physical viscosity and green strength.
Full chemical cross-linking requires 24 to 72 hours under controlled thermal conditions. Testing bond strength immediately off the machine yields unrepresentative capability figures. Quality verification protocols enforce standardized aging periods prior to specimen destruction.
Process control stability improves when web tension adjustments match film elasticity profiles across temperature gradients.

Arithmetic
Process capability evaluation requires distinguishing short-term process potential from long-term process performance. Short-term calculations, represented by Cp and Cpk, utilize subgroup standard deviation derived from range charts or sample standard deviations within small, consecutive production batches. Long-term calculations, represented by Pp and Ppk, calculate overall population standard deviation across multiple shifts, raw material lots, ambient temperature changes, and operator shifts.
Rational subgrouping strategies form the foundation of valid lamination capability studies. Subgroups must capture short-term machine variability while isolating long-term process shifts. Collect three to five consecutive lamination samples across the web width at set time intervals during a continuous production run.
Sampling across the left, center, and right sections of the web identifies transverse profile variability caused by roll deflection, uneven nip pressure, or drying tunnel air temperature gradients.

Worked Example: Oxygen Transmission Rate Transformation
Consider a high-barrier packaging line producing a three-layer laminate consisting of 12 um PET, 7 um Alufoil, and 70 um LLDPE. The designated upper specification limit for oxygen transmission rate is 0.10 cc/m2/day. Baseline historical performance shows potential pinhole defects causing skewed permeation distributions.
A continuous capability trial collects 50 rational subgroups of 3 samples each across a 100,000-meter converting lot. Raw permeation measurements yield a non-normal distribution skewed strongly toward zero, with a sample mean of 0.035 cc/m2/day and an overall standard deviation of 0.022 cc/m2/day.
Calculating standard, unadjusted performance parameters using standard equations yields:
Ppk_unadjusted = (USL – Mean) / (3 SD_overall)
Ppk_unadjusted = (0.10 – 0.035) / (3 0.022) = 0.065 / 0.066 = 0.98
An unadjusted Ppk of 0.98 suggests inadequate process capability, signaling high non-conformance rates. However, because permeation data cannot drop below zero, the lower tail is compressed and the upper tail extends outward, breaking Gaussian assumptions. Applying a Box-Cox transformation stabilizes variance and normalizes the dataset.
The optimal lambda parameter identified for this dataset is lambda = 0.20.
Transform each individual raw data point (X) to transformed value (Y):
Y = (X^lambda – 1) / lambda
Transforming the upper specification limit (USL = 0.10):
USL_transformed = (0.10^0.20 – 1) / 0.20 = (0.63095 – 1) / 0.20 = -1.8452
Transforming the sample dataset yields a normalized mean of -2.6210 with a normalized overall standard deviation of 0.2150. Calculate transformed performance index:
Ppk_transformed = (USL_transformed – Mean_transformed) / (3 SD_transformed)
Ppk_transformed = (-1.8452 – (-2.6210)) / (3 0.2150) = 0.7758 / 0.6450 = 1.20
The transformed Ppk figure of 1.20 accurately reflects the physical capability of the barrier process, showing that the converting line operates close to an acceptable capability threshold once distribution skewness is accounted for mathematically.
| Capability Index (Cpk / Ppk) | Process State | Single-Sided PPM | Non-conforming Rate (%) |
|---|---|---|---|
| 0.67 | Inadequate | 22,750 | 2.27500 |
| 1.00 | Barely Capable | 1,350 | 0.13500 |
| 1.33 | Capable | 32 | 0.00320 |
| 1.67 | Highly Capable | 0.29 | 0.00003 |
| 2.00 | Six Sigma Level | 0.001 | 0.000001 |

Long-Term Stability Assessment
Comparing short-term Cpk to long-term Ppk reveals operational instability. A significant gap between Cpk and Ppk indicates that special cause variation degrades the process over time. Primary sources of long-term instability include raw film batch-to-batch variations, ambient humidity fluctuations affecting waterborne or solventless adhesive curing rates, machine thermal expansion during warm-up periods, and operator adjustments.
Process capability metrics must incorporate total web width profiles. Measuring only the web center masks edge-to-edge variance caused by laminating roll deflection. Roll deflection under hydraulic pressure reduces core contact force while elevating edge pressure.
This condition causes low bond strength along the web center and adhesive squeeze-out along the web edges, degrading overall process yields.
Contractual packaging specifications strictly enforce ISO 22514-2 standard calculation procedures, invalidating quality reports that omit non-normal distribution transformations on permeation parameters.

Verification
Analytical verification confirms that measured physical parameters reflect actual product compliance rather than gauge error. Measurement System Analysis, executed through Gage Repeatability and Reproducibility studies under AIAG guidelines, isolates measurement instrument variance from actual process variance. A capability study performed with an unverified measurement system produces deceptive capability indices.
Destructive peel testing under ASTM F904 introduces operator-dependent variation. Sample cutting alignment, T-peel angle consistency, and jaw separation speed directly shift measured force values. Standard tensile tester crosshead speed is set to 280 to 300 millimeters per minute.
Deviations in jaw speed shift measured peel forces due to the viscoelastic nature of polyurethane adhesives. A Gage R&R result exceeding 30 percent total variation renders the testing equipment incapable of assessing process capability.
Failure modes in barrier lamination stem from procedural oversight across chemical, mechanical, and analytical domains:
- Adhesive Ratio Drift shifting stoichiometric balance between polyol and solventless polyisocyanate components, leaving unreacted monomeric species and permanent low peel strength.
- Solvent Entrapment caused by excessively rapid surface skinning in early drying tunnel zones, elevating residual ethyl acetate above migration limits under EN 13628.
- Corona Decay occurring on stored polyolefin rolls prior to lamination, dropping surface energy below 38 dynes per centimeter and causing inter-layer delamination.
- Thermal Shrinkage Strain induced by high lamination nip temperatures on oriented polypropylene films, creating web curling and heat-seal jaw misalignment during pouch forming.
- Pinhole Degradation resulting from excessive web tension over small-diameter idler rollers, cracking metallic or inorganic barrier deposits and inflating oxygen passage.
Regulatory Compliance Verification Protocols
Verification extends beyond physical bond strength to encompass regulatory safety compliance. Food contact laminates must comply with European Union Regulation 10/2011 and Framework Regulation 1935/2004. Primary aromatic amines, formed by the reaction of monomeric aromatic isocyanates with ambient moisture, carry an absolute migration limit of 0.01 milligrams per kilogram of food or food simulant under Commission Regulation 2020/1245.
Overall migration testing under EN 1186 requires exposing laminate sealant surfaces to simulant D2 for 10 days at 40 degrees Celsius to clear room-temperature food contact applications.
Testing for primary aromatic amines demands spectrophotometric or LC-MS/MS analytical verification following initial curing. Fast-acting aromatic polyurethane adhesives require full compliance verification prior to reel slitting. Shipping un-cured laminated reels to converting plants before verifying aromatic amine decay creates severe regulatory exposure under European market surveillance rules.
Suppliers presenting statistical process capability certificates without attaching corresponding measurement system analysis reports hand buyers non-conforming lots masked by wide measurement error.


Exposure
Commercial exposure in cross-border barrier packaging procurement stems directly from unverified process capability claims. Modern regulatory frameworks, including the European Union Packaging and Packaging Waste Regulation, impose strict recyclability and recycled-content obligations. Laminated flexible structures combining incompatible polymers face heavy financial penalties or market delisting if they fail recyclability design guidelines under EN 13430.
Single-use packaging compliance requires complete, traceable documentation files. Importing flexible barrier packaging across international borders shifts legal compliance obligations to the importer of record. If custom authorities pull samples that fail declared residual solvent limits or exhibit aromatic amine migration above statutory thresholds, the importer faces immediate shipment seizure, product recall costs, and administrative fines.
Verification protocols demand assembling a defensible compliance dossier before authorizing commercial shipments:
- Scope Matching Verification checking that raw film FSC or PEFC chain-of-custody codes and food contact compliance declarations precisely cover the specific polymer grades and coat weights delivered in the commercial shipment.
- Batch Testing Synchronization confirming that Certificate of Analysis test numbers correspond directly to production lot codes on delivered roll core labels rather than historical design qualification reports.
- Transformation Audit Review reviewing supplier capability analysis files to ensure non-normal barrier data was properly transformed prior to generating Cpk and Ppk index numbers.
- Migration Boundary Validation verifying that migration test conditions under EN 1186 match actual filling, thermal processing, and shelf-life storage temperatures experienced by the final packaged product.
- Recyclability Assessment Protocol confirming that multi-material laminate combinations comply with regional sorting and recycling stream guidelines under PPWR design requirements without relying on uncertified balance declarations.

Contractual Risk Allocation
Purchase specifications must translate statistical capability targets into enforceable contractual terms. Quality agreements that specify vague requirements like clean, commercially acceptable lamination fail to protect buyers during disputes. A robust procurement contract specifies exact process capability indices across critical quality characteristics, supported by mandatory statistical reporting protocols.
Contractual terms should establish that a process capability index dropping below 1.33 for critical parameters like oxygen transmission rate or seal bond strength grants the buyer immediate right of lot rejection. The contract must mandate that suppliers utilize automated 100 percent optical inspection systems to detect visual lamination defects, coating streaks, and inclusions down to 0.5 square millimeters. Suppliers failing to supply continuous SPC chart data alongside Certificates of Analysis forfeit protection against secondary processing claims.
Financial exposure increases exponentially when non-conforming barrier film passes through printing, slitting, and pouch-forming operations before failing at the customer filling line. Claim settlements covering lost product, line downtime, and brand damage far exceed the initial roll stock purchase price. Establishing process capability rigor at the lamination nip provides the primary defense against systemic commercial loss.