Fiber Length Distribution in Recycled Board Furnish
Recycled containerboard structural performance depends on length-weighted fiber averages and fines caps measured by automated optical polarising analysis.
Morphology
Pulp recycled from packaging waste contains a heterogeneous population of plant cell walls, synthetic contaminants, and mineral fragments. Processing old corrugated containers (OCC), mixed paper waste, and double-lined kraft (DLK) clippings alters the structural composition of the stock with every repulping loop. Primary virgin softwood fibers, initially ranging between 2.5 mm and 4.5 mm in length, undergo mechanical shearing during pulping, pumping, and refining operations.
Softwood fibers maintain structural integrity. This mechanical action breaks long tracheids into truncated segments while generating micro-fines. Hardwood fibers, with initial lengths between 0.8 mm and 1.6 mm, experience similar breakdown, shifting the overall population balance toward shorter dimensional fractions.
Softwood pulp fractions deliver the primary skeletal network in linerboard, whereas degraded short fibers and ray cells accumulate in fluting medium furnishes.
Characterizing this complex mixture demands an exact understanding of how fiber length distribution (FLD) is measured and reported. Traditional classification methods, such as the Bauer-McNett screen classifier governed by TAPPI T 233, physically separate furnish into discrete fraction buckets based on wire mesh retention. While useful for bulk physical separation, wet screen classification lacks the precision required for modern high-speed paper machine stock preparation.
Automated optical analyzers, operating under ISO 16065-2 and TAPPI T 271, have replaced mechanical screening for routine laboratory and inline quality control. These optical instruments pass highly diluted fiber suspensions through a narrow flow cell, using polarized light and digital image processing to measure tens of thousands of individual particles in minutes.

Automated Fiber Profiling Standards
Optical image analysis platforms operating under ISO 16065-2 measure thousands of individual elements per minute using polarized light sources. The instrument software calculates three distinct statistical averages from the raw particle data, each offering a different window into furnish quality. The arithmetic mean length (Ln) sums all measured particle lengths and divides by the total count.
This metric is heavily skewed by small fragments and fines; a large quantity of microscopic parenchymal cells or broken fibrils suppresses Ln without accurately representing the load-bearing capacity of the stock. Fines reduce wet-end drainage velocity.
To correct for numerical skew, automated analyzers calculate the length-weighted average length (Ll) and the weight-weighted (or volume-weighted) average length (Lw). Length-weighted calculations weight each fiber by its own length, providing a metric that correlates closely with inter-fiber bonding potential and network tensile strength. Weight-weighted calculations square the length component, emphasizing the long-fiber skeletal fraction that governs tear resistance and sheet formation dynamics.
The mathematical relationships defining these distribution metrics appear below:
Ln = fracsum ni lisum ni
Ll = fracsum ni li2sum ni li
Lw = fracsum ni li3sum ni li2
In these equations, ni represents the number of fibers collected in a specific length category, and li is the mid-point length of that category. In recycled board furnishes, the gap between Ln and Lw widens as the furnish degrades. A broad spread between arithmetic and weight-weighted averages indicates a highly polydisperse furnish containing both intact virgin softwood remnants and high volumes of severely broken fibers and fines.
TAPPI T 271 optical analyzer measurement at 23 C and 50 percent relative humidity records a length-weighted average fiber length reduction from 2.45 mm to 1.62 mm after four recycling loops.

Mathematical Definitions of Average Length
Calculations based on simple numerical counting assign equal weighting to a microscopic fragment and a three-millimeter pinewood element. In a typical recycled board furnish, particles smaller than 0.20 mm ~ defined as the P200 fines fraction in Bauer-McNett testing ~ can account for up to 80 percent of the absolute particle count while contributing less than 10 percent of the total cellulosic mass. Fines accumulation degrades sheet compression strength.
High fines populations clog the wet web matrix, restricting water passage during vacuum dewatering and pressing.
The distribution curve of recycled packaging furnish rarely follows a single Gaussian normal distribution. High-grade recycled linerboard displays a bimodal distribution curve, featuring a secondary peak between 2.0 mm and 3.0 mm corresponding to unbleached softwood kraft, and a primary peak between 0.6 mm and 1.2 mm representing recycled hardwood and broken softwood segments. As the recycled content shifts toward 100 percent mixed waste, the secondary long-fiber peak collapses, creating a unimodal distribution skewed heavily toward the sub-millimeter range.
| Furnish Grade | Arithmetic Mean Ln (mm) | Length-Weighted Ll (mm) | Weight-Weighted Lw (mm) | Fines Content P200 (%) |
|---|---|---|---|---|
| 100% Unbleached Kraft Scraps (DLK) | 0.95 to 1.15 | 2.10 to 2.40 | 2.70 to 3.00 | 8.0 to 12.0 |
| Standard Premium OCC (80/20 Softwood/Hardwood) | 0.70 to 0.85 | 1.60 to 1.90 | 2.20 to 2.50 | 15.0 to 20.0 |
| Sorted Mixed Packaging Waste | 0.45 to 0.60 | 1.10 to 1.35 | 1.60 to 1.85 | 24.0 to 32.0 |
| Deinked High-Yield Recycled Board Stock | 0.50 to 0.65 | 1.25 to 1.50 | 1.75 to 2.00 | 20.0 to 26.0 |
Understanding these mathematical distinctions allows mill operators and buyers to diagnose structural performance dips. A stock lot showing an acceptable weight-weighted average length can still fail on the paper machine if the fines fraction is abnormally elevated. The long fibers build the network, but the short fibers and fines dictate the density, drainage rate, and internal bond strength of the finished board.
How far can optical analyzer algorithms compensate for fiber wall collapse when calculating true hydrodynamic volume in heavily recycled stock?

Screen
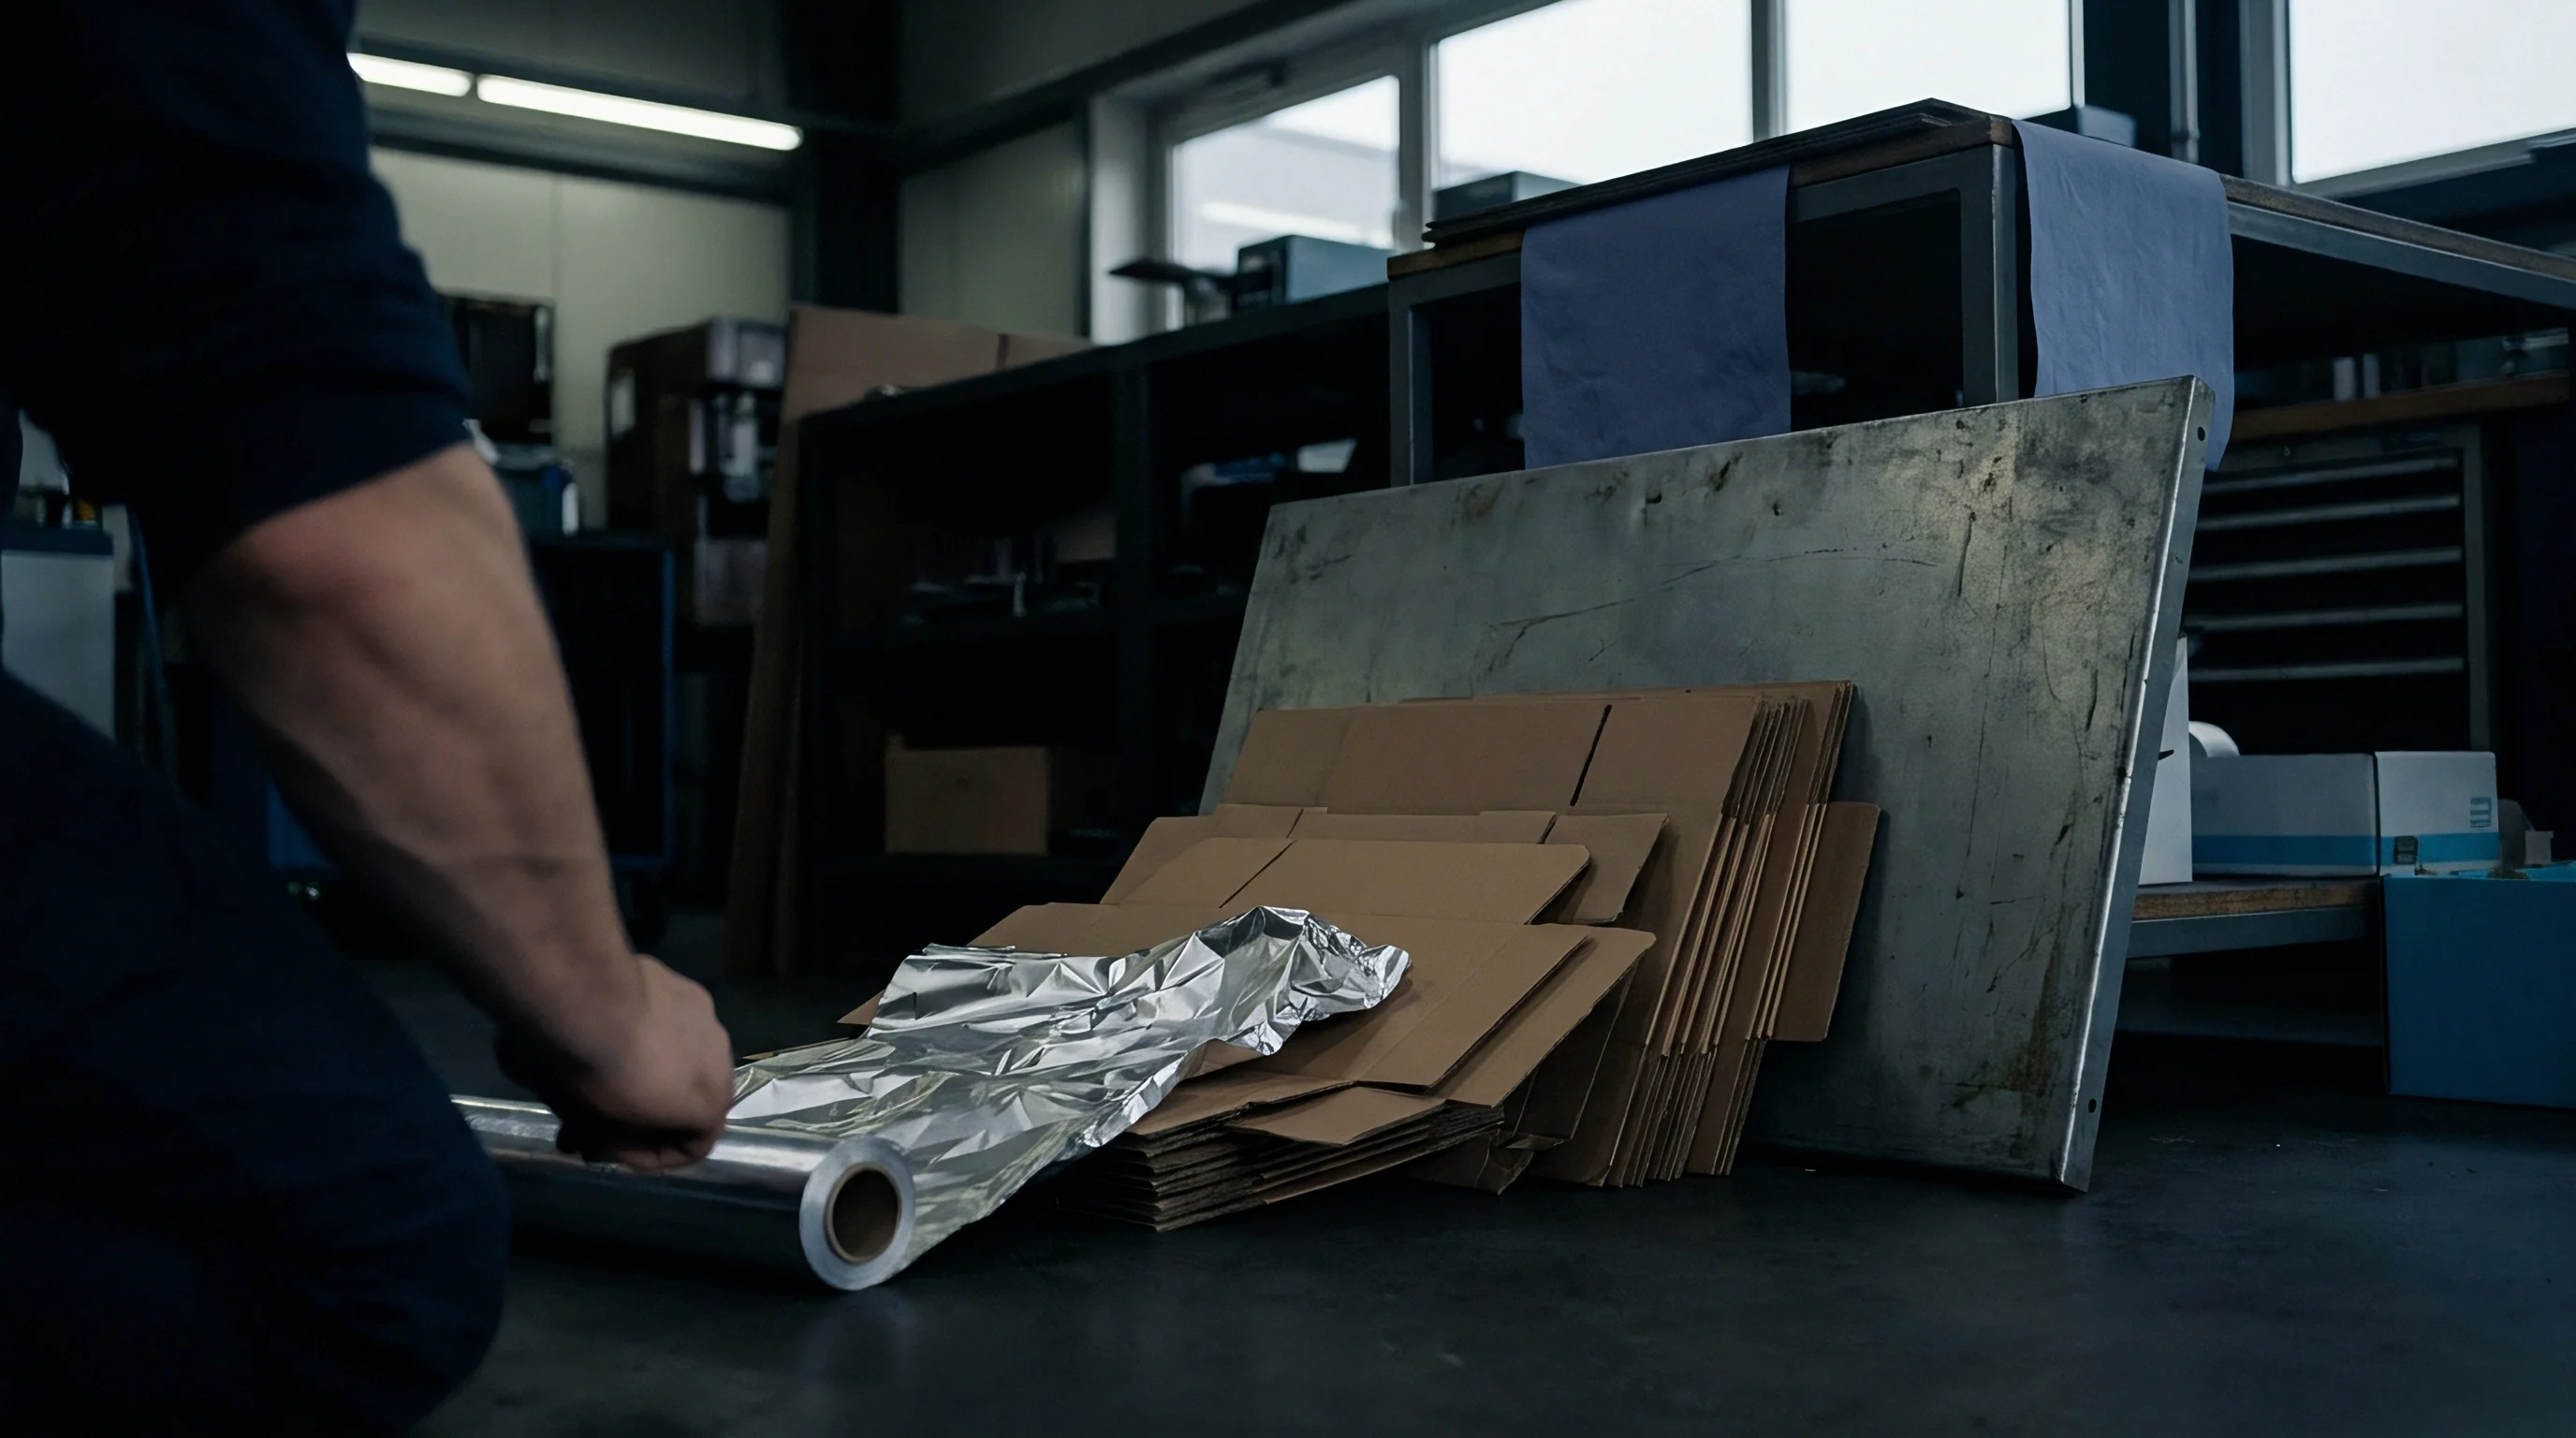
Mechanical separation in modern stock preparation systems divides raw recycled slurry according to particle dimensions and hydrodynamic drag. Mechanical fractionation allows recycled paper mills to split a single mixed furnish stream into two distinct streams: a long-fiber fraction (LFF) enriched with structural softwood components, and a short-fiber fraction (SFF) containing short hardwood fibers, broken fragments, and fine particulate matter. Pressure screens split furnish streams efficiently.
By directing long fibers to the outer facing plies of multi-ply linerboard and short fibers to the inner core or fluting medium, mills optimize sheet strength while consuming less virgin fiber.
The primary workhorse of furnish separation is the pressure screen fitted with narrow slotted screen baskets. Slot width selection governs the efficiency and cut-point of the fractionation process. Modern high-efficiency fractionators utilize contoured screen baskets with slot widths ranging from 0.12 mm to 0.22 mm.
The contoured surface creates localized micro-turbulences driven by an internal rotating element, preventing fiber mats from blinding the narrow slots while allowing short, flexible fibers to pass through into the accept stream.

Pressure Fractionation Dynamics
Slotted baskets operating with internal rotor elements isolate long structural components from short degraded fragments. The passing velocity through the screen slots, combined with the volumetric reject rate, determines the sharpness of the distribution split. Running a fractionator at a high reject rate (30 to 50 percent by mass) forces a higher proportion of medium-length fibers into the reject stream, increasing the length-weighted average length of the LFF.
Low reject rates yield a cleaner short-fiber accept stream but dilute the quality of the long-fiber reject stream.
ISO 16065-2 compliance demands automated optical polarising measurement of at least 10000 fibers per batch to prevent structural grade misclassification.
Hydrocyclone cleaner systems complement mechanical screening by separating particles based on density and shape rather than length alone. High-density contaminants like sand, glass, and staples drop out in forward cleaners, while low-density adhesives, waxes, and plastics drop out in reverse micro-cleaners. Hydrocyclones remove heavy particulate contaminants.
In recycled furnish preparation, heavy-medium hydrocyclones also separate coarse cell wall fragments from thin, flexible fibers, refining the purity of the long-fiber fraction before wet-end sheet formation.
Density Separation Systems
Optimizing pressure fractionation requires managing multiple interlocking mechanical variables across the stock prep circuit. Tailoring these operating parameters prevents system blinding, minimizes energy consumption, and maintains precise control over fiber length splits.
- Slot Contour Geometry controls localized micro-turbulence at the basket wall, preventing high-consistency fiber mat formation and maintaining high volumetric throughput.
- Rotor Tip Speed generates pressure pulses that continuously clear fine debris from screen openings, stabilizing differential pressure across the basket.
- Volumetric Reject Ratio sets the quantitative split between long-fiber and short-fiber output streams, directly altering the length-weighted average of both fractions.
- Stock Feed Consistency dictates inter-fiber network friction inside the screen housing, where consistencies above 1.8 percent cause severe slot plugging.
- Accept Passing Velocity governs the hydrodynamic shear forcing fibers through narrow apertures, influencing whether rigid medium-length fibers pass or align into the reject stream.
Screening efficacy drops sharply when furnish consistency drifts above design thresholds or when basket contour wear smooths micro-turbulence grooves. Running slotted screens past their operational wear life allows long structural fibers to escape into the short-fiber stream, weakening the structural plies of the finished board. High consistency stock blinds narrow screen slots long before mechanical rotor wear degrades hydrodynamic separation efficiency.


Stiffness
Compression performance in corrugated packaging correlates directly with the structural integrity of the individual cell wall network. As board furnishes transition to higher recycled contents, fiber shortening reduces the number of load-bearing elements bridging structural voids within the paper matrix. Short fibers lower tear resistance significantly.
Inter-fiber bonding capacity depends on both fiber length and surface area available for hydrogen bonding. When fiber length drops, the total end-to-end stress distribution capacity across the sheet collapses, leading to premature structural instability under compressive stacking loads.
The Short-span Compression Test (SCT), measured per ISO 9895, serves as the primary benchmark for predicting box compression performance. SCT measures the ultimate compressive strength of paperboard over a gauge length of just 0.70 mm. Because this short clamp distance minimizes physical sheet buckling, SCT evaluates the intrinsic strength of the fiber network and inter-fiber bonds.
A furnish dominated by short, broken fibers achieves lower SCT values at identical basis weights compared to a furnish rich in long softwood fibers.
Is Fiber Shortening Predictable across Multiple Recycling Loops?
Repeated repulping and drying cycles progressively collapse the internal lumen structures of papermaking elements through hornification. Hornification permanently reduces cell wall swelling capability and flexibility, limiting the contact area available for hydrogen bonding during sheet consolidation. Consequently, recycled fibers of identical physical length yield lower compression strength than virgin fibers of the same dimension.
Tensile failure follows inter-fiber bond disruption. The table below illustrates how mechanical properties decline across fractionated and unfractionated OCC stocks at a constant basis weight of 150 g/m².
| Furnish Fraction | Length-Weighted Ll (mm) | SCT Index (kN/m) | Ring Crush Test (N) | Tensile Index (Nm/g) | Tear Index (mNm²/g) |
|---|---|---|---|---|---|
| Unfractionated Standard OCC | 1.75 | 22.5 | 210 | 52.0 | 7.8 |
| Long-Fiber Fraction (LFF Reject) | 2.25 | 28.0 | 265 | 66.0 | 10.5 |
| Short-Fiber Fraction (SFF Accept) | 1.20 | 17.0 | 155 | 38.0 | 5.2 |
| LFF Blended with 15% Virgin USK | 2.55 | 31.5 | 295 | 74.0 | 12.2 |
The Ring Crush Test (RCT), specified in ISO 12192, measures the edgewise compression resistance of a paper strip formed into a cylinder. Unlike SCT, RCT sensitivity extends to sheet stiffness and flexural rigidity. Short fiber furnishes show severe deficits in RCT because short fibers fail to maintain structural spacing under flexural load, causing localized cell wall shear failure along the paper plane.
Coarse mechanical refining of short recycled fibers increases fines generation without restoring inter-fiber bonding strength.

Structural Failure Modes
Converting operations subject double-face corrugated board to severe localized mechanical deformation during scoring and folding. When outer linerboard plies are flexed along creasing lines, the outer surface fibers experience extreme tensile elongation while inner plies undergo compressive strain. Linerboard formulated from degraded, short-fiber recycled stock lacks the tensile elongation capacity required to absorb scoring deformation without fracturing.
Score fracture opens cracks along the flap hinge line, destroying the compression capacity of the assembled shipping container.
Z-direction tensile strength (internal bond strength), evaluated via ISO 15754, reveals another critical structural vulnerability linked to fiber length distribution. In multi-ply board grades, short fibers and fines migrate toward the interface between plies during wet web consolidation. High fines concentrations at ply boundaries reduce interlaminar toughness.
Under high-speed offset or flexographic printing press impressions, tacky inks pull short surface fibers from the sheet matrix, causing linting, picking, and eventual ply delamination. Purchasing recycled containerboard based on basis weight alone without enforcing minimum length-weighted fiber thresholds risks catastrophic score fracture on high-speed packaging lines.


Refining
Mechanical treatment of recycled stock alters cell wall flexibility without restoring lost physical length. Low-consistency (LC) refining, operating at 3.5 to 4.5 percent solids consistency, represents the primary industrial method for enhancing inter-fiber bonding in recycled board mills. LC refiners push stock slurry through narrow gaps between rotating dished plates fitted with pattern bars and grooves.
The primary objective is inducing internal fibrillation ~ loosening the cell wall sub-layers to increase fiber flexibility and swelling ~ and external fibrillation, which peels micro-fibrils from the outer secondary wall to expand the surface area for hydrogen bonding.
Refining recycled fiber demands precise energy application. Recycled fibers are brittle due to prior drying loops and hornification. Applying excessive refining intensity cuts fibers cleanly rather than fibrillating them, causing further reductions in length-weighted average length and dramatically increasing fines generation.
Refining decreases sheet drainage capacity quickly.

Specific Edge Load Parameters
Disk pattern geometry and rotational speed dictate the intensity of mechanical impacts delivered to passing stock slurry. Mill engineers quantify refining intensity through the Specific Edge Load (SEL) theory, measured in Joules per meter (J/m). SEL calculates the net power delivered to the stock divided by the cutting edge length per second produced by the crossing bar edges.
The mathematical formula for SEL is:
SEL = fracPnetCEL = fracPtotal – Pnoloadsum (nr · ns · ledge · ω)
Where Pnet is net refining power in kilowatts, Pnoload is rotational power loss running in water, nr and ns are bar counts on rotor and stator, ledge is active bar length, and ω is rotational velocity. For recycled softwood fibers, SEL must be held between 1.2 J/m and 1.8 J/m to promote fibrillation while preventing fiber cutting. For short hardwood fractions, SEL must be kept low, between 0.4 J/m and 0.8 J/m.
Operating above these intensity thresholds shreds degraded fibers, dropping Ll rapidly while flooding the wet end with P200 fines.

Chemical Wet End Reinforcement
Synthetic polymer additions build synthetic bridges across inter-element contact points when mechanical length falls short of structural specs. Wet-end chemical strength additives bypass the drainage penalties associated with aggressive refining. Cationic cooked corn starches, applied at dosages between 8 kg/t and 15 kg/t of dry pulp, adsorb onto negatively charged fiber surfaces, enhancing hydrogen bonding networks.
Synthetic resins, including glyoxylated polyacrylamide (GPAM) and polyvinylamine (PVAm), provide additional dry strength by forming cross-linked chemical networks across fiber contact zones.
| Refining Condition | SEL Intensity (J/m) | Specific Energy (kWh/t) | Chemical Dosage | CSF Freeness (mL) | Tensile Index (Nm/g) | Ll (mm) |
|---|---|---|---|---|---|---|
| Unrefined Raw OCC Control | 0.00 | 0 | None | 460 | 44.0 | 1.82 |
| Gentle Fibrillating LC Refining | 0.80 | 35 | None | 390 | 56.0 | 1.78 |
| Aggressive Cutting LC Refining | 2.40 | 65 | None | 280 | 51.0 | 1.41 |
| Gentle Refining + Polymer System | 0.80 | 35 | 1.2% Cationic Starch + 0.2% GPAM | 410 | 68.0 | 1.76 |
| Virgin Softwood Kraft Blend (20%) | 1.40 (on Virgin) | 40 (on Virgin) | 0.8% Cationic Starch | 440 | 72.0 | 2.15 |
Executing a controlled trial to establish optimal refining intensity and chemical dosage requires a systematic approach on the stock preparation line.
- Sample incoming raw pulp slurry prior to refiner inlet to establish baseline values for freeness, length-weighted average fiber length, and P200 fines content.
- Set refiner plate gap to no-load power position, establishing baseline mechanical drive resistance running pure water slurry at target production consistency.
- Increase motor load incrementally to achieve initial target specific energy input while monitoring differential pressure and temperature rise across the refiner housing.
- Collect post-refiner pulp samples at each energy increment to evaluate changes in length-weighted fiber distribution and freeness drop per applied kilowatt-hour per tonne.
- Initiate wet-end cationic starch dosing at low rates, adjusting chemical feed to offset refining energy reductions while tracking sheet tensile index on trial parent rolls.
- Perform zero-span tensile testing on handsheets to separate intrinsic fiber strength degradation from inter-fiber bond improvements across each trial leg.
Wet-end chemical addition restores sheet strength. When stock freeness drops below 300 mL CSF due to over-refining, paper machine line speeds must be reduced to accommodate slow wire drainage, destroying mill profitability. The mill technical sales team typically claims that high synthetic polymer dosages fully compensate for severe fiber shortening in lower-cost waste paper grades.


Contract
Specifying recycled board grades establishes clear quantitative boundaries for physical length distributions and fines accumulation limits. Commercial procurement contracts for containerboard and recycled folding boxboard often specify basis weight, caliper, burst strength, and moisture content while omitting parameters governing fiber length distribution. Fibre length measurements confirm supply stability.
Omitting FLD metrics leaves buyers exposed to severe performance variance when mills switch recycled furnish sources to lower-cost mixed waste streams.
Parent roll variation drives converter waste. Mill certificates specify minimum strength thresholds. High-performing buying contracts incorporate explicit FLD parameters measured via automated optical analysis (ISO 16065-2).
Enforcing minimum thresholds for length-weighted average length (Ll) and capping maximum allowable P200 fines percentages ensures that board delivered to converting plants maintains consistent structural integrity, score crack resistance, and runnability.

Quality Control Protocols
Goods-in inspection procedures verify delivered reels against mill certificate parameters prior to converting production. A robust receiving protocol requires extracting core samples from 5 percent of delivered rolls per mill batch lot. Extracted samples undergo rapid repulping and optical fiber analysis to verify compliance with contractual specification bands.
Creasing score fractures on high-speed folder-gluers trace directly to an excess of fines in the outer linerboard furnish.
When delivered board falls below specified length-weighted fiber averages, converting plant productivity declines. Lower short-span compression strength forces converters to increase container basis weights or slow down corrugated board production lines to avoid linerboard tearing during flute formation. Establishing technical parameters within supply agreements protects converters against unannounced mill furnish downgrades.

Economic Blending Tradeoffs
Substitution calculations weigh the market price of virgin unbleached kraft pulp against the ongoing chemical additive expense needed for weak recycled furnish. A worked commercial scenario demonstrates the economic trade-offs inherent in furnish engineering. Consider a mill producing 10,000 tonnes per month of 140 g/m² recycled linerboard.
The mill evaluates two strategies to achieve a target SCT value of 2.20 kN/m on a stock base containing degraded OCC (Ll = 1.45 mm, P200 fines = 22 percent):
Option A relies on heavy wet-end chemical augmentation, adding 15 kg/t of cationic starch at 1.10 USD/kg and 3 kg/t of GPAM strength resin at 2.40 USD/kg, while maintaining 100 percent recycled furnish priced at 180 USD/t. Total chemical surcharge equals 23.70 USD/t, yielding a furnish raw material cost of 203.70 USD/t.
Option B incorporates a 15 percent virgin unbleached softwood kraft (USK) pulp blend (Ll = 2.70 mm) priced at 720 USD/t, reducing recycled OCC consumption to 85 percent. The blended furnish achieves Ll = 1.64 mm, requiring only 5 kg/t of cationic starch at 1.10 USD/kg to hit target SCT strength. Blended raw material cost equals (0.85 180) + (0.15 720) + 5.50 = 266.50 USD/t.
While Option A appears 62.80 USD/t cheaper in raw material costs, it operates at a freeness of 290 mL CSF compared to Option B’s 380 mL CSF. The lower freeness of Option A forces a 12 percent reduction in paper machine operating speed due to steam cylinder drying bottlenecks. For a machine with fixed operational overhead of 15,000 USD per hour, the 12 percent speed reduction adds 34.00 USD/t in conversion cost, while increasing converting floor waste rates by 2.5 percent due to edge cracking.
Total landed cost parity shifts when converting performance and machine throughput are factored into the yield equation.
- Minimum Length-Weighted Average establishes a hard floor for Ll measured under ISO 16065-2, preventing mills from substituting lower-grade mixed waste.
- Maximum Fines Threshold caps the allowable P200 fraction by weight, protecting converting operations against low drainage rates and surface linting.
- SCT to Grammage Ratio enforces minimum structural compression strength per unit mass, eliminating compliance reliance on non-structural filler loading.
- Conditioned Test Mandate compels all certificate physical testing to occur under ISO 187 atmospheric standards of 23 C and 50 percent relative humidity.
- Batch Traceability Clause links delivered pallet and reel identification codes directly to mill reel optical analysis records for rapid dispute resolution.
Standard delivery contracts incorporate ISO 187 conditioning compliance clauses that invalidate strength claims measured under non-standard ambient humidity. Moisture pick-up alters creasing stiffness. When relative humidity rises from 50 percent to 80 percent, fiber hydrogen bonds weaken, reducing board SCT values by up to 25 percent.
Modern procurement specifications dictate that delivered stock failing length-weighted fiber minimums by more than 5 percent triggers an automatic price adjustment equal to the cost of virgin pulp substitution required to restore equivalent sheet strength.